MatLab---基本绘图功能(下)+数据的保存和读取(上)
一、grid on 与 grid off
gird on 显示网格
gird off 关闭网格显示
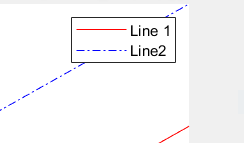
二、legend() 显示图标
legend('Line 1','Line 2')
三、绘制柱状图
bar(1:10,randi([1,10],[1,10]))
四、数据的保存和读取
1.保存数据
maybat1=rand(4,3)
maybat1 =
0.9595 0.9340 0.3922
0.6557 0.6787 0.6555
0.0357 0.7577 0.1712
0.8491 0.7431 0.7060
save testfile.dat maybat1 -ascii
>> type testfile.dat
9.5949243e-01 9.3399325e-01 3.9222702e-01
6.5574070e-01 6.7873515e-01 6.5547789e-01
3.5711679e-02 7.5774013e-01 1.7118669e-01
8.4912931e-01 7.4313247e-01 7.0604609e-01
2.数据的追加
无论矩阵的行列是否相同,都可以追加
mybat2=rand(5,4)
mybat2 =
0.0318 0.6948 0.3816 0.4456
0.2769 0.3171 0.7655 0.6463
0.0462 0.9502 0.7952 0.7094
0.0971 0.0344 0.1869 0.7547
0.8235 0.4387 0.4898 0.2760
save testfile.dat mybat2 -ascii -append
3.数据的读取
load testfile1.dat load 文件名
>> testfile1
testfile1 =
68 12 35 76 70
66 50 59 26 90
17 96 23 51 96
>> %读取文件之后,文件名当作变量名使用;

 浙公网安备 33010602011771号