

一次 grid 布局导致的echarts resize失效的记录
1. 问题背景:
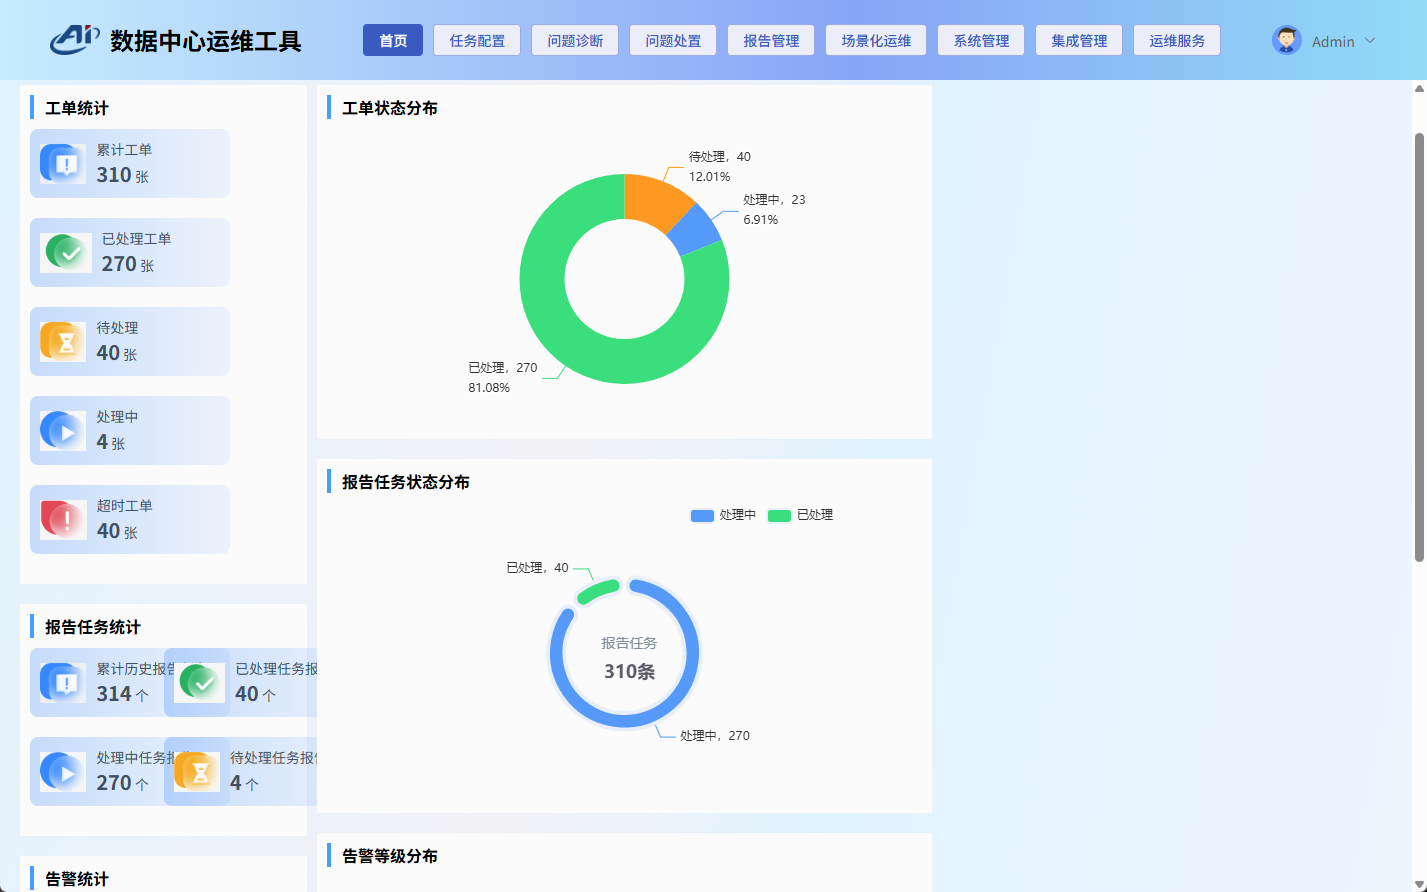
页面使用grid布局分成三列,前两列分别占1fr宽度,第三列固定450px宽度。开始只写了第一列的内容,页面缩放时图表可以正常resize,但是在开始写第二列图表时,缩放页面发现第一列宽度正常缩小,但是第二列的宽度不会自动缩小,要手动刷新页面才可以。
页面主要布局结构如下:
<div class="grid gap-10px grid-cols-3">
  <!-- 第一列内容 -->
  <div class="">
    // ... 原有内容 ...
  </div>

  <!-- 第二列内容 -->
  <div class="">
    // ... 原有内容 ...
  </div>

  <!-- 第三列保持固定宽度 -->
  <div class=""></div>
</div>
页面缩小后的效果图:(中间列宽度没有按预期缩小,左侧列被挤压)
2. 修复问题:
<div class="grid gap-10px grid-cols-[minmax(0,1fr)_minmax(0,1fr)_450px]">
  <!-- 第一列 -->
  <div class="">
    // ... 原有内容 ...
  </div>

  <!-- 第二列 -->
  <div class="">
    // ... 原有内容 ...
  </div>

  <!-- 第三列保持固定宽度 -->
  <div class=""></div>
</div>
修改后的效果图:(一、二列宽度一致且正常缩小,三列固定宽度不变)
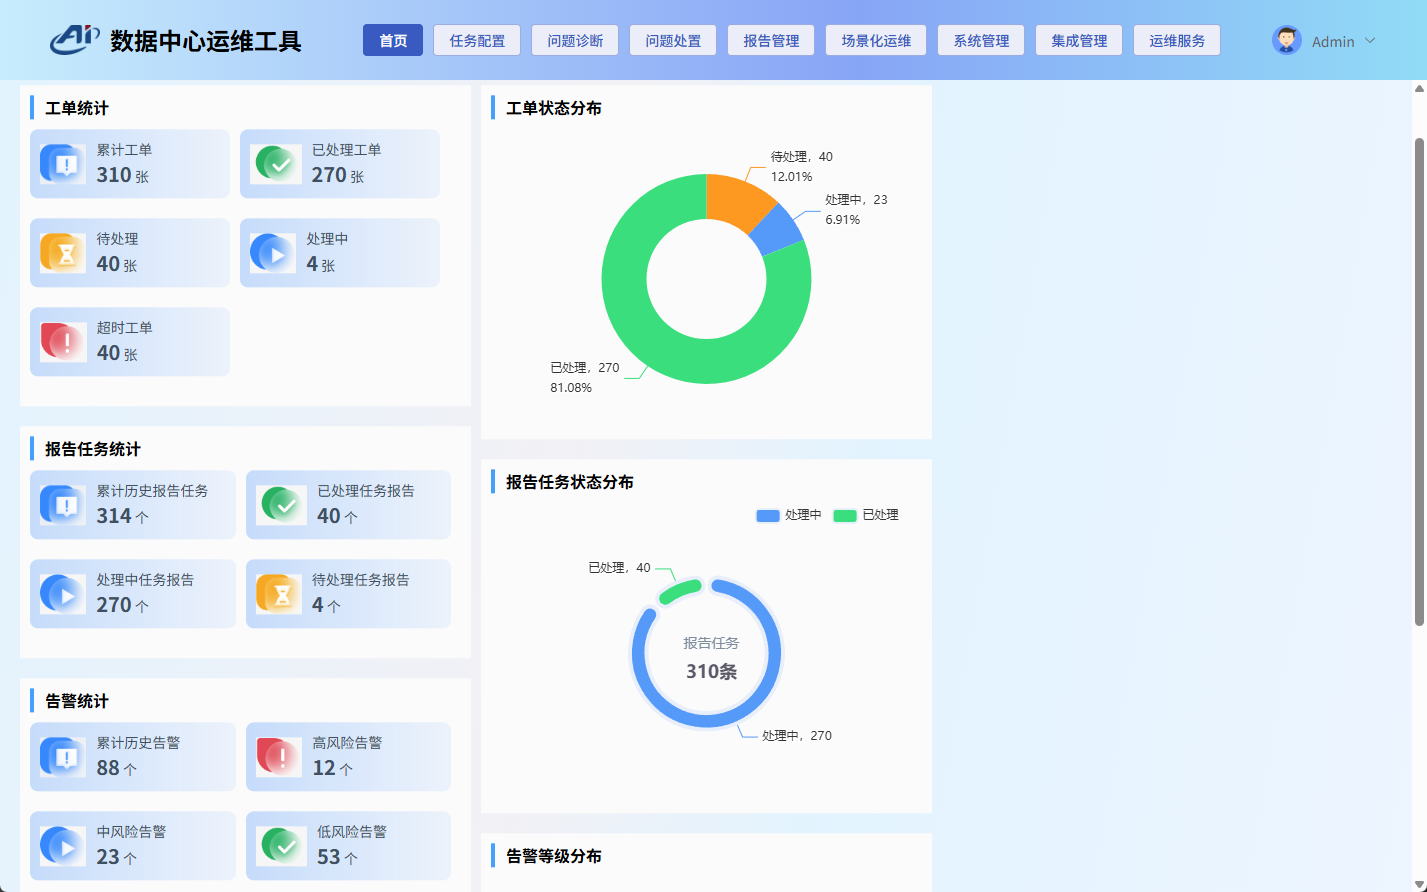
使用 minmax(0,1fr) 替代简单的 1fr,防止内容溢出导致的布局问题。
3. 完整代码(仅用于参考)
点此可查看完整内容代码
<template>
  <div class="h-full p-20px box-border">
    <div class="flex items-center mb-20px">
      <el-button-group class="mr-20px">
        <el-button
          plain
          v-for="item in dateList"
          :key="item.value"
          :class="{
            'active-btn': currentDate === item.value,
          }"
          @click="dateChange(item.value)"
        >
          {{ item.label }}
        </el-button>
      </el-button-group>
      <div class="w-260px">
        <el-date-picker
          v-model="dateSelectValue"
          type="daterange"
          range-separator="至"
          start-placeholder="开始日期"
          end-placeholder="结束日期"
        />
      </div>
    </div>
    <div class="grid gap-10px grid-cols-[1fr_1fr_450px]">
      <div class="">
        <div class="card">
          <div class="card-title">工单统计</div>
          <ul class="card-list flex flex-wrap">
            <li v-for="item in orderList" :key="item.name">
              <img :src="item.icon" alt="" class="h-40px mr-10px" />
              <div class="flex flex-col">
                <div>{{ item.name }}</div>
                <div>
                  <span class="font-bold text-20px">{{ item.value }}</span> 张
                </div>
              </div>
            </li>
          </ul>
        </div>
        <div class="card">
          <div class="card-title">报告任务统计</div>
          <ul class="card-list grid grid-cols-2">
            <li v-for="item in reportList" :key="item.name">
              <img :src="item.icon" alt="" class="h-40px mr-10px" />
              <div class="flex flex-col">
                <div>{{ item.name }}</div>
                <div>
                  <span class="font-bold text-20px">{{ item.value }}</span> 个
                </div>
              </div>
            </li>
          </ul>
        </div>
        <div class="card">
          <div class="card-title">告警统计</div>
          <ul class="card-list grid grid-cols-2">
            <li v-for="item in alarmList" :key="item.name">
              <img :src="item.icon" alt="" class="h-40px mr-10px" />
              <div class="flex flex-col">
                <div>{{ item.name }}</div>
                <div>
                  <span class="font-bold text-20px">{{ item.value }}</span> 个
                </div>
              </div>
            </li>
          </ul>
        </div>
        <div class="card">
          <div class="card-title">任务统计</div>
          <div ref="taskChart" class="h-300px"></div>
        </div>
      </div>
      <div class="">
        <div class="card">
          <div class="card-title">工单状态分布</div>
          <div ref="orderStatusChart" class="h-300px"></div>
        </div>
        <div class="card">
          <div class="card-title">报告任务状态分布</div>
          <div ref="reportStatusChart" class="h-300px"></div>
        </div>
        <div class="card">
          <div class="card-title">告警等级分布</div>
          <div ref="alarmLevelChart" class="h-300px"></div>
        </div>
      </div>
      <div class=""></div>
    </div>
  </div>
</template>

<script setup>
import { ref, getCurrentInstance, reactive, onMounted, nextTick } from "vue";

import Header from "@/components/Header.vue";
import { useUserStore } from "@/stores/userStore";
const userStore = useUserStore();
import useVueRouter from "@/hooks/useRouter";
const { goBack, jumpPage } = useVueRouter();

import useChart from "@/utils/useChart";

const {
  proxy: { $api },
} = getCurrentInstance();

const dateList = ref([
  {
    label: "今天",
    value: "1",
  },
  {
    label: "近一周",
    value: "2",
  },
  {
    label: "近一个月",
    value: "3",
  },
]);
const currentDate = ref("1");
const dateSelectValue = ref("");

const dateChange = (val) => {
  currentDate.value = val;
};

const allIcon = new URL("@/assets/images/icon1.png", import.meta.url).href;
const finishIcon = new URL("@/assets/images/icon2.png", import.meta.url).href;
const waitIcon = new URL("@/assets/images/icon3.png", import.meta.url).href;
const processIcon = new URL("@/assets/images/icon4.png", import.meta.url).href;
const overtimeIcon = new URL("@/assets/images/icon5.png", import.meta.url).href;
const orderList = ref([
  {
    icon: allIcon,
    name: "累计工单",
    value: 310,
  },
  {
    icon: finishIcon,
    name: "已处理工单",
    value: 270,
  },
  {
    icon: waitIcon,
    name: "待处理",
    value: 40,
  },
  {
    icon: processIcon,
    name: "处理中",
    value: 4,
  },
  {
    icon: overtimeIcon,
    name: "超时工单",
    value: 40,
  },
]);
const reportList = ref([
  {
    icon: allIcon,
    name: "累计历史报告任务",
    value: 314,
  },
  {
    icon: finishIcon,
    name: "已处理任务报告",
    value: 40,
  },
  {
    icon: processIcon,
    name: "处理中任务报告",
    value: 270,
  },
  {
    icon: waitIcon,
    name: "待处理任务报告",
    value: 4,
  },
]);
const alarmList = ref([
  {
    icon: allIcon,
    name: "累计历史告警",
    value: 88,
  },
  {
    icon: overtimeIcon,
    name: "高风险告警",
    value: 12,
  },
  {
    icon: processIcon,
    name: "中风险告警",
    value: 23,
  },
  {
    icon: finishIcon,
    name: "低风险告警",
    value: 53,
  },
]);

const taskChart = ref(null);
const { setOption: setTaskOption } = useChart(taskChart, true, false);

const orderStatusChart = ref(null);
const { setOption: setOrderStatusOption } = useChart(
  orderStatusChart,
  true,
  false
);

const reportStatusChart = ref(null);
const { setOption: setReportStatusOption } = useChart(
  reportStatusChart,
  true,
  false
);

const alarmLevelChart = ref(null);
const { setOption: setAlarmLevelOption } = useChart(
  alarmLevelChart,
  true,
  false
);

onMounted(() => {
  initTaskChart();
  initOrderStatusChart();
  initReportStatusChart();
  initAlarmLevelChart();
  // window.addEventListener("resize", () => {
  //   taskChart.value?.resize();
  //   orderStatusChart.value?.resize();
  //   reportStatusChart.value?.resize();
  //   alarmLevelChart.value?.resize();
  // });
});
const initTaskChart = () => {
  const option = {
    tooltip: {
      trigger: "axis",
      axisPointer: {
        // Use axis to trigger tooltip
        type: "shadow", // 'shadow' as default; can also be 'line' or 'shadow'
      },
    },
    legend: {},
    grid: {
      left: "3%",
      right: "4%",
      bottom: "3%",
      containLabel: true,
    },
    xAxis: {
      type: "value",
    },
    yAxis: {
      type: "category",
      data: ["巡检", "配置", "变更", "发布", "事件"],
    },
    series: [
      {
        name: "执行中",
        type: "bar",
        stack: "total",
        label: {
          show: true,
        },
        emphasis: {
          focus: "series",
        },
        itemStyle: {
          color: "#5299fb",
        },
        data: [23, 31, 67, 24, 56],
      },
      {
        name: "已完成",
        type: "bar",
        stack: "total",
        label: {
          show: true,
        },
        emphasis: {
          focus: "series",
        },
        itemStyle: {
          color: "#31de7a",
        },
        data: [17, 69, 45, 46, 74],
      },
    ],
  };
  setTaskOption(option);
};
const initOrderStatusChart = () => {
  const option = {
    tooltip: {
      trigger: "item",
    },
    series: [
      {
        name: "状态",
        type: "pie",
        radius: ["40%", "70%"],
        avoidLabelOverlap: false,
        color: ["#ff9900", "#5299fb", "#31de7a"],
        label: {
          show: true,
          position: "outside",
          formatter: "{a|{b},{c}\n{d}%}",
          rich: {
            a: {
              align: "left",
              lineHeight: 20,
            },
          },
        },
        // labelLine: {
        //   normal: {
        //     length: 15,
        //     length2: 30,
        //     lineStyle: {
        //       width: 1,
        //     },
        //   },
        // },
        data: [
          { value: 40, name: "待处理" },
          { value: 23, name: "处理中" },
          { value: 270, name: "已处理" },
        ],
      },
    ],
  };
  setOrderStatusOption(option);
};
const initReportStatusChart = () => {
  const option = {
    title: [
      {
        text: "报告任务",
        x: "50%",
        y: "43%",
        textAlign: "center",
        textStyle: {
          fontSize: "14",
          fontWeight: "normal",
          color: "#7F8D9D",
          textAlign: "center",
        },
      },
      {
        text: "310条",
        left: "50%",
        top: "52%",
        textAlign: "center",
        textStyle: {
          fontSize: "18",
          color: "#5c5a68",
          textAlign: "center",
        },
      },
    ],
    tooltip: {
      trigger: "item",
    },
    legend: {
      top: "0",
      left: "60%",
    },
    series: [
      {
        name: "状态",
        type: "pie",
        radius: ["40%", "51%"],
        avoidLabelOverlap: false,
        padAngle: 5,
        itemStyle: {
          borderRadius: 10,
        },
        color: ["#5299fb", "#31de7a"],
        label: {
          show: true,
          position: "outside",
          formatter: "{a|{b},{c}}",
          rich: {
            a: {
              align: "left",
              lineHeight: 20,
            },
          },
        },
        itemStyle: {
          borderRadius: 100,
          shadowColor: "#e8effa",
          shadowBlur: 0,
          shadowOffsetY: 0,
          shadowOffsetX: 0,
          borderColor: "#e8effa",
          borderWidth: 4,
        },
        data: [
          { value: 270, name: "处理中" },
          { value: 40, name: "已处理" },
        ],
      },
    ],
  };
  setReportStatusOption(option);
};
const initAlarmLevelChart = () => {
  const option = {
    tooltip: {
      trigger: "item",
    },
    series: [
      {
        name: "等级",
        type: "pie",
        // radius: ["40%", "70%"],
        avoidLabelOverlap: false,
        color: ["#f05a28", "#ff9900", "#5299fb"],
        label: {
          show: true,
          position: "outside",
          formatter: "{a|{b},{c}\n{d}%}",
          rich: {
            a: {
              align: "left",
              lineHeight: 20,
            },
          },
        },
        data: [
          { value: 12, name: "高风险" },
          { value: 23, name: "中风险" },
          { value: 53, name: "低风险" },
        ],
      },
    ],
  };
  setAlarmLevelOption(option);
};
</script>

<style scoped>
.el-button,
:deep(.el-input__wrapper) {
  background-color: transparent;
}
:deep(.el-date-editor.el-input),
:deep(.el-date-editor.el-input__wrapper) {
  width: 260px;
}
.active-btn {
  border-color: #409eff !important;
  color: #409eff !important;
  z-index: 1;
}
.card {
  margin-bottom: 20px;
  padding: 10px;
  box-sizing: border-box;
  background-color: #fbfbfb;
}
.card-title {
  position: relative;
  margin-bottom: 10px;
  padding-left: 15px;
  font-size: 16px;
  font-weight: bold;
}
.card-title::before {
  content: "";
  position: absolute;
  left: 0;
  top: 0;
  width: 4px;
  height: 100%;
  background-color: #409eff;
}
.card-list li {
  display: flex;
  align-items: center;
  min-width: 180px;
  max-width: 200px;
  margin-bottom: 20px;
  margin-right: 10px;
  padding: 10px;
  border-radius: 8px;
  background-image: url("../../assets/images/card-bg.svg");
  background-size: cover;
  color: #3d5063;
}
</style>

 浙公网安备 33010602011771号