

vue3 移动端使用 Vue-ECharts
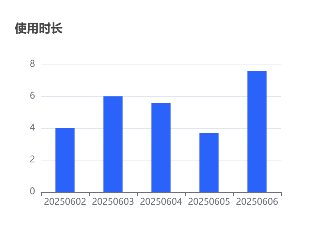
1. 效果:
2. 安装:
npm add echarts vue-echarts
3. 示例:
<template>
  <div ref="chartRef" class="w-[400px] h-[300px]">
    <v-chart
      :option="chartOptions"
      :autoresize="true"
      class="w-full h-full"
    />
  </div>
</template>
<script setup>
import { use } from "echarts/core";
import { CanvasRenderer } from "echarts/renderers";
import { BarChart } from "echarts/charts";
import {
  GridComponent,
  TooltipComponent,
  TitleComponent,
} from "echarts/components";
import VChart from "vue-echarts";
use([
  CanvasRenderer,
  BarChart,
  GridComponent,
  TooltipComponent,
  TitleComponent,
]);
import { ref } from "vue";
const chartRef = ref(null);
const chartOptions = ref({
  title: {
    text: "使用时长",
    left: "left",
    textStyle: {
      fontSize: 16,
    },
  },
  tooltip: {
    trigger: "axis",
    confine: true, // 移动端提示框防溢出
  },
  xAxis: {
    type: "category",
    data: ["20250602", "20250603", "20250604", "20250605", "20250606"],
    axisLabel: {
      interval: 0, // 强制显示所有标签
    },
  },
  yAxis: {
    type: "value",
    axisLabel: {
      formatter: "{value}",
    },
  },
  series: [
    {
      name: "小时",
      type: "bar",
      data: [4, 6, 5.6, 3.7, 7.6],
      itemStyle: {
        color: "#2560fc",
        // borderRadius: [4, 4, 0, 0], // 柱头圆角
      },
      barWidth: "40%", // 柱子宽度
    },
  ],
});
</script>
更多配置项参考官方文档
4. 链接:
vue-echarts GitHub地址
vue-echarts官网地址
echarts图表配置项文档
echarts图表案例

 浙公网安备 33010602011771号