Webdynpro Debug
If any errors occur in our Web Dynpro components, we can use the ABAP Debugger to execute our WD component, by line or by section.
To work with the debugger, we can create Breakpoints at the point where the program should pause (Fig. 3.28).

Figure 3.28: Setting a Breakpoint
We run the application and, in the moment when the program flow reached the defined breakpoint, the ABAP Debugger is open (Fig. 3.29).

Figure 3.29: ABAP Debugger
As we can see in the Process Information, the main component of the ABAP Debugger, we debug an HTTP application. The "Exclusive" represents the fact that the application we debug occupies a work process of the application server.
By using the Buttons from the Control Area, we can control the program flow. For example, we can choose to execute the program line by line ![]() — Single step, or to execute the program up to the next Breakpoint
— Single step, or to execute the program up to the next Breakpoint ![]() — Continue.
— Continue.
We can use the ABAP Debugger tools to have information about the variable (Fig. 3.30).

Figure 3.30: Tool Component of the ABAP Debugger
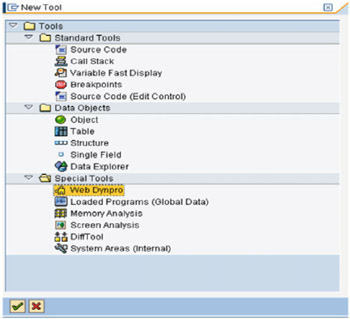
By using the New Tool button ![]() ,
we can open a selection window that offers the possibility to access
additional functionalities. In the Special Tools section, we can find
the created tool, to be used for a better debugging of the Web Dynpro components (Fig. 3.31).
,
we can open a selection window that offers the possibility to access
additional functionalities. In the Special Tools section, we can find
the created tool, to be used for a better debugging of the Web Dynpro components (Fig. 3.31).

Figure 3.31: ABAP Debugger — New tool selection window
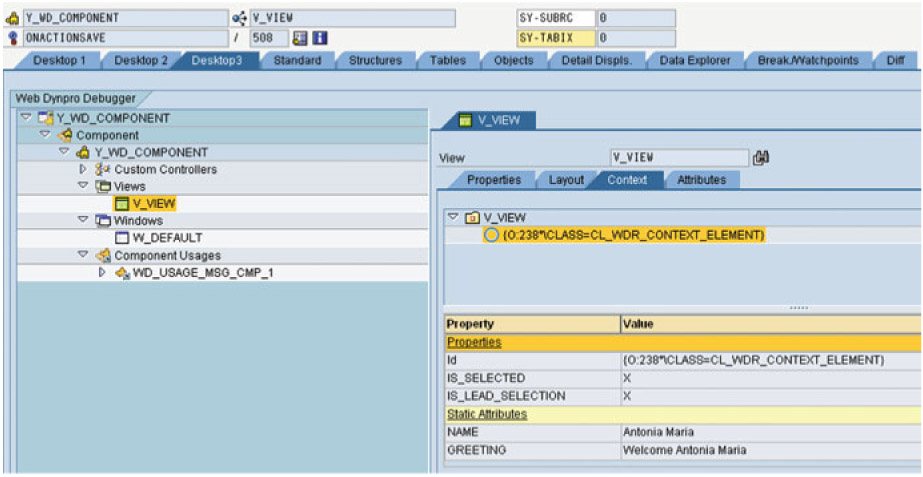
As we can see in Fig. 3.32, we are offered the possibility to have access to all the individual elements of the Web Dynpro component; we can see the view attributes, the view layout, the UI elements and data binding, the context structure and its attributes, etc.

Figure 3.32: The ABAP debugger — web Dynpro ABAP tool
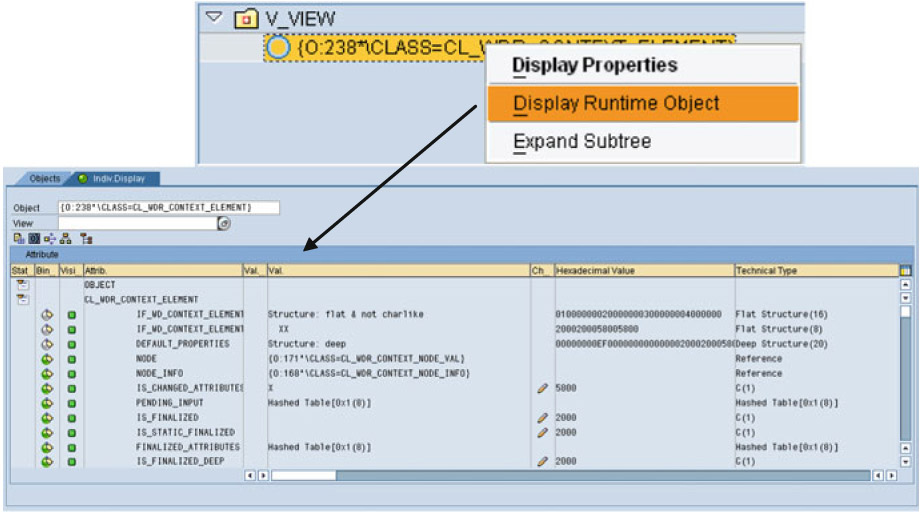
We are able to see not only the context structure, but also to display the runtime object, by choosing from the contextual menu Display Runtime Object (Fig. 3.33).
These are only some of the ABAP Debugger capabilities that can be used along with other performance tools (for example, the transactions WD_TRACE_TOOLS, S_MEMORY_INSPECTOR), to help us to develop Web Dynpro applications.


 浙公网安备 33010602011771号