

python 绘制线图
目的: 记录利用python绘制图片的心得
绘制技巧包括:
1.线图
2.点线图
3.线条颜色
4.修改X轴坐标文字
5.添加Y轴的数值
6.绘图建议配合pandas使用,便于读取数据
实例数据
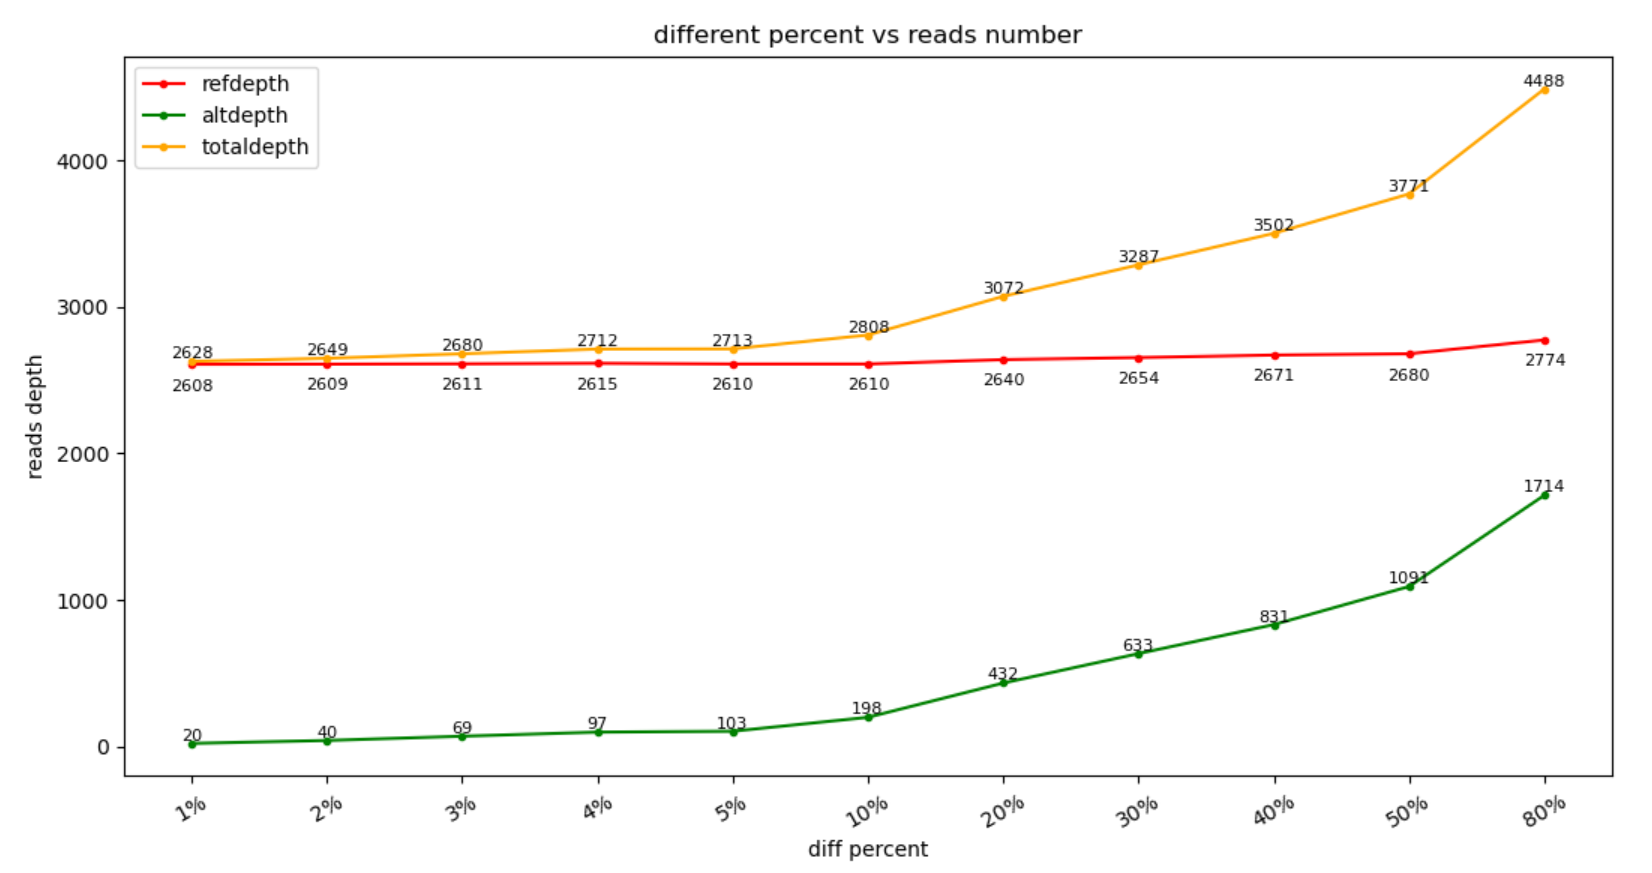
    refdepth	altdepth	totaldepth
percent1	2608	20	2628
percent2	2609	40	2649
percent3	2611	69	2680
percent4	2615	97	2712
percent5	2610	103	2713
percent10	2610	198	2808
percent20	2640	432	3072
percent30	2654	633	3287
percent40	2671	831	3502
percent50	2680	1091	3771
percent80	2774	1714	4488
绘制代码
 1 import pandas as pd
 2 import numpy as np
 3 import matplotlib.pyplot as plt
 4 import sys
 5
 6 infile = sys.argv[1]
 7
 8 df = pd.read_table(infile, index_col=0)
 9 x_ticks =['1%', '2%', '3%', '4%', '5%', '10%', '20%', '30%', '40%', '50%', '80%']  # x轴预备展示的文字
11
12 refdepth = df['refdepth'].values
13 altdepth = df['altdepth'].values
14 totaldepth = df['totaldepth'].values
15
16 plt.title('different percent vs reads number')
17 plt.plot(refdepth ,'m.-', color='red', label='refdepth')  # 如果没有指定X轴,默认使用从0开始的连续数字
18 plt.plot(altdepth, 'm.-', color='green', label='altdepth')
19 plt.plot(totaldepth, 'm.-', color='orange', label='totaldepth') # m.- 绘制点线图
20 plt.xticks(range(0,11), x_ticks, rotation=30)  # 用x_ticks的内容填充x轴数值, rotation为旋转角度.
21 plt.xlabel('diff percent')
22 plt.ylabel('reads depth')
23
24 for x,y in zip(range(0,11), altdepth):   # 在每个绘制位点添加其数值
25     plt.text(x,y,y,ha='center',va='bottom',fontsize=8)
26
28 for x,y in zip(range(0,11), refdepth):
29     plt.text(x,y-200,y,ha='center',va='bottom',fontsize=8)
30
31 for x,y in zip(range(0,11), totaldepth):
32     plt.text(x,y,y,ha='center',va='bottom',fontsize=8)
33
34
35 plt.legend()
36 plt.show()
结果展示:


 浙公网安备 33010602011771号