点云可视化脚本 Python
import numpy as np


def get_data(count):
    filename = f"./data/pcds/{count}.npz"
    data1 = np.load(filename)
    coor1 = data1["coordinates"]
    strength1 = data1["strength"]
    return coor1, strength1

def pre_process(coor1, s1, sample=0):
    value0 = s1[sample] # diff取最大正值 ---> 有缺陷
    coor1_0=coor1[sample]
    # 归一化
    val_range = value0.max() - value0.min()
    scaled_ = (value0-value0.min()) /val_range

    color_value1_0_ = (scaled_ * 255)
    ## 转换到[0,255]


    sample0 = (coor1_0.transpose(1,0), color_value1_0_)
    print(sample0[0].shape, sample0[1].shape)
    return sample0

# f"./data/pcds/attacked-sample={count//2}_GM{count%2+1}.npz"
count = 1
# count = 1
sample0 = pre_process(*get_data(count),sample=0)

print()
with open(f"./data/pcds/{count}.pcd","w") as f:
    f.write('# .PCD v0.7 - Point Cloud Data file format\nVERSION 0.7\nFIELDS x y z rgb\nSIZE 4 4 4 4\nTYPE F F F U\nCOUNT 1 1 1 1')
    f.write(f'\nWIDTH {sample0[0].shape[0]}')
    f.write('\nHEIGHT 1\nVIEWPOINT 0 0 0 1 0 0 0')
    f.write(f'\nPOINTS {sample0[0].shape[0]}')
    f.write('\nDATA ascii')

    for j in range(sample0[0].shape[0]):
        color_val = int(sample0[1][j])
        # color_val: 0~255
        if color_val> 255*0.9:
            R=255
            G=B=5
        else:
            R=color_val
            G=B=color_val
        value = (int(R) << 16 | int(G) << 8 | int(B))
        f.write(f'\n{sample0[0][j][0]} {sample0[0][j][1]} {sample0[0][j][2]} {value}')


with open(f"./data/pcds/{count}-color.pcd","w") as f:
    f.write('# .PCD v0.7 - Point Cloud Data file format\nVERSION 0.7\nFIELDS x y z rgb\nSIZE 4 4 4 4\nTYPE F F F U\nCOUNT 1 1 1 1')
    f.write(f'\nWIDTH {sample0[0].shape[0]}')
    f.write('\nHEIGHT 1\nVIEWPOINT 0 0 0 1 0 0 0')
    f.write(f'\nPOINTS {sample0[0].shape[0]}')
    f.write('\nDATA ascii')

    for j in range(1024):
        color_val = int(sample0[1][j])
        R=color_val
        G=B=color_val
        value = (int(R) << 16 | int(G) << 8 | int(B))
        f.write(f'\n{sample0[0][j][0]} {sample0[0][j][1]} {sample0[0][j][2]} {value}')

    for j in range(1024,sample0[0].shape[0]): # 手动设置不同颜色
        print("red:",j)
        color_val = int(sample0[1][j])
        R=255
        G=B=1
        value = (int(R) << 16 | int(G) << 8 | int(B))
        f.write(f'\n{sample0[0][j][0]} {sample0[0][j][1]} {sample0[0][j][2]} {value}')
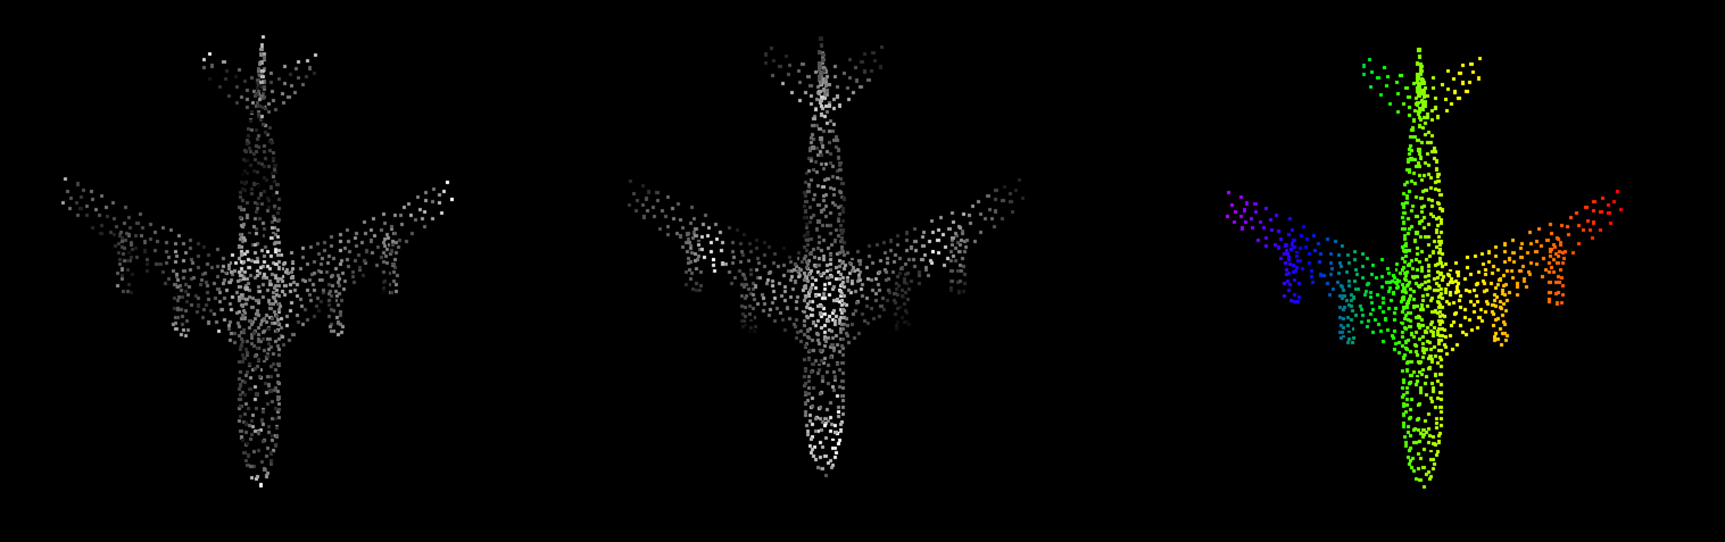
VSCode下载pcd文件的可视化插件(pcd viewer)点击右下角的RGBA即可渲染颜色。

 浙公网安备 33010602011771号