
Python matplotib 画图
使用Python 程序来生成可视化图像,具有明确的表达性。Matplotlib 里的常用类的包含关系为 Figure -> Axes -> (Line2D, Text, etc.)一个Figure对象可以包含多个子图(Axes),在matplotlib中用Axes对象表示一个绘图区域,可以理解为子图。
demo1:曲线图和直线图


#!/usr/bin/env python
# -*- coding: utf-8 -*-

import numpy as np
import matplotlib.pyplot as plt

t = np.arange(0.0, 1.01, 0.01)
s = np.sin(2*2*np.pi*t)

plt.fill(t, s*np.exp(-5*t), 'r')
plt.grid(True)

#保存为PDF格式,也可保存为PNG等图形格式
plt.savefig('test.png')
plt.show()

import numpy as np
import matplotlib.pyplot as plt
x=np.linspace(0,10,1000)
y=np.sin(x)
z=np.cos(x**2)

plt.figure(figsize=(8,4))


plt.plot(x,y,label='$sin(x)$',color='red',linewidth=2)

plt.plot(x,z,'g--',label='$cos(x^2)$',lw=3)

plt.xlabel('Time(s)')
plt.ylabel('volt')
plt.title('First python firgure')
plt.ylim(-1.2,1.2)
plt.legend()
plt.savefig("test.png")
plt.show()

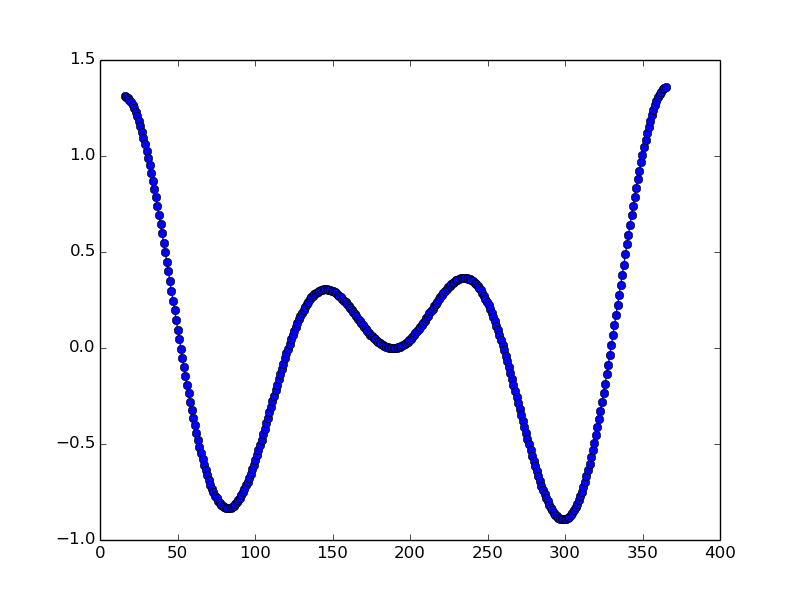
import numpy as np
import matplotlib.pyplot as plt


# A class that will downsample the data and recompute when zoomed.
class DataDisplayDownsampler(object):
    def __init__(self, xdata, ydata):
        self.origYData = ydata
        self.origXData = xdata
        self.ratio = 5
        self.delta = xdata[-1] - xdata[0]

    def downsample(self, xstart, xend):
        # Very simple downsampling that takes the points within the range
        # and picks every Nth point
        mask = (self.origXData > xstart) & (self.origXData < xend)
        xdata = self.origXData[mask]
        xdata = xdata[::self.ratio]

        ydata = self.origYData[mask]
        ydata = ydata[::self.ratio]

        return xdata, ydata

    def update(self, ax):
        # Update the line
        lims = ax.viewLim
        if np.abs(lims.width - self.delta) > 1e-8:
            self.delta = lims.width
            xstart, xend = lims.intervalx
            self.line.set_data(*self.downsample(xstart, xend))
            ax.figure.canvas.draw_idle()

# Create a signal
xdata = np.linspace(16, 365, 365-16)
ydata = np.sin(2*np.pi*xdata/153) + np.cos(2*np.pi*xdata/127)

d = DataDisplayDownsampler(xdata, ydata)

fig, ax = plt.subplots()

# Hook up the line
d.line, = ax.plot(xdata, ydata, 'o-')
ax.set_autoscale_on(False)  # Otherwise, infinite loop

# Connect for changing the view limits
ax.callbacks.connect('xlim_changed', d.update)
plt.savefig("test.png")
plt.show()
含有鼠标线
import numpy as np
import matplotlib.pyplot as plt
from matplotlib.widgets import Cursor

t = np.arange(0.0, 2.0, 0.01)
s1 = np.sin(2 * np.pi * t)
plt.plot(t, s1)

cursor = Cursor(plt.gca(), horizOn=True, color='r', lw=1)
plt.savefig("test.png")
plt.show()

import numpy as np
import matplotlib.pyplot as plt
from matplotlib.widgets import MultiCursor

t = np.arange(0.0, 2.0, 0.01)
s1 = np.sin(2*np.pi*t)
s2 = np.sin(4*np.pi*t)
fig = plt.figure()
ax1 = fig.add_subplot(211)
ax1.plot(t, s1)


ax2 = fig.add_subplot(212, sharex=ax1)
ax2.plot(t, s2)

multi = MultiCursor(fig.canvas, (ax1, ax2), color='r', lw=1)
plt.show()

#!/usr/bin/env python
# -*- coding: utf-8 -*-
import numpy as np
import matplotlib.pyplot as plt
plt.figure(1) # 创建图表1
plt.figure(2) # 创建图表2
ax1 = plt.subplot(211) # 在图表2中创建子图1
ax2 = plt.subplot(212) # 在图表2中创建子图2
x = np.linspace(0, 3, 100)
for i in xrange(5):
    plt.figure(1)  #❶ # 选择图表1
    plt.plot(x, np.exp(i*x/3))
    plt.sca(ax1)   #❷ # 选择图表2的子图1
    plt.plot(x, np.sin(i*x))
    plt.sca(ax2)  # 选择图表2的子图2
    plt.plot(x, np.cos(i*x))
plt.savefig("test.png")
plt.show()

#-*- coding: utf-8 -*-
import numpy as np
import matplotlib.pyplot as plt
plt.figure(1) # 创建图表1
plt.figure(2) # 创建图表2
ax1 = plt.subplot(211) # 在图表2中创建子图1
ax2 = plt.subplot(212) # 在图表2中创建子图2
x = np.linspace(0, 3, 100)
for i in xrange(5):
    plt.figure(1)  #❶ # 选择图表1
    plt.plot(x, np.exp(i*x/3))
    plt.sca(ax1)   #❷ # 选择图表2的子图1
    plt.plot(x, np.sin(i*x))
    plt.sca(ax2)  # 选择图表2的子图2
    plt.plot(x, np.cos(i*x))
plt.show()
含有公式:
import numpy as np
import matplotlib.pyplot as plt
t = np.arange(0.0, 2.0, 0.01)
s = np.sin(2*np.pi*t)

plt.plot(t,s)
plt.title(r'$\alpha_i > \beta_i$', fontsize=20)
plt.text(1, -0.6, r'$\sum_{i=0}^\infty x_i$', fontsize=20)
plt.text(0.6, 0.6, r'$\mathcal{A}\mathrm{sin}(2 \omega t)$',
         fontsize=20)
plt.xlabel('time (s)')
plt.ylabel('volts (mV)')
plt.show()

#################################
#-*- coding: utf-8 -*-
#     File name   :5.py
#     Author      :kangkangliang
#     File desc   :
#     Mail        :liangkangkang@yahoo.com
#     Create time :2017-06-11
#################################
#!/usr/bin/env python
import os
import numpy as np
import matplotlib.pyplot as plt
import sys
x = [1,2,3,4,5,6,7,8,9,10]
y = [1,2,3,4,5,6,7,8,9,10]
plt.plot(x,y)
plt.text(2, 8, r"$ \mu \alpha \tau \pi \lambda \omega \tau \lambda \iota \beta $",fontsize=20);
plt.text(2, 6, r"$ \lim_{x \rightarrow 0} \frac{1}{x} $",fontsize=20);
plt.text(2, 4, r"$ a \ \leq \ b \ \leq \ c \ \Rightarrow \ a \ \leq \ c$",fontsize=20);
plt.text(2, 2, r"$ \sum_{i=1}^{\infty}\ x_i^2$",fontsize=20);
plt.text(4, 8, r"$ \sin(0) = \cos(\frac{\pi}{2})$",fontsize=20);
plt.text(4, 6, r"$ \sqrt[3]{x} = \sqrt{y}$",fontsize=20);
plt.text(4, 4, r"$ \neg (a \wedge b) \Leftrightarrow \neg a \vee \neg b$",fontsize=20);
plt.text(4, 2, r"$ \int_a^b f(x)dx$",fontsize=20);
plt.xlabel('time (s)')
plt.ylabel('volts (mV)')
plt.show()

import numpy as np
import pylab as pl
data = np.loadtxt('testdata.txt')
# plot the first column as x, and second column as y
pl.plot(data[:,0], data[:,1], 'ro')
pl.xlabel('x')
pl.ylabel('y')
pl.xlim(0.0, 10.)
pl.show()

import numpy as np
import matplotlib.pyplot as plt
x1 = [1, 2, 3, 4, 5]# Make x, y arrays for each graph
y1 = [1, 4, 9, 16, 25]
x2 = [1, 2, 4, 6, 8]
y2 = [2, 4, 8, 12, 16]
pltot1 = plt.plot(x1, y1, 'r')# use pylab to plot x and y : Give your plots names
pltot2 = plt.plot(x2, y2, 'go')
plt.title('Plot of y vs. x')# give plot a title
plt.xlabel('x axis')# make axis labels
plt.ylabel('y axis')
plt.xlim(0.0, 9.0)# set axis limits
plt.ylim(0.0, 30.)
# plt.legend([plot1, plot2], ('red line', 'green circles'), 'best', numpoints=1)# make legend
plt.legend(('red line','green circles'))
plt.show()# show the plot on the screen

import numpy as np
import pylab as plt
x1 = [1, 2, 3, 4, 5]# Make x, y arrays for each graph
y1 = [1, 4, 9, 16, 25]
x2 = [1, 2, 4, 6, 8]
y2 = [2, 4, 8, 12, 16]
plt.plot(x1, y1, 'r')# use pylab to plot x and y
plt.plot(x2, y2, 'g')
plt.title('Plot of y vs. x')# give plot a title
plt.xlabel('x axis')# make axis labels
plt.ylabel('y axis')
plt.xlim(0.0, 9.0)# set axis limits
plt.ylim(0.0, 30.)
plt.show()# show the plot on the screen

#################################
#-*- coding: utf-8 -*-
#     File name   :demo.py
#     Author      :kangkangliang
#     File desc   :
#     Mail        :liangkangkang@yahoo.com
#     Create time :2017-06-11
#################################
#!/usr/bin/env python
import os
import numpy as np
import matplotlib.pyplot as plt
import sys

x = np.arange(0.0, 10.0, 1.0)
y1 = x*2
y2 = x + 2
y3 = x*3
# color rgbyck
# b blue
# r green
# r red
# c cyan
# m magenta
# y yellow
# k black
# white
# 散点图
plt.plot(x,y1,'or')
# 折线图
plt.plot(x,y2)
# 虚线
plt.plot(x,y3,'--')
plt.show()

import matplotlib.pyplot as plt
X1 = range(0, 50)
Y1 = [num**2 for num in X1] # y = x^2
X2 = [0, 1]
Y2 = [0, 1]  # y = x
Fig = plt.figure(figsize=(8,4))                      # Create a `figure' instance
Ax = Fig.add_subplot(111)               # Create a `axes' instance in the figure
Ax.plot(X1, Y1, X2, Y2)                 # Create a Line2D instance in the axes
Fig.show()
Fig.savefig("test.png"

import numpy as np
import pylab as pl
x = [1, 2, 3, 4, 5]# Make an array of x values
y = [1, 4, 9, 16, 25]# Make an array of y values for each x value
pl.plot(x, y)# use pylab to plot x and y
pl.show()# show the plot on the screen

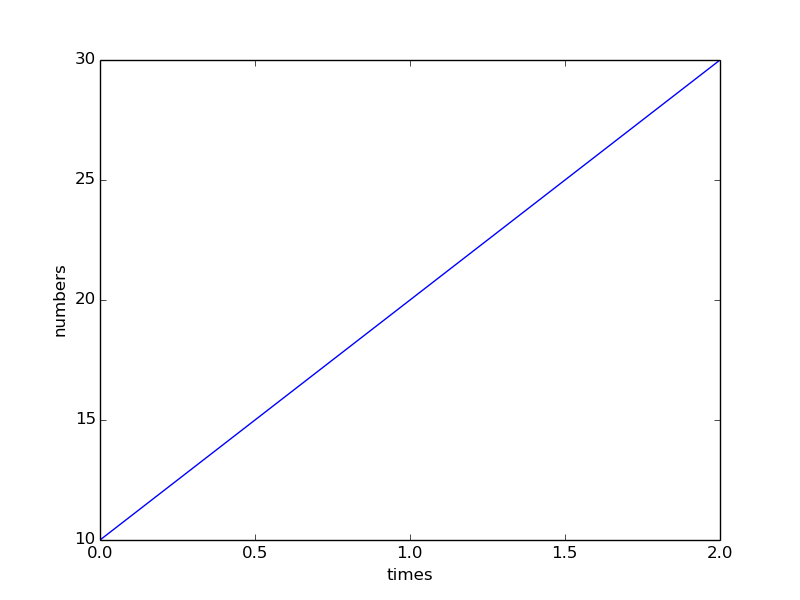
#!/usr/bin/env python
import matplotlib.pyplot as plt

plt.plot([10, 20, 30])
plt.xlabel('times')
plt.ylabel('numbers')
plt.savefig("test.png")
plt.show()
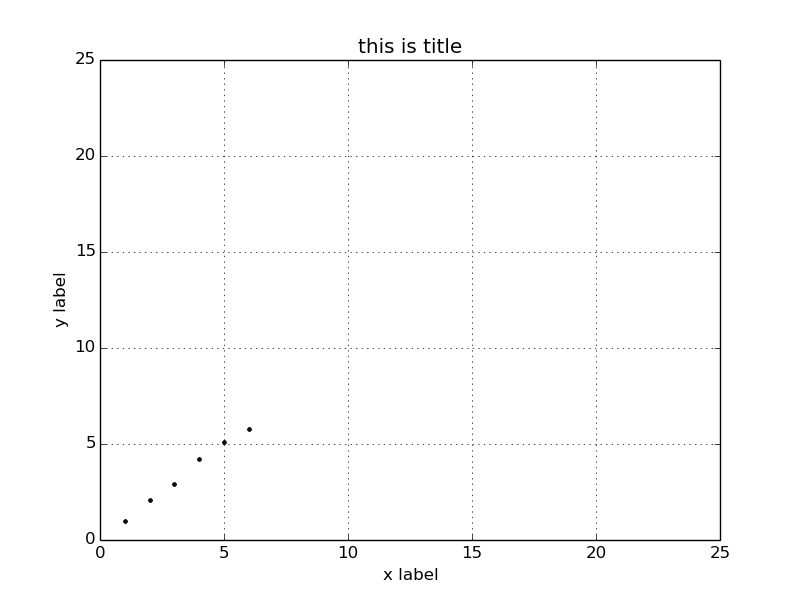
import matplotlib.pyplot as plt
from matplotlib.font_manager import FontProperties
font = FontProperties()

plt.figure()
plt.title('this is title')
plt.xlabel('x label')
plt.ylabel('y label')
plt.axis([0, 25, 0, 25])
plt.grid(True)
x = [[1],[2],[3],[4],[5],[6]]
y = [[1],[2.1],[2.9],[4.2],[5.1],[5.8]]
plt.plot(x, y, 'k.')
plt.savefig('test.png')
plt.show()
from math import pi
from numpy import cos, sin
from matplotlib import pyplot as plt

if __name__ == '__main__':
    '''''plot data margin'''
    angles_circle = [i*pi/180 for i in range(0,360)]                 #i先转换成double
    #angles_circle = [i/np.pi for i in np.arange(0,360)]             # <=>
    # angles_circle = [i/180*pi for i in np.arange(0,360)]    X
    x = cos(angles_circle)
    y = sin(angles_circle)
    plt.plot(x, y, 'r')

    plt.axis('equal')
    plt.axis('scaled')
    plt.savefig("test.png")
    plt.show()

import numpy as np
import matplotlib.pyplot as plt

N = 50
x = np.random.rand(N)
y = np.random.rand(N)
area = np.pi * (15 * np.random.rand(N))**2 # 0 to 15 point radiuses
color = 2 * np.pi * np.random.rand(N)
plt.scatter(x, y, s=area, c=color, alpha=0.5, cmap=plt.cm.hsv)
plt.savefig("test.png")
plt.show()

多个图:
import numpy as np
import matplotlib.pyplot as plt
t = np.arange(-1, 2, .01)
s = np.sin(2 * np.pi * t)

plt.plot(t,s)
# draw a thick red hline at y=0 that spans the xrange
l = plt.axhline(linewidth=4, color='r')
plt.axis([-1, 2, -1, 2])
plt.show()
plt.close()

# draw a default hline at y=1 that spans the xrange
plt.plot(t,s)
l = plt.axhline(y=1, color='b')
plt.axis([-1, 2, -1, 2])
plt.show()
plt.close()

# draw a thick blue vline at x=0 that spans the upper quadrant of the yrange
plt.plot(t,s)
l = plt.axvline(x=0, ymin=0, linewidth=4, color='b')
plt.axis([-1, 2, -1, 2])
plt.show()
plt.close()

# draw a default hline at y=.5 that spans the the middle half of the axes
plt.plot(t,s)
l = plt.axhline(y=.5, xmin=0.25, xmax=0.75)
plt.axis([-1, 2, -1, 2])
plt.show()
plt.close()

plt.plot(t,s)
p = plt.axhspan(0.25, 0.75, facecolor='0.5', alpha=0.5)
p = plt.axvspan(1.25, 1.55, facecolor='g', alpha=0.5)
plt.axis([-1, 2, -1, 2])
# plt.show()
# plt.savefig('test.png')
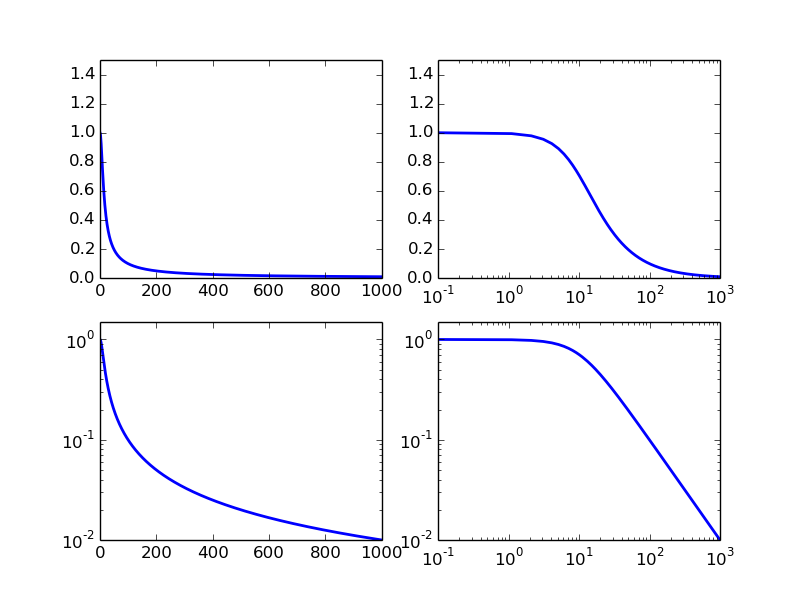
对数图:
import numpy as np
import matplotlib.pyplot as plt

w = np.linspace(0.1, 1000, 1000)
p = np.abs(1/(1+0.1j*w))
plt.subplot(221)
plt.plot(w, p, linewidth=2)
plt.ylim(0,1.5)

plt.subplot(222)
plt.semilogx(w, p, linewidth=2)
plt.ylim(0,1.5)

plt.subplot(223)
plt.semilogy(w, p, linewidth=2)
plt.ylim(0,1.5)

plt.subplot(224)
plt.loglog(w, p, linewidth=2)
plt.ylim(0,1.5)
plt.savefig("test.png")
plt.show()
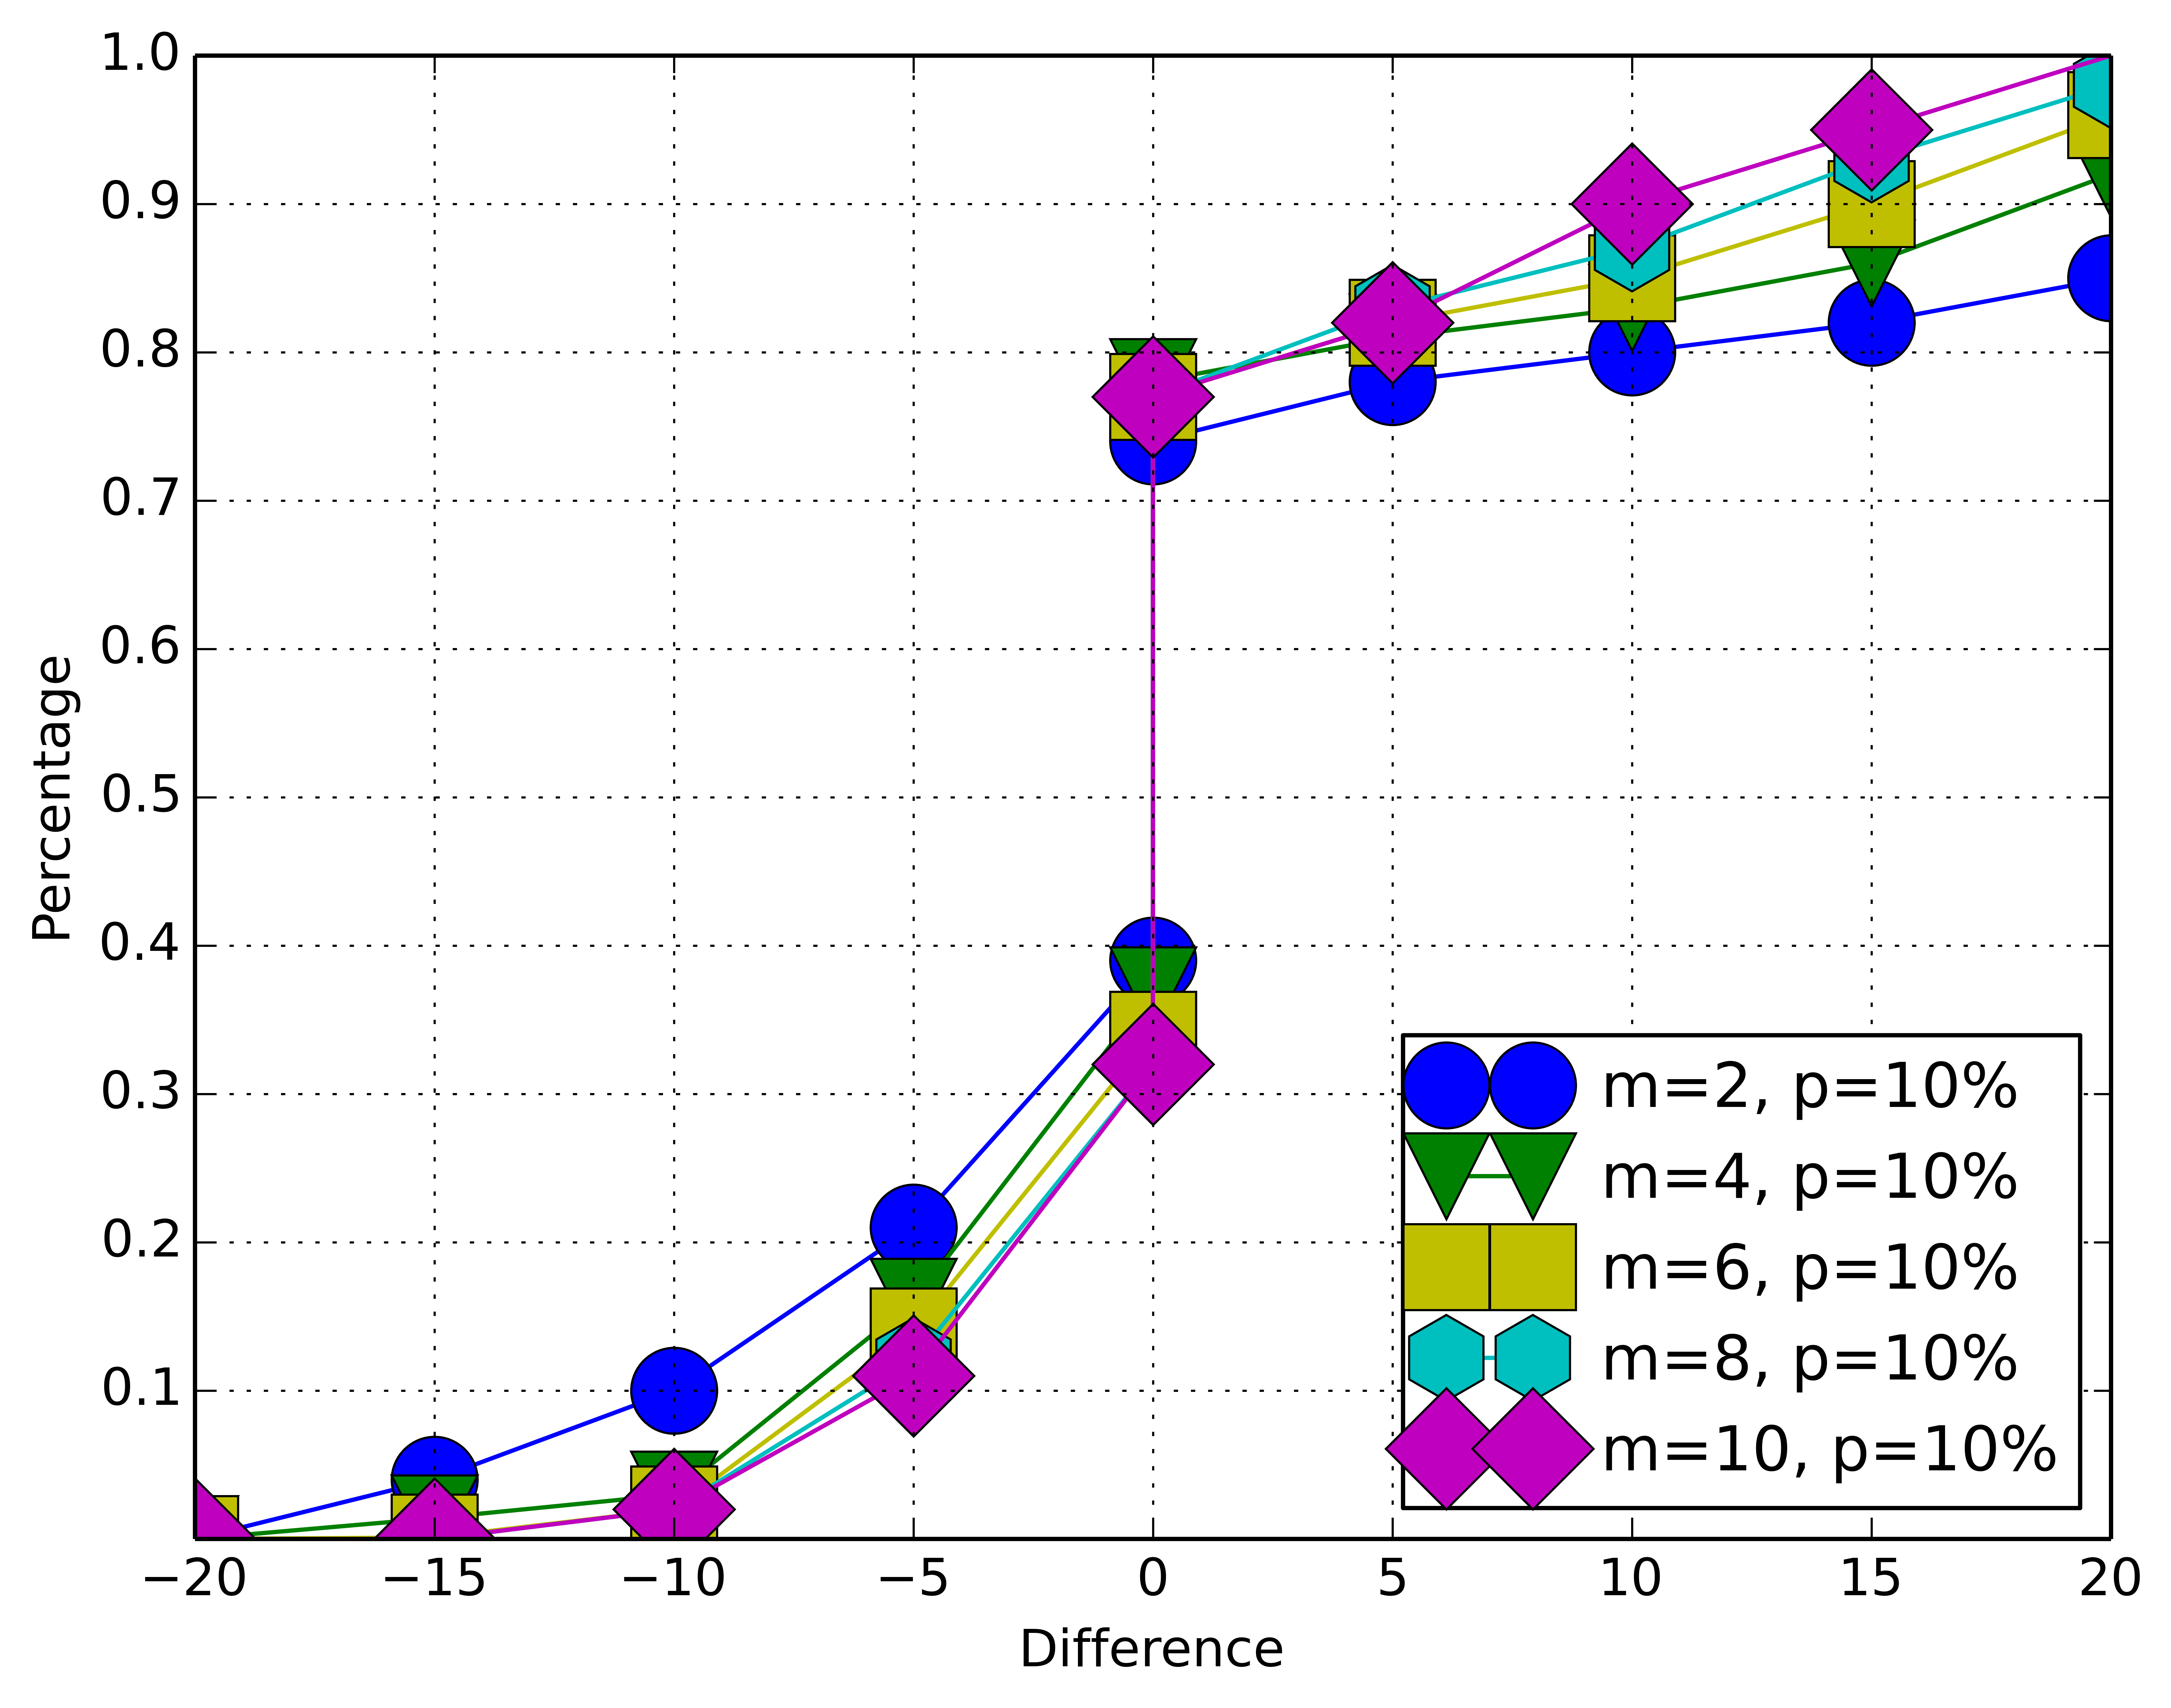
import matplotlib.pyplot as plt
import matplotlib.pylab as pylab
import scipy.io
import numpy as np
# params={
    # 'axes.labelsize': '35',
    # 'xtick.labelsize':'27',
    # 'ytick.labelsize':'27',
    # 'lines.linewidth':2 ,
    # 'legend.fontsize': '27',
    # 'figure.figsize'   : '12, 9'    # set figure size
# }
# pylab.rcParams.update(params)            #set figure parameter
line_styles=['ro-','b^-','gs-','ro--','b^--','gs--']  #set line style

#We give the coordinate date directly to give an example.
x1 = [-20,-15,-10,-5,0,0,5,10,15,20]
y1 = [0,0.04,0.1,0.21,0.39,0.74,0.78,0.80,0.82,0.85]
y2 = [0,0.014,0.03,0.16,0.37,0.78,0.81,0.83,0.86,0.92]
y3 = [0,0.001,0.02,0.14,0.34,0.77,0.82,0.85,0.90,0.96]
y4 = [0,0,0.02,0.12,0.32,0.77,0.83,0.87,0.93,0.98]
y5 = [0,0,0.02,0.11,0.32,0.77,0.82,0.90,0.95,1]


plt.plot(x1,y1,'bo-',label='m=2, p=10%',markersize=20) # in 'bo-', b is blue, o is O marker, - is solid line and so on
plt.plot(x1,y2,'gv-',label='m=4, p=10%',markersize=20)
plt.plot(x1,y3,'ys-',label='m=6, p=10%',markersize=20)
plt.plot(x1,y4,'ch-',label='m=8, p=10%',markersize=20)
plt.plot(x1,y5,'mD-',label='m=10, p=10%',markersize=20)


fig1 = plt.figure(1)
axes = plt.subplot(111)
#axes = plt.gca()
axes.set_yticks([0.1,0.2,0.3,0.4,0.5,0.6,0.7,0.8,0.9,1.0])
axes.grid(True)  # add grid

plt.legend(loc="lower right")  #set legend location
plt.ylabel('Percentage')   # set ystick label
plt.xlabel('Difference')  # set xstck label

plt.savefig('test.png',dpi = 1000,bbox_inches='tight')
plt.show()
demo2:饼图
#!/usr/bin/env python
# -*- coding: utf-8 -*-

from pylab import *

# make a square figure and axes
figure(1, figsize=(6,6))
ax = axes([0.1, 0.1, 0.8, 0.8])

labels = 'Frogs', 'Hogs', 'Dogs', 'Logs'
fracs = [15,30,45, 10]

explode=(0, 0.05, 0, 0)
pie(fracs, explode=explode, labels=labels, autopct='%1.1f%%', shadow=True)
title('Raining Hogs and Dogs', bbox={'facecolor':'0.8', 'pad':5})
savefig('pie.png')
show()

import matplotlib.pyplot as plt
for idx,color in enumerate('rgbyck'):
    plt.subplot(321+idx,axisbg=color)
plt.savefig("test.png")
plt.show()

demo3:柱状图
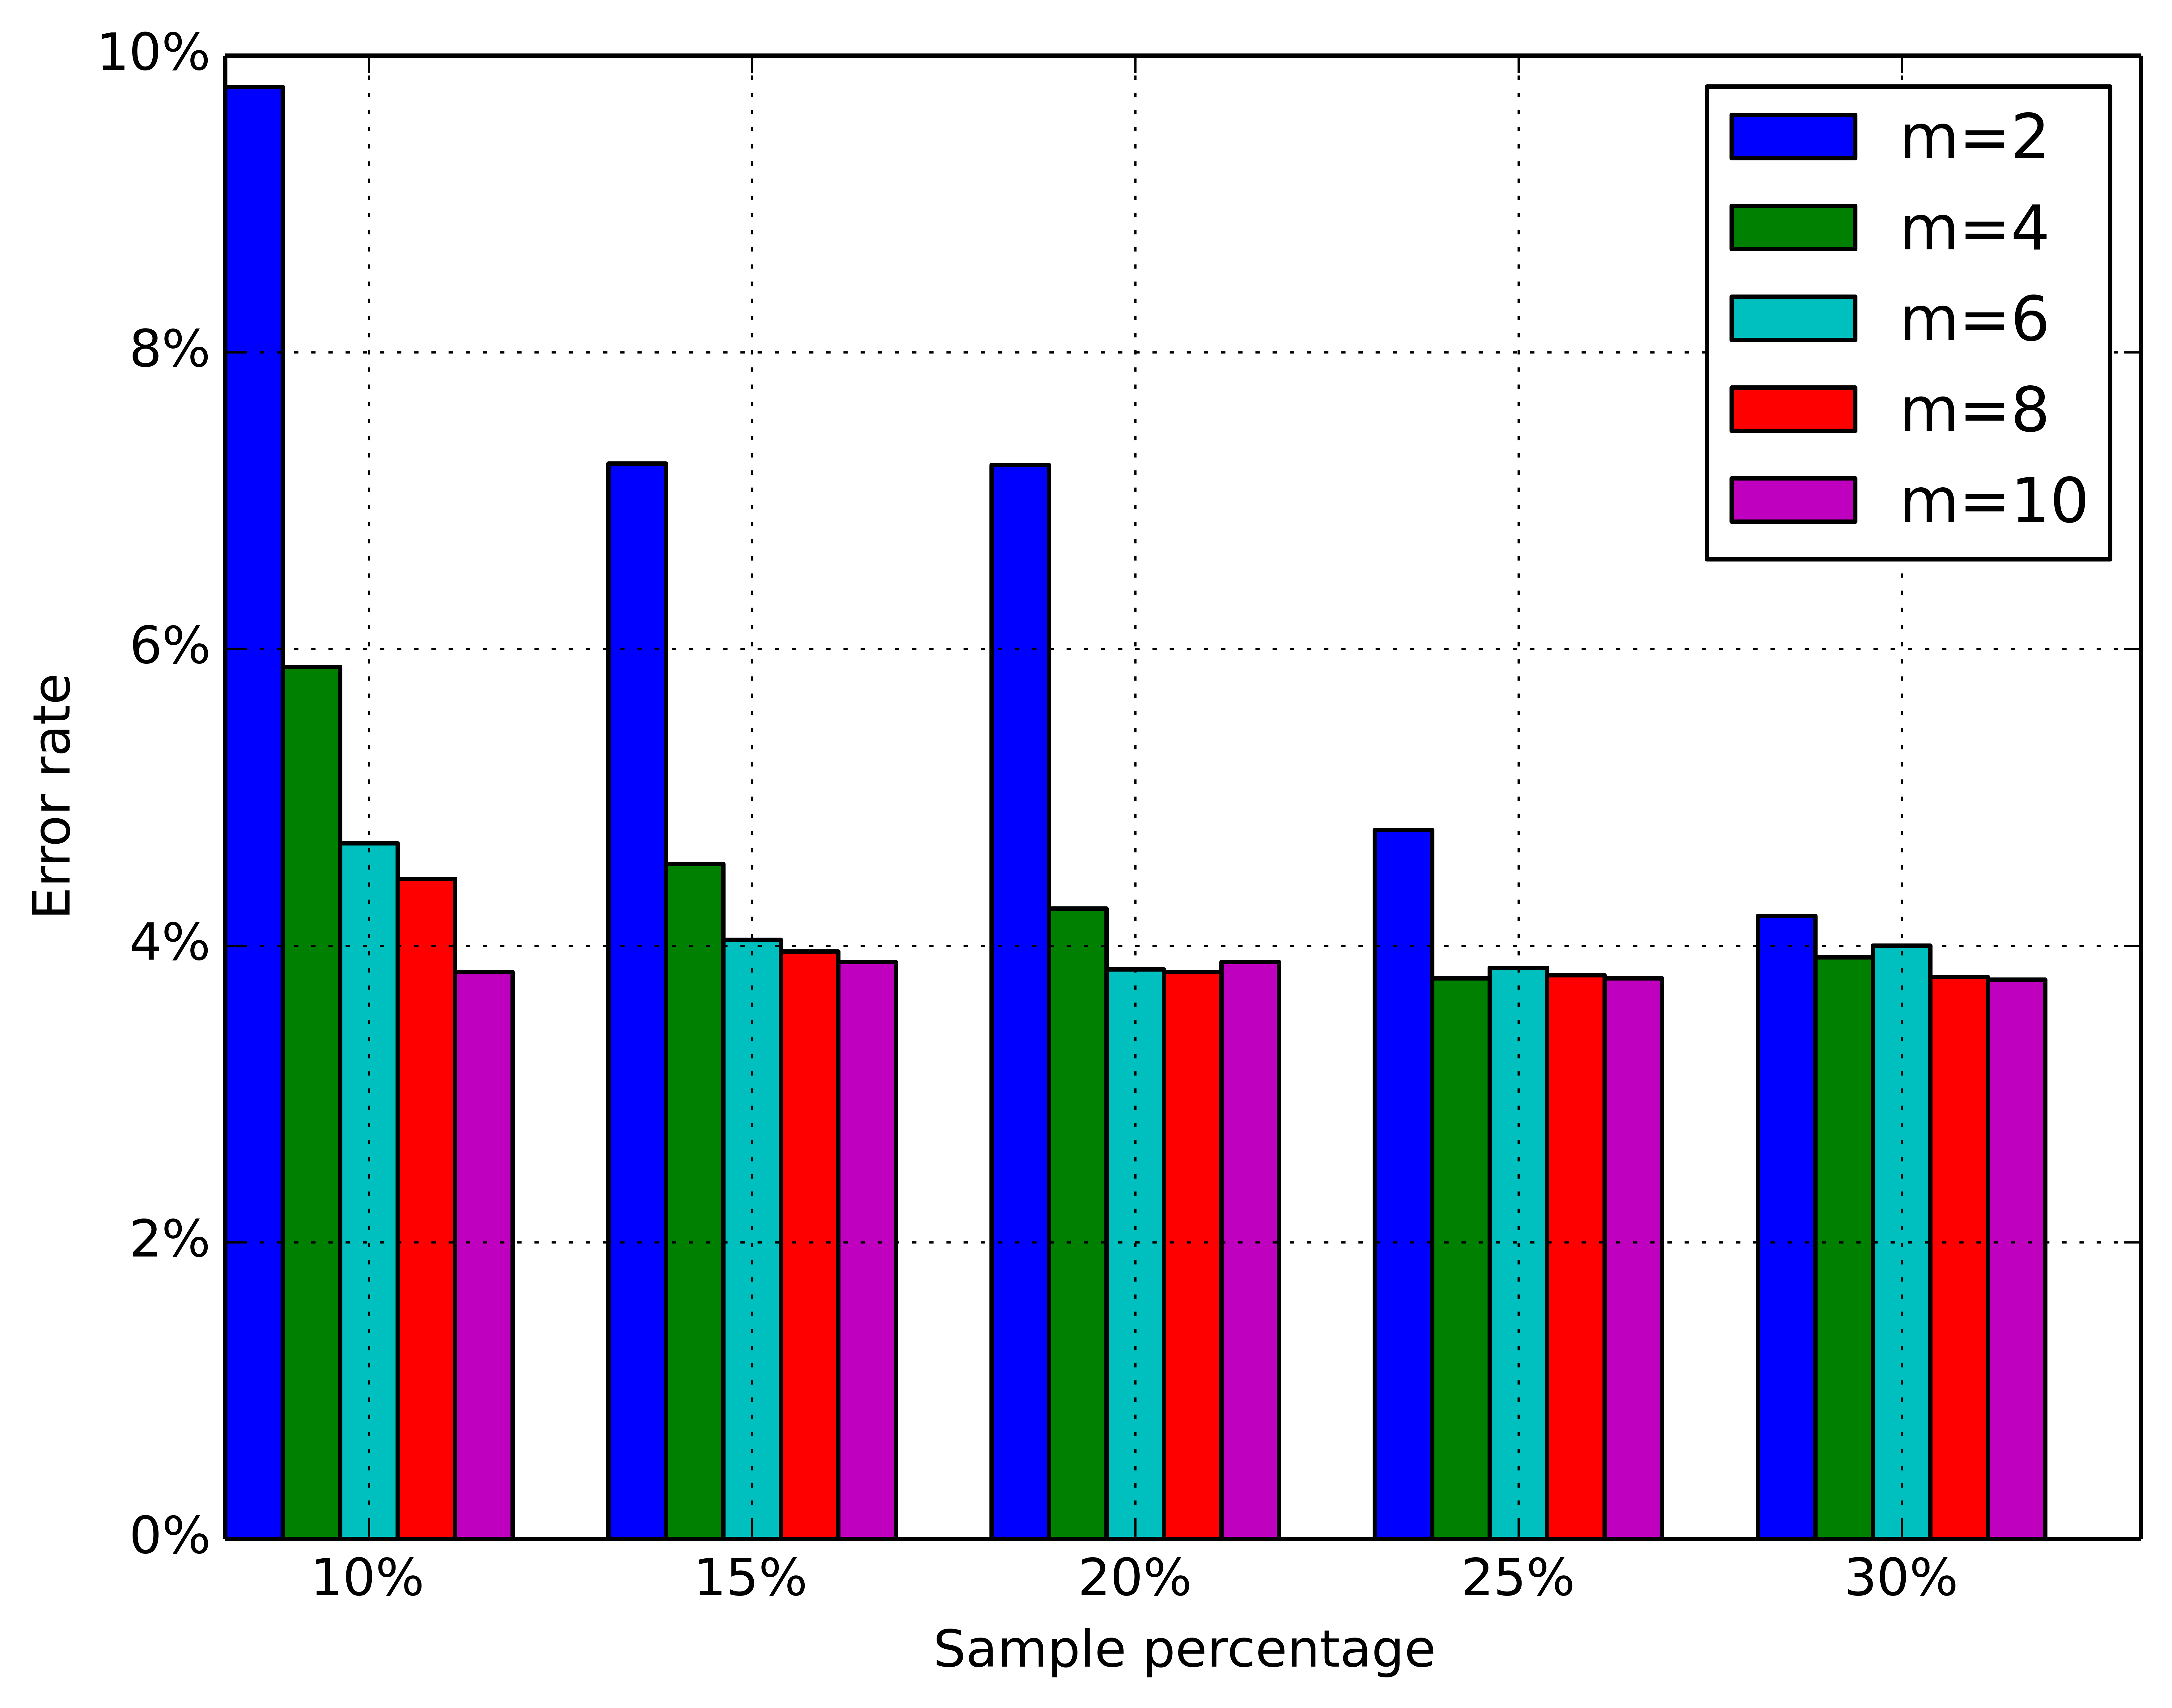
import scipy.io
import numpy as np
import matplotlib.pylab as pylab
import matplotlib.pyplot as plt
import matplotlib.ticker as mtick
# params={
    # 'axes.labelsize': '35',
    # 'xtick.labelsize':'27',
    # 'ytick.labelsize':'27',
    # 'lines.linewidth':2 ,
    # 'legend.fontsize': '27',
    # 'figure.figsize'   : '24, 9'
# }
# pylab.rcParams.update(params)


y1 = [9.79,7.25,7.24,4.78,4.20]
y2 = [5.88,4.55,4.25,3.78,3.92]
y3 = [4.69,4.04,3.84,3.85,4.0]
y4 = [4.45,3.96,3.82,3.80,3.79]
y5 = [3.82,3.89,3.89,3.78,3.77]


ind = np.arange(5)                # the x locations for the groups
width = 0.15
plt.bar(ind,y1,width,color = 'blue',label = 'm=2')
plt.bar(ind+width,y2,width,color = 'g',label = 'm=4') # ind+width adjusts the left start location of the bar.
plt.bar(ind+2*width,y3,width,color = 'c',label = 'm=6')
plt.bar(ind+3*width,y4,width,color = 'r',label = 'm=8')
plt.bar(ind+4*width,y5,width,color = 'm',label = 'm=10')
plt.xticks(np.arange(5) + 2.5*width, ('10%','15%','20%','25%','30%'))

plt.xlabel('Sample percentage')
plt.ylabel('Error rate')

fmt = '%.0f%%' # Format you want the ticks, e.g. '40%'
xticks = mtick.FormatStrFormatter(fmt)
# Set the formatter
axes = plt.gca()   # get current axes
axes.yaxis.set_major_formatter(xticks) # set % format to ystick.
axes.grid(True)
plt.legend(loc="upper right")
plt.savefig('test.png', format='png',dpi = 1000,bbox_inches='tight')

plt.show()
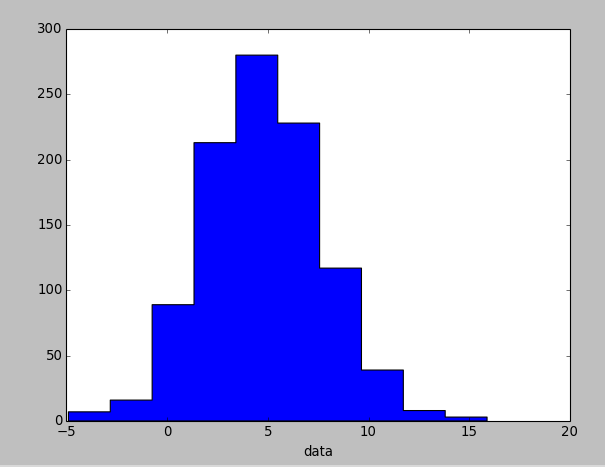
import numpy as np
import matplotlib.pyplot as plt
# make an array of random numbers with a gaussian distribution with
# mean = 5.0
# rms = 3.0
# number of points = 1000
data = np.random.normal(5.0, 3.0, 1000)
# make a histogram of the data array
plt.hist(data)
# make plot labels
plt.xlabel('data')
plt.show()

去掉中间的黑线
#-*- coding: utf-8 -*-
import numpy as np
import matplotlib.pyplot as plt
# make an array of random numbers with a gaussian distribution with
# mean = 5.0
# rms = 3.0
# number of points = 1000
data = np.random.normal(5.0, 3.0, 1000)
# make a histogram of the data array
# pl.hist(data)
plt.hist(data,histtype='stepfilled')
# make plot labels
plt.xlabel('data')
plt.show()
#-*- coding: utf-8 -*-
import numpy as np
import pylab as pl
# make an array of random numbers with a gaussian distribution with
# mean = 5.0
# rms = 3.0
# number of points = 1000
data = np.random.normal(5.0, 3.0, 1000)
# make a histogram of the data array
bins = np.arange(-5., 16., 1.) #浮点数版本的range
pl.hist(data, bins, histtype='stepfilled')
# pl.hist(data)
# make plot labels
pl.xlabel('data')
pl.show()

demo4:网状图
import networkx as nx
import pylab as plt
g = nx.Graph()
g.add_edge(1,2,weight = 4)
g.add_edge(1,3,weight = 7)
g.add_edge(1,4,weight = 8)
g.add_edge(1,5,weight = 3)
g.add_edge(1,9,weight = 3)

g.add_edge(1,6,weight = 6)
g.add_edge(6,7,weight = 7)
g.add_edge(6,8,weight = 7)

g.add_edge(6,9,weight = 6)
g.add_edge(9,10,weight = 7)
g.add_edge(9,11,weight = 6)


fixed_pos = {1:(1,1),2:(0.7,2.2),3:(0,1.8),4:(1.6,2.3),5:(2,0.8),6:(-0.6,-0.6),7:(-1.3,0.8), 8:(-1.5,-1), 9:(0.5,-1.5), 10:(1.7,-0.8), 11:(1.5,-2.3)} #set fixed layout location


#pos=nx.spring_layout(g) # or you can use other layout set in the module
nx.draw_networkx_nodes(g,pos = fixed_pos,nodelist=[1,2,3,4,5],
node_color = 'g',node_size = 600)
nx.draw_networkx_edges(g,pos = fixed_pos,edgelist=[(1,2),(1,3),(1,4),(1,5),(1,9)],edge_color='g',width = [4.0,4.0,4.0,4.0,4.0],label = [1,2,3,4,5],node_size = 600)


nx.draw_networkx_nodes(g,pos = fixed_pos,nodelist=[6,7,8],
node_color = 'r',node_size = 600)
nx.draw_networkx_edges(g,pos = fixed_pos,edgelist=[(6,7),(6,8),(1,6)],width = [4.0,4.0,4.0],edge_color='r',node_size = 600)

nx.draw_networkx_nodes(g,pos = fixed_pos,nodelist=[9,10,11],
node_color = 'b',node_size = 600)
nx.draw_networkx_edges(g,pos = fixed_pos,edgelist=[(6,9),(9,10),(9,11)],width = [4.0,4.0,4.0],edge_color='b',node_size = 600)

plt.text(fixed_pos[1][0],fixed_pos[1][1]+0.2, s = '1',fontsize = 40)
plt.text(fixed_pos[2][0],fixed_pos[2][1]+0.2, s = '2',fontsize = 40)
plt.text(fixed_pos[3][0],fixed_pos[3][1]+0.2, s = '3',fontsize = 40)
plt.text(fixed_pos[4][0],fixed_pos[4][1]+0.2, s = '4',fontsize = 40)
plt.text(fixed_pos[5][0],fixed_pos[5][1]+0.2, s = '5',fontsize = 40)
plt.text(fixed_pos[6][0],fixed_pos[6][1]+0.2, s = '6',fontsize = 40)
plt.text(fixed_pos[7][0],fixed_pos[7][1]+0.2, s = '7',fontsize = 40)
plt.text(fixed_pos[8][0],fixed_pos[8][1]+0.2, s = '8',fontsize = 40)
plt.text(fixed_pos[9][0],fixed_pos[9][1]+0.2, s = '9',fontsize = 40)
plt.text(fixed_pos[10][0],fixed_pos[10][1]+0.2, s = '10',fontsize = 40)
plt.text(fixed_pos[11][0],fixed_pos[11][1]+0.2, s = '11',fontsize = 40)

plt.show()

从文件中读取数据来画图
cat testdata.txt
0.0    0.0
1.0    1.0
2.0    4.0
3.0    9.0
4.0    16.0
5.0    25.0
6.0    36.0
7.0    49.0
8.0    64.0
9.0    81.0
import numpy as np
import matplotlib.pyplot as plt
# Use numpy to load the data contained in the file
# testdata.txt into a 2-D array called data
data = np.loadtxt('testdata.txt')
# plot the first column as x, and second column as y
plt.plot(data[:,0], data[:,1], 'ro')
plt.xlabel('x')
plt.ylabel('y')
plt.xlim(0.0, 10.)
plt.show()

写入数据到文件
import numpy as np
# Let's make 2 arrays (x, y) which we will write to a file
# x is an array containing numbers 0 to 10, with intervals of 1
x = np.arange(0.0, 10., 1.)
# y is an array containing the values in x, squared
y = x*x
print 'x = ', x
print 'y = ', y
# Now open a file to write the data to
# 'w' means open for 'writing'
file = open('testdata.txt', 'w')
# loop over each line you want to write to file
for i in range(len(x)):
    # make a string for each line you want to write
    # 'str()' means you are converting the quantity in brackets to a string type
    txt = str(x[i]) + '\t' + str(y[i]) + ' \n'
    # write the txt to the file
    file.write(txt)
# Close your file
file.close()
参考:
http://hyry.dip.jp/tech/book/page/scipy/matplotlib_fast_plot.html
http://reverland.org/python/2012/09/07/matplotlib-tutorial/
matplotlib中文翻译
http://hyry.dip.jp/tech/book/page/scipy/matplotlib.html

 浙公网安备 33010602011771号