SQL 追踪(SQL Trace)
SQL追踪(SQL Trace)是一个轻量级的追踪工具,按照事件(Events)记录数据库发生的消息,几乎对数据库性能没有什么影响。SQL Server内置一个Trace,称作默认追踪(Default Trace),默认追踪的ID是1,大家经常使用的SQL Server Profiler,就是利用SQL Trace记录数据库活动的一个工具。SQL Trace在SQL Server数据库引擎种出现的比较早,可以被性能和功能更卓越的扩展事件(Extended Events)取代。
一,查看默认追踪是否启用
默认追踪是系统内置的,TraceID是1,默认是开启的,可以通过系统配置表 sys.configurations 进行查看,配置项ID(configuration_id)是1568:
![]()
字段 value=1,表示Default Trace是开启的。
二,禁用或启用默认追踪
如果默认追踪被禁用,需要重新配置启用默认追踪:
exec sp_configure 'show advanced options' , 1 ;
go
reconfigure;
go

exec sp_configure 'default trace enabled' , 1 ;
go
reconfigure;
go
如果默认追踪已经启用,可以重新配置禁用默认追踪:
exec sp_configure 'default trace enabled' , 0 ;
go
reconfigure;
go

exec sp_configure 'show advanced options' , 0 ;
go
reconfigure;
go
三,查看默认追踪的信息
默认追踪记录的数据存储在文件中,可以从系统视图 sys.traces查看文件的路径,文件的大小(Size)和文件的更新方式等信息,追踪文件默认的扩展名是 .trc。
select id
    ,iif(status=1,'running','stopped') as status
    ,path
    ,max_size
    ,start_time
    ,stop_time
    ,event_count
    ,max_files
    ,is_rowset
    ,is_rollover
    ,is_shutdown
    ,is_default
    ,buffer_count
    ,buffer_size as each_buffer_size
from sys.traces
where id=1
默认追踪有5个跟踪文件,每一个文件的最大size默认是20MB,SQL Server负责维护这5个文件,当实例重启的时候或者到达文件Size最大值的时候,SQL Server创建新的文件,将最早创建的跟踪文件删除,依次滚动(Rollover)更新。
四,查看追踪文件的内容
函数sys.fn_trace_gettable,用于从追踪文件中读取数据,以关系表的格式显式:
sys.fn_trace_gettable ( 'filename' , number_files )
参数filename:用于指定追踪文件的名称,其值可以从系统视图sys.traces 中的path获取;
参数number_files:如果number_files 被指定为default,函数读取所有的滚动文件。
函数返回的是关系表,有效字段是:追踪关联的事件绑定的字段,
select *
from sys.fn_trace_gettable(N'C:\Program Files\Microsoft SQL Server\MSSQL11.MSSQLSERVER\MSSQL\Log\log_4.trc',default)
五,查看默认追踪记录的事件列表
函数fn_trace_geteventinfo(trace_id)返回追踪关联的事件列表,使用该函数可以查看默认追踪记录的事件和事件的特定字段:
select categ.name as category,
    te.trace_event_id as event_id,
    te.name as event_name,
    tc.trace_column_id as event_column_id,
    tc.name as column_name,
    tc.type_name as column_type
from sys.fn_trace_geteventinfo(1) as gei
inner join sys.trace_columns tc
    on gei.columnid=tc.trace_column_id
inner join sys.trace_events te
    on gei.eventid=te.trace_event_id
inner join sys.trace_categories categ
    on te.category_id=categ.category_id
order by category,event_id,event_column_id
六,查看事件和Category
Category用于组织事件(Event),是事件的分组,在SQL Server 2012中,共有21个Category,180个Event,每个Event属于唯一的一个Category。
select tc.name as category,
    te.trace_event_id as event_id,
    te.name as event_name
from sys.trace_categories tc
inner join sys.trace_events te
    on tc.category_id=te.category_id
order by category,event_id
七,查看事件绑定的字段
在SQL Server 2012中,事件共有66个字段,但不是每个Event都能绑定所有的66个字段,每个Event能够绑定的字段是固定的,系统预先设置,用户不能修改,视图 sys.trace_event_bindings 用于显示每个事件绑定的字段。
select te.trace_event_id as event_id,
    te.name as event_name,
    tc.trace_column_id as column_id,
    tc.name as column_name,
    tc.type_name as column_type
from sys.trace_event_bindings teb
inner join sys.trace_columns tc
    on teb.trace_column_id=tc.trace_column_id
inner join sys.trace_events te
    on teb.trace_event_id=te.trace_event_id
order by event_id,column_id
八,使用SQL Server Profiler创建SQL Trace
如果用户需要创建自定义的追踪,那么可以使用系统提供的存储过程来实现,但是,使用TSQL代码创建追踪的过程十分繁琐,代码量庞大,整个过程不直观。大家知道,SQL Server Profiler是一个可视化用于查看数据库活动的工具,同时,它也是一个用于创建SQL Trace的工具。使用SQL Server Profiler创建SQL Trace的过程十分简单:选择相应的事件和事件的字段之后,导出SQL Trace 的定义即可。
在创建SQL Trace之后,点击File->Export->Scipt Trace Definition,把SQL Server Profiler用于创建SQL Trace的脚本代码导出:
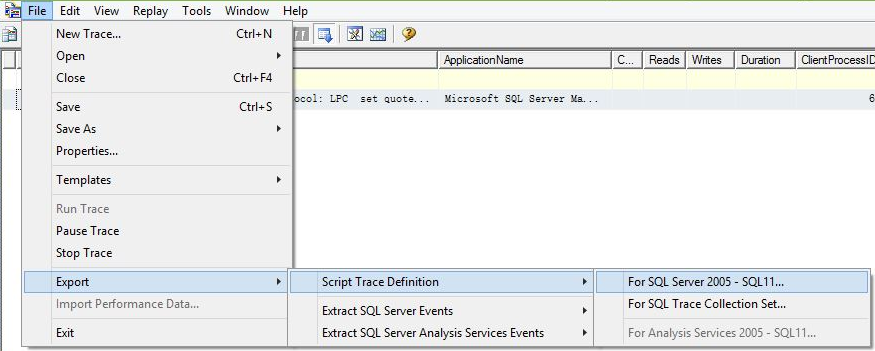
导出的脚本如下,不能直接使用,必须修改一处代码:在创建Trace时,指定存储追踪数据的文件(File) 或 关系表(Table),仅此而已。


-- Create a Queue
declare @rc int
declare @TraceID int
declare @maxfilesize bigint
set @maxfilesize = 5

-- Client side File and Table cannot be scripted
exec @rc = sp_trace_create @TraceID output, 0, N'InsertFileNameHere', @maxfilesize, NULL
if (@rc != 0) goto error

-- Set the events
declare @on bit
set @on = 1
exec sp_trace_setevent @TraceID, 14, 1, @on
exec sp_trace_setevent @TraceID, 14, 9, @on

--delete many commands here ---

-- Set the Filters
declare @intfilter int
declare @bigintfilter bigint
exec sp_trace_setfilter @TraceID, 1, 0, 6, N'%drop%'

-- Set the trace status to start
exec sp_trace_setstatus @TraceID, 1

-- display trace id for future references
select TraceID=@TraceID
goto finish

error:
select ErrorCode=@rc

finish:
go
注:SQL Trace是被扩展事件取代的功能,在后续的版本中将会被移除,建议在以后的开发中使用扩展事件。
参考文档:
Server-wide Configuration Catalog Views (Transact-SQL)

 浙公网安备 33010602011771号