


AEROBLADE论文研读和复现(详细流程) - 指南
本次研读了论文AEROBLADE:Training-Free Detection of Latent Diffusion Images Using
Autoencoder Reconstruction Error
简要介绍一下其工作:
这篇论文提出的AEROBLADE 是一种无需训练的潜在扩散模型(LDM)生成图像检测方法,主要思路是通过自编码器(AE)重建误差,结合在视觉感知上我们认为真实图像在某些高度复杂,具有混乱的细节等特征时重建难度大(即重建误差会偏大),而生成图像普遍采取规则、结构简单的图案,这些特征更容易被生成模型学习和重建(即重建误差会小一些)。通过上述分析,本片论文通过对图像进行重建,通过重建误差来区分真实图像和生成图像。
原理:
1.LDM与AE:
传统扩散模型(DM)直接在高维图像空间降噪,计算成本高;而LDM在低维潜空间完成降噪,流程如下:
编码:通过预训练 AE 的编码器(E),将图像映射到低维潜变量 z=E(x)(压缩 + 提取核心特征);
生成:在潜空间对 z 进行降噪迭代,得到纯净潜变量
;
解码:通过 AE 的解码器(D),将
=D(
重建误差被定义为:原始图像x与经过AE编码—解码后的重建图像的距离(通过LPIPS指标衡量)
选用LPIPS的原因:传统的图像相似度度量(如MSE、SSIM)在像素级别进行比较,无法有效捕捉人眼能够感知的语义级差异。LPIPS通过计算两幅图像在预训练深度卷积神经网络(如VGG)特征空间中的距离,能更好地反映人类对图像差异的主观判断。
2.AEROBLADE具体操作:
先定义两个基本假设:
假设一:对于任何LDM生成的模型,都存在对应的一个重建方法
,能够对任何图像x进行重建
假设二:由生成的图像,原始图像与其重建距离很小,因为其源自于
的潜在空间,是位于对应的AE所学习的数据流形之上的
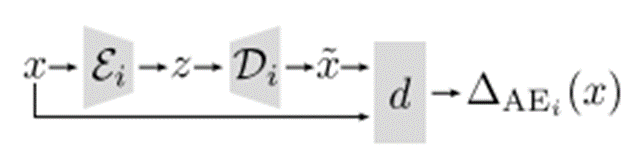
对于任意输入的图像,用某一个LDM的AE计算重建误差为:
流程图如下:
但是在实际场景中,生成图像可能来自于任意LDM,且不同的LDM的AE架构不同。
这里不依赖单个误差值,而是通过图像x在模型池中所有AE上的重建误差,去最小值作为最终判断依据:
对于生成的所有误差,我们只需要设定一个阈值,若误差小于
,我们则认为x是生成图像;否则是真实图像。
并且对于上面的分析,得到最小误差的对应模型,大概率是得到生成图像的模型
接下来进入复现部分:
写在前面:由于我们组在下载数据集的时候还是出现状况,并且本地电脑不足以支持过于庞大的数据集,所以我们组采取了分工收集图像(每个人贡献100张自己手机的真实图像,并尝试用AI生成图像),但是在结果上只能说差强人意,与论文的超高性能有一些差距,但是可以在一定程度上定性分析实验结果(后续有原因分析)。
本篇论文提供了实验代码,有一定的参考性:https://github.com/jonasricker/aeroblade
首先推荐下载一个Anaconda并配置好相应的环境(Anaconda可以在我们的主机创建虚拟环境,我们在复现论文或者做实验需要下载大量依赖的情况下,为了避免跟主机系统产生冲突和以后的实验产生冲突,推荐使用Anaconda)
首先创建一个虚拟环境,注意python版本号用3.10(跟论文相符,图示是3.9,后续我改成3.10了)
conda create -n aeroblade python=3.10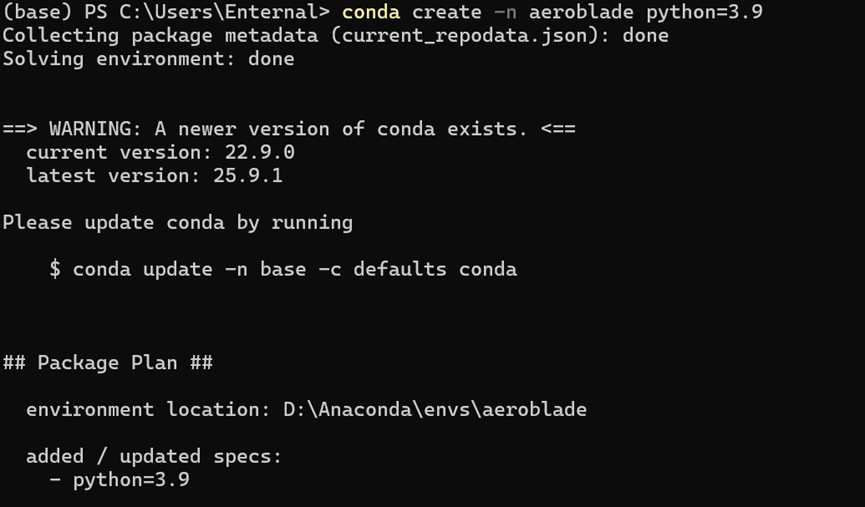
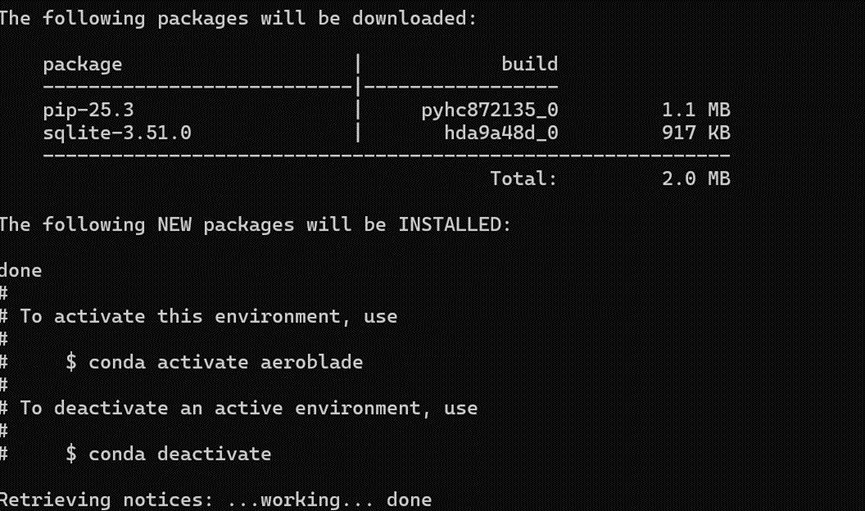
之后我们每次运行,只需要使用以下指令,即可切换环境
conda activate aeroblade在GitHub上将提供的代码下载后,其中有一个requirement.txt文件,执行:
pip install -r requirements.txt这个文件中有160多条依赖,可能需要下载时间较长,并且可能存在版本错误问题,尤其是这几行:
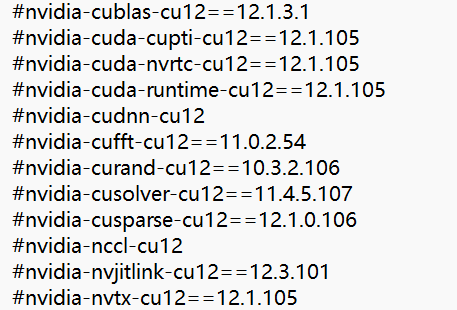
可以直接注释掉,待会下载Pytorch时会包含这些库的,本人运行时不受影响
之后按照提示加上下面的代码:
pip install -e .这个指令会把当前目录下的 Python 项目 “链接” 到你的 Python 环境中,而不是复制文件过去。这样本地项目代码修改后,无需重新安装,立即生效!
接下来是下载模型,这篇论文我们需要下载下面三个模型:
CompVis/stable-diffusion-v1-1
stabilityai/stable-diffusion-2-base
kandinsky-community/kandinsky-2-1
本人尝试过用终端下载,和去Hugging Face上下载,下载都比较慢,而且容易中断,这里推荐大家尝试一下阿里云搭建的一个平台魔塔社区ModelScope 魔搭社区
这个平台不但有模型库还有数据集,最重要的是因为是国内网站,我们下载速度会大幅度提高
使用的时候,只需要点击模型库,输入想要的模型
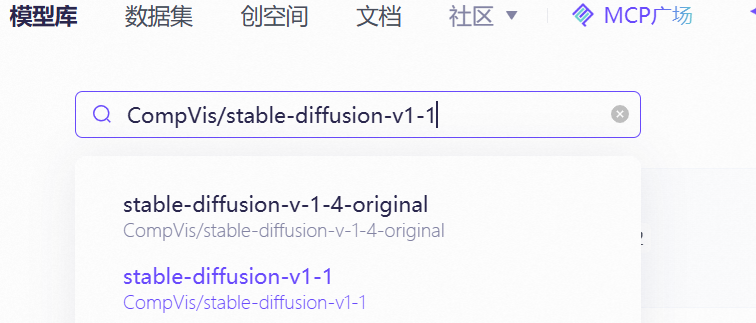
点击后点击右侧的下载模型,就会弹出来一个教程:
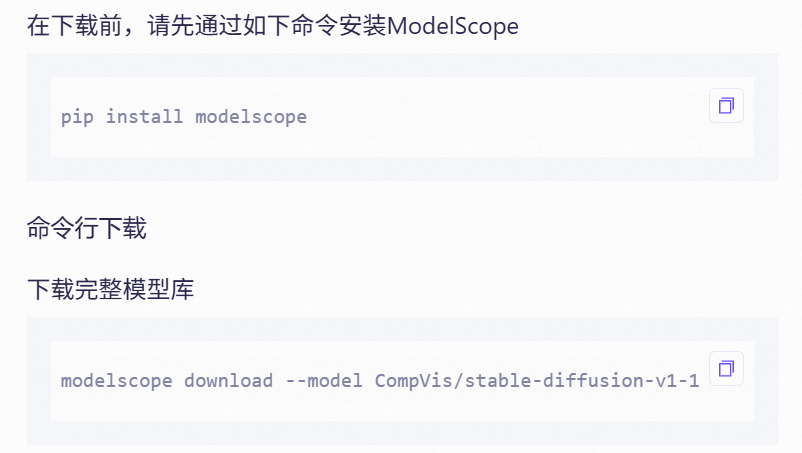
这里我也是采取命令行下载的,注意:这个下载代码会默认下载到C盘,可以在后续跟上想要下载的地址,避免C盘内存满了
只需要在后续加上这样的命令:
--local_dir 你的目标地址注意这里的目标地址不要只写个D:\或者E:\,需要指定一个文件夹,不然会报错
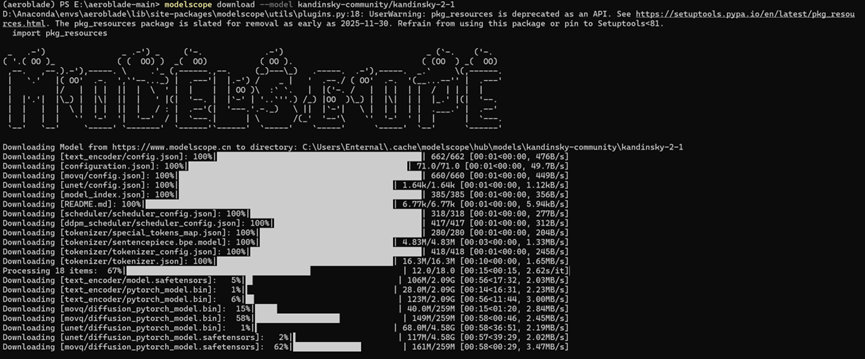
可以看见下载速率还是很快的,但是依然存在一个问题,下载完第三个模型后,我们如果直接运行会跳出这样的报错:
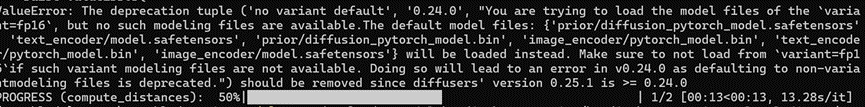
这个告诉我们,我们缺少了prior文件夹,所以我们还需要补充下载kandinsky-2-1-prior模型,放在同一个文件夹即可。
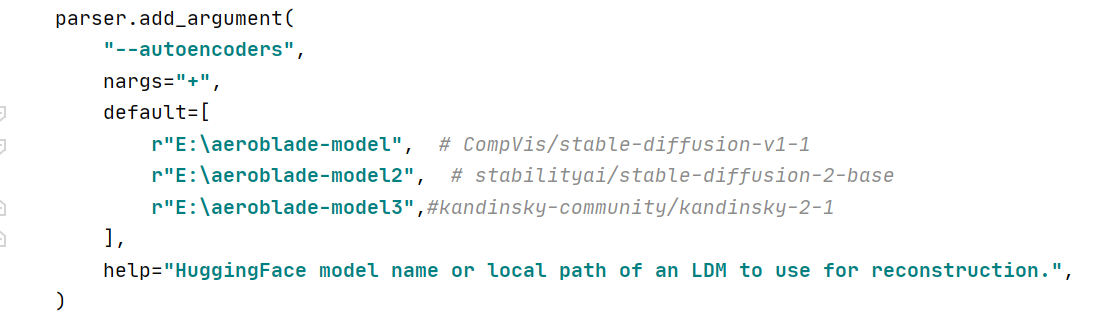
注意,后文遇到关于模型的地方:
我这边下载的模型对应文件夹是:
r"E:\aeroblade-model", # CompVis/stable-diffusion-v1-1
r"E:\aeroblade-model2", # stabilityai/stable-diffusion-2-base
r"E:\aeroblade-model3",#kandinsky-community/kandinsky-2-1
下载好完整模型后我们考虑数据集:
虽然我并没有使用作者的数据集,但是我在这里也把详细的方法写出来,作者在AEROBLADE: Training-Free Detection of Latent Diffusion Images Using Autoencoder Reconstruction Error (Dataset)
这个网址提供了他们的生成图像的数据集,但是我在下载过程中经常出现中断情况,始终没有下载下来,于是放弃了这个做法
真实图像的获取:
也可以直接在魔塔社区搜索(laion是一个庞大的数据集)

由于其实我们并不需要这么庞大的数据集,这个在Hugging Face上也可以找到,下载其中少部分.parquet文件即可,这个文件存储了大量的图片信息包括其url,运行时会通过这些信息访问对应的网站获取图片,但是存在一个问题就是,由于数据集存在大量旧的信息,所以很多网站可能失效了,或者由于在国外无法访问,本人在执行的过程中也出现其实效果不好的情况。
于是我们采用自己搭建的数据集进行接下来的实验部分(存在一部分效果不是特别好,后面会分析原因):
1.初步实验,真实图像和生成图像各选一张进行初步测试(用:CompVis/stable-diffusion-v1-1单个模型测试)
python scripts/run_aeroblade.py --files-or-dirs path/to/img.png path/to/dir通过这个代码运行,指定好对应的图片路径,并且run_aeroblade.py中存在默认的模型,我们是已经下载到本地了,所以把那部分代码改成自己对应的本地地址
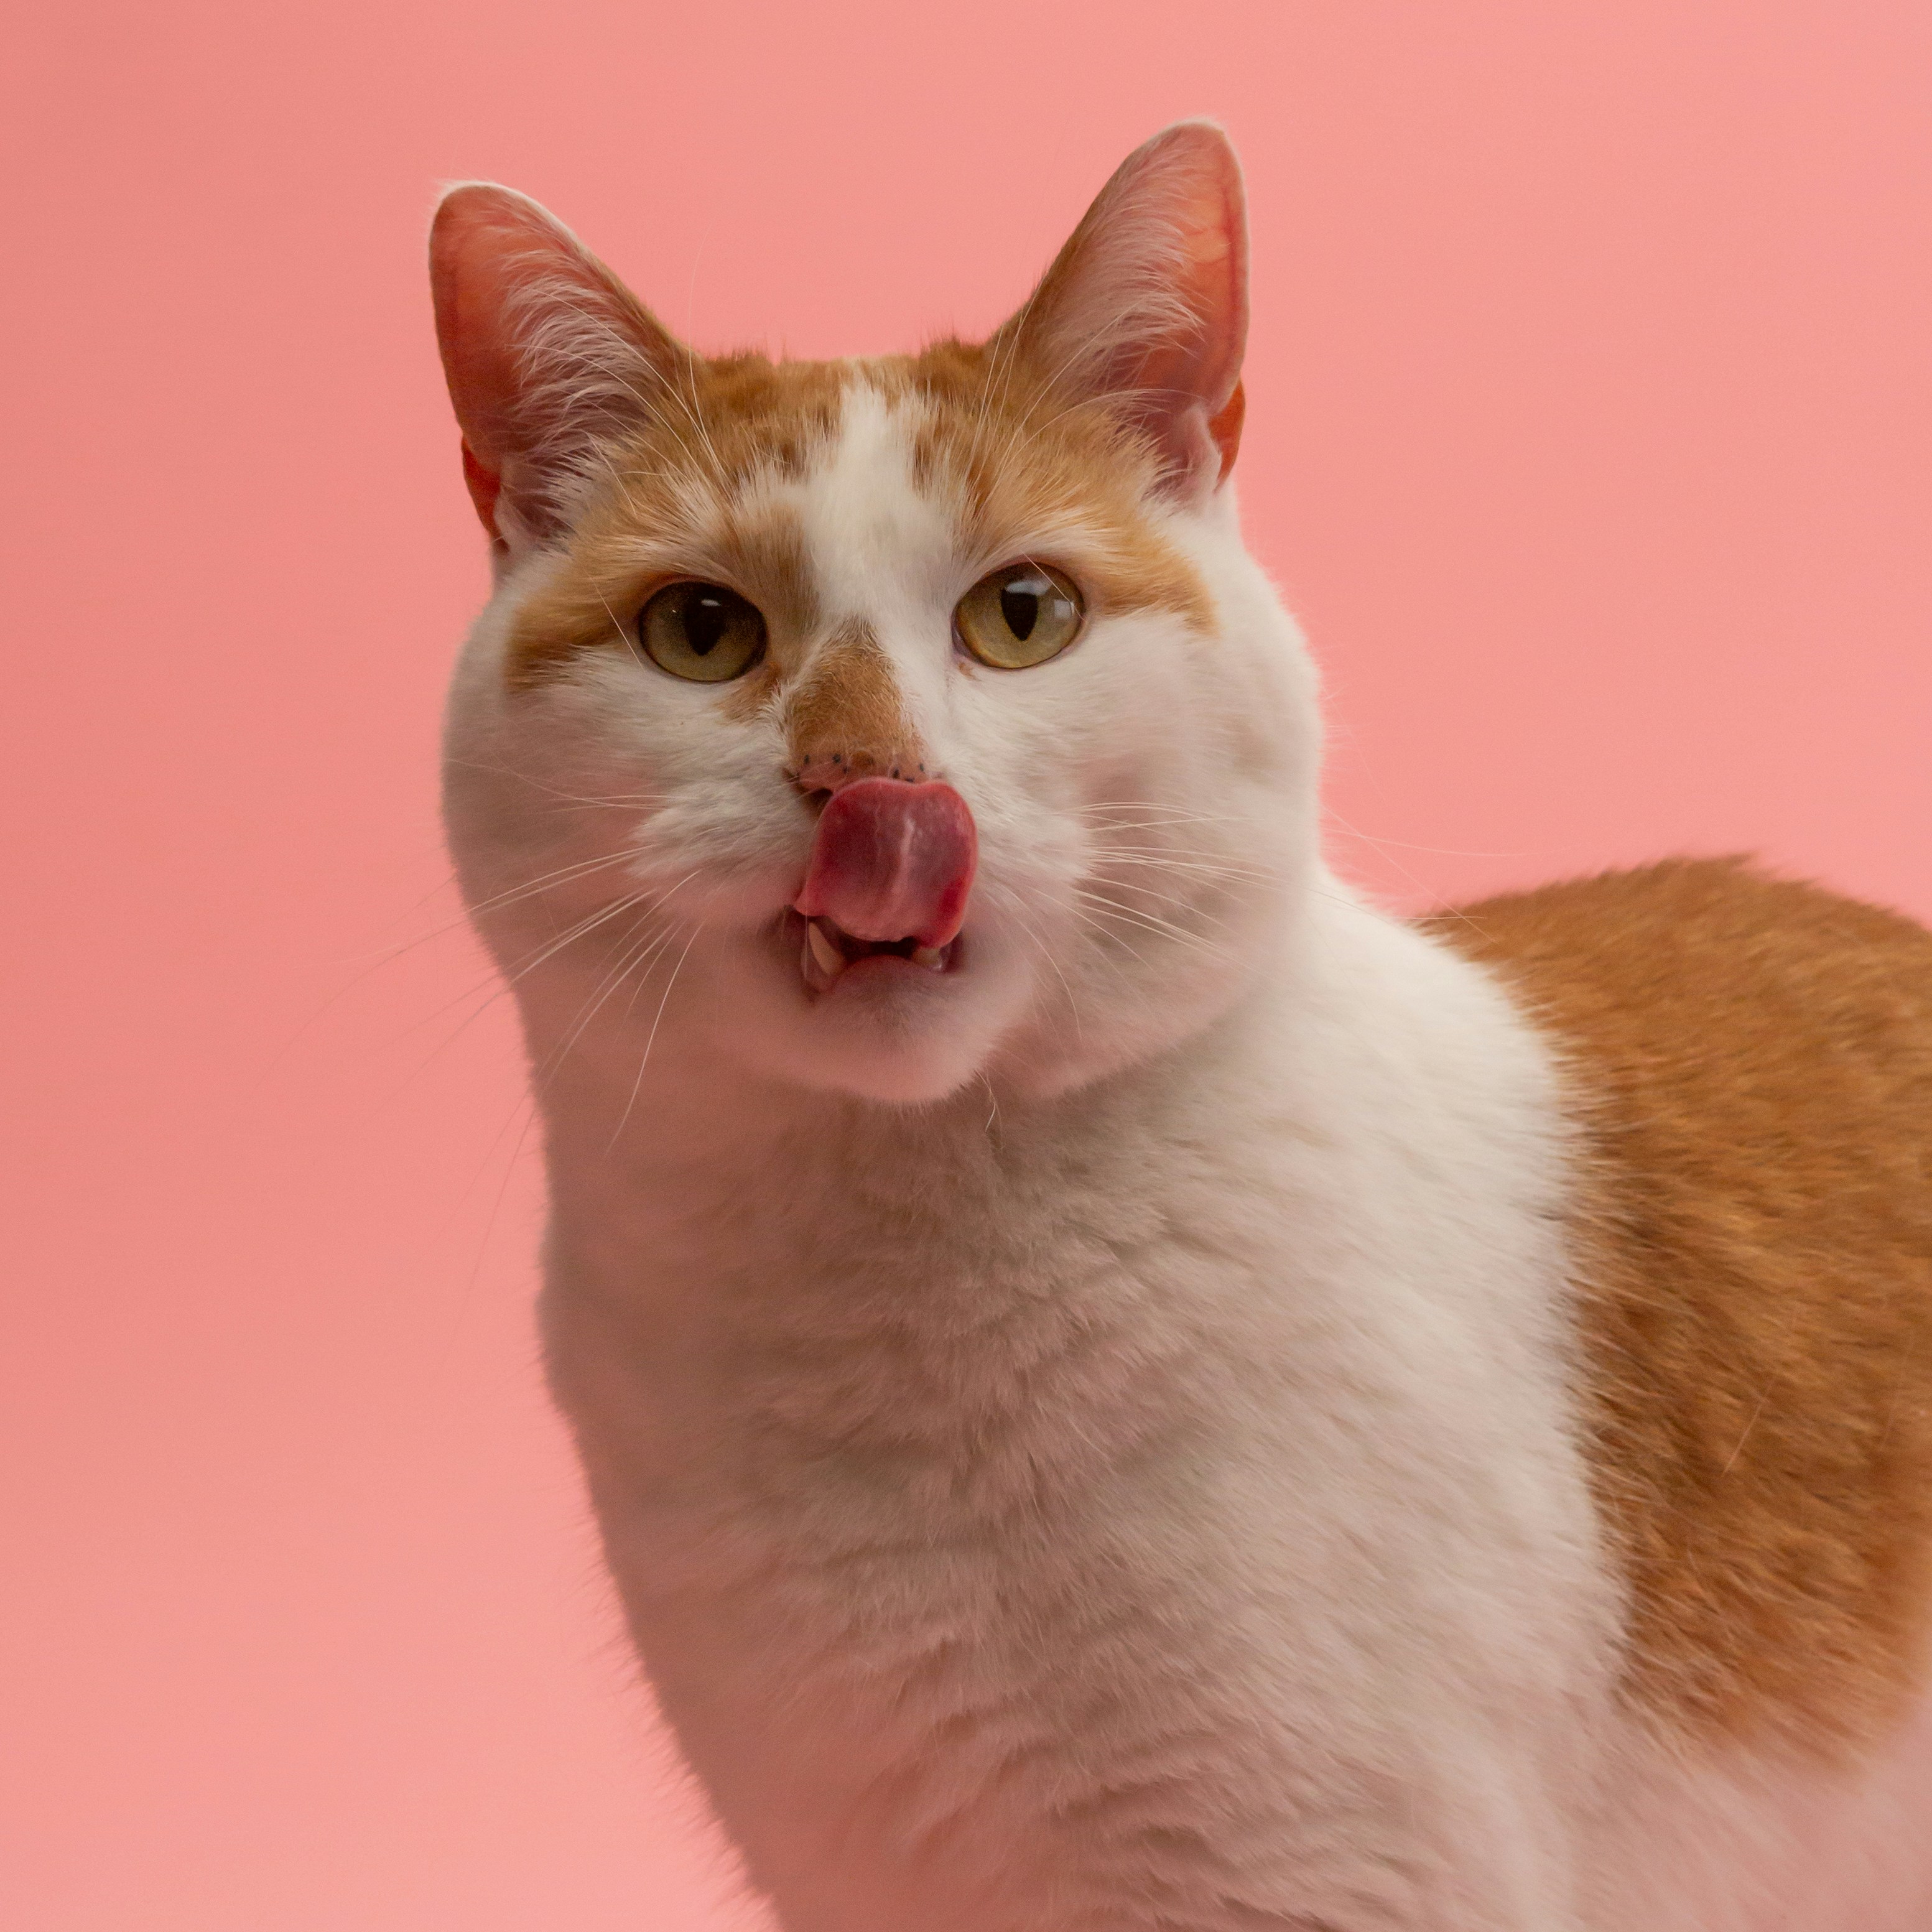
我们选取的生成图像原图和重建后的图像(肉眼看没啥区别,最明显的差别反而是右下角那个豆包生成(bushi):

其实写到这里我就找到一个非常重要的导致我们效果不好的原因:生成图像存在文字部分,文字部分恰恰复杂度较高,具有一定真实图像的特征。
真实图像原图与重建后的图像:
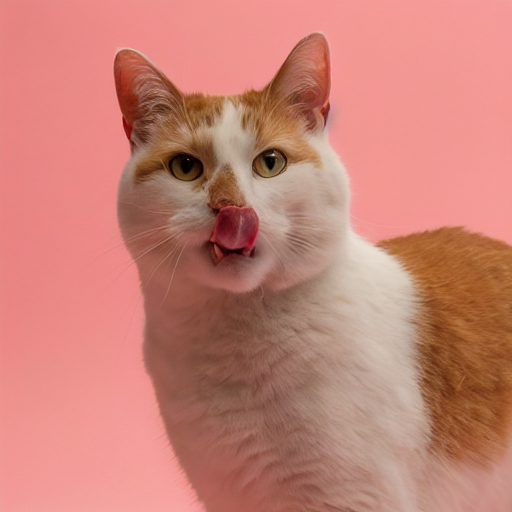
这个肉眼是确实看不出来区别了
对应的结果(重建误差):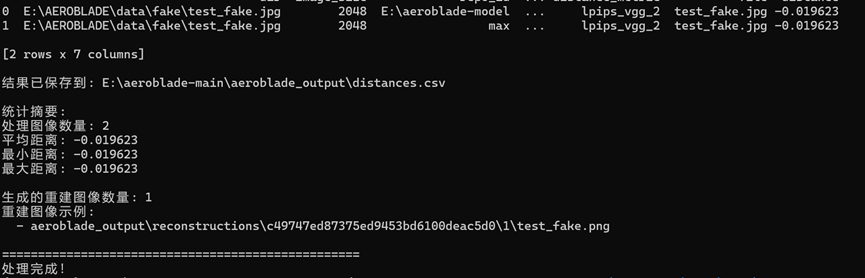
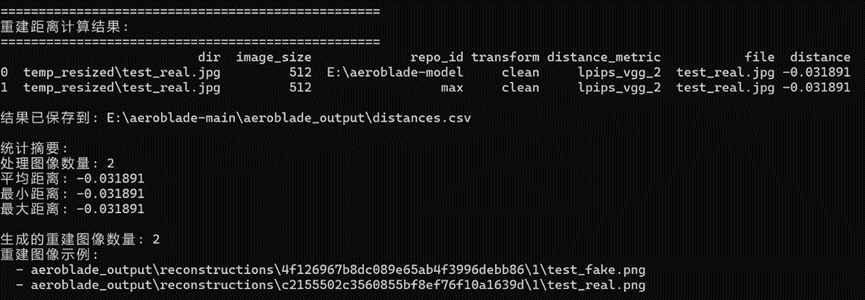
需要注意一个点,因为我们计算出来结果是负的,原文提到了采取min策略分析,这里用max是相符合的。这里单一图像结果已经大致符合原文提到的生成图像的重建误差会小于真实图像(尽管我们前面提到了我们的生成图像存在局限性)
后续我们需要用到较多的数据,所以我补充了两个辅助代码文件:
首先是image_resizer.py,这个代码可以将指定路径的图片进行重塑成512×512(论文要求,并且如果图像太大运行会非常吃力)
"""
批量处理图片:长方形图片中心裁剪后缩放至512×512,正方形图片直接缩放
"""
import os
import argparse
from pathlib import Path
from PIL import Image
from tqdm import tqdm  # 用于显示进度条
def process_image(image_path, output_path, target_size=(512, 512)):
    """
    处理单张图片:
    - 正方形图片:直接缩放到目标尺寸
    - 长方形图片:中心裁剪后缩放到目标尺寸
    """
    try:
        # 打开图片并确保是RGB模式
        with Image.open(image_path) as img:
            img = img.convert('RGB')
            width, height = img.size
            # 判断是否为正方形
            if width == height:
                # 正方形图片直接缩放
                img_resized = img.resize(target_size, Image.Resampling.LANCZOS)
            else:
                # 长方形图片先中心裁剪,再缩放
                # 计算裁剪尺寸(取较短边)
                crop_size = min(width, height)
                # 计算中心裁剪的坐标
                left = (width - crop_size) // 2
                top = (height - crop_size) // 2
                right = left + crop_size
                bottom = top + crop_size
                # 中心裁剪
                img_cropped = img.crop((left, top, right, bottom))
                # 缩放到目标尺寸
                img_resized = img_cropped.resize(target_size, Image.Resampling.LANCZOS)
            # 保存处理后的图片
            img_resized.save(output_path, quality=95)
            return True
    except Exception as e:
        print(f"处理图片 {image_path} 时出错: {e}")
        return False
def batch_process_images(input_dir, output_dir, target_size=(512, 512), extensions=('.jpg', '.jpeg', '.png', '.bmp', '.gif')):
    """
    批量处理目录下的所有图片
    """
    # 创建输出目录(如果不存在)
    os.makedirs(output_dir, exist_ok=True)
    # 获取所有图片文件
    image_files = []
    for ext in extensions:
        image_files.extend(Path(input_dir).glob(f"*{ext}"))
        image_files.extend(Path(input_dir).glob(f"*{ext.upper()}"))
    if not image_files:
        print(f"在目录 {input_dir} 中未找到图片文件")
        return
    # 批量处理图片
    success_count = 0
    failed_count = 0
    print(f"开始处理 {len(image_files)} 张图片...")
    for image_path in tqdm(image_files, desc="处理进度"):
        # 构建输出路径
        output_path = os.path.join(output_dir, image_path.name)
        # 处理图片
        if process_image(image_path, output_path, target_size):
            success_count += 1
        else:
            failed_count += 1
    # 输出处理结果
    print(f"\n处理完成!")
    print(f"成功: {success_count} 张")
    print(f"失败: {failed_count} 张")
    print(f"输出目录: {output_dir}")
def main():
    # 设置命令行参数
    parser = argparse.ArgumentParser(description='批量处理图片为512×512大小')
    parser.add_argument('--input-dir', '-i', required=True, help='输入图片目录')
    parser.add_argument('--output-dir', '-o', default='processed_images', help='输出目录(默认:processed_images)')
    parser.add_argument('--size', '-s', type=int, nargs=2, default=[512, 512], help='目标尺寸(默认:512 512)')
    args = parser.parse_args()
    # 执行批量处理
    batch_process_images(args.input_dir, args.output_dir, tuple(args.size))
if __name__ == "__main__":
    # 如果需要安装依赖,运行:pip install pillow tqdm
    main()
这个文件的运行指令为:
python image_resizer.py --input-dir /path/to/your/images --output-dir /path/to/output指定输入的地址和输出的地址
之后还有一个image_rename.py这个代码可以将文件进行重命名(按照编号)
"""批量重命名文件夹中的所有图片,支持自定义前缀(如real_0、fake_0)"""
import argparse
from pathlib import Path
from tqdm import tqdm  # 进度条显示(可选,没有也能运行)
import shutil
def rename_images(
    input_dir: Path,
    output_dir: Path = None,
    prefix: str = "img_",  # 自定义前缀(默认img_,可改为real_、fake_等)
    start_num: int = 0,
    img_format: str = "auto"
):
    """
    重命名文件夹中的图片文件(支持自定义前缀)
    Args:
        input_dir: 原始图片文件夹路径
        output_dir: 重命名后图片的输出文件夹(None则直接在原文件夹修改)
        prefix: 文件名前缀(如"real_"、"fake_")
        start_num: 起始编号(默认从0开始)
        img_format: 输出图片格式(默认png,设为"auto"则保持原格式)
    """
    # 定义支持的图片格式
    supported_formats = ('.png', '.jpg', '.jpeg', '.webp', '.bmp', '.gif')
    # 获取所有图片文件并排序(按文件名自然排序)
    img_files = sorted([
        f for f in input_dir.glob("*")
        if f.suffix.lower() in supported_formats and f.is_file()
    ])
    if not img_files:
        print(f"⚠️  在 {input_dir} 中未找到任何图片文件!")
        return
    # 处理输出目录(不存在则创建)
    if output_dir is None:
        output_dir = input_dir  # 直接在原文件夹修改
    else:
        output_dir.mkdir(parents=True, exist_ok=True)
        print(f" 输出目录:{output_dir.absolute()}")
    # 遍历图片并批量重命名
    print(f" 开始重命名 {len(img_files)} 张图片(前缀:{prefix},从编号 {start_num} 开始)...")
    for idx, old_file in tqdm(enumerate(img_files, start=start_num), total=len(img_files)):
        # 确定输出格式:auto则保持原格式,否则强制转为指定格式
        if img_format.lower() == "auto":
            new_suffix = old_file.suffix.lower()
        else:
            new_suffix = f".{img_format.lower().lstrip('.')}"
        # 生成新文件名(前缀+编号+后缀,编号补0到固定位数)
        # 位数自动适配(比如100张图→3位,1000张图→4位,避免排序混乱)
        digit_length = len(str(len(img_files) + start_num - 1))
        new_filename = f"{prefix}{idx:0{digit_length}d}{new_suffix}"
        new_file = output_dir / new_filename
        # 避免文件名冲突(如果已存在则跳过)
        if new_file.exists():
            print(f"⚠️  跳过 {old_file.name} → {new_filename}(文件已存在)")
            continue
        # 执行重命名(如果输出目录和原目录不同,则复制后保留原文件)
        if output_dir == input_dir:
            old_file.rename(new_file)
        else:
            shutil.copy2(old_file, new_file)  # copy2会保留文件元数据(如创建时间)
    print(f"✅ 重命名完成!共处理 {len(img_files)} 张图片")
    print(f" 文件名格式:{prefix}000...0{new_suffix}({digit_length}位编号)")
    print(f" 示例:{prefix}{start_num:0{digit_length}d}{new_suffix}、{prefix}{start_num+1:0{digit_length}d}{new_suffix}")
def parse_args():
    parser = argparse.ArgumentParser(description="批量重命名图片,支持自定义前缀(如real_0、fake_0)")
    parser.add_argument(
        "--input-dir",
        type=Path,
        required=True,
        help="原始图片文件夹路径(必填)"
    )
    parser.add_argument(
        "--output-dir",
        type=Path,
        default=None,
        help="重命名后图片的输出文件夹(默认直接在原文件夹修改,不填则覆盖原文件名)"
    )
    parser.add_argument(
        "--prefix",
        type=str,
        default="img_",
        help="文件名前缀(如'real_'、'fake_',默认'img_')"
    )
    parser.add_argument(
        "--start-num",
        type=int,
        default=0,
        help="起始编号(默认从0开始)"
    )
    parser.add_argument(
        "--img-format",
        type=str,
        default="auto",
        choices=["auto", "png", "jpg", "jpeg", "webp", "bmp", "gif"],
        help="输出图片格式(auto=保持原格式,默认auto)"
    )
    return parser.parse_args()
if __name__ == "__main__":
    args = parse_args()
    rename_images(
        input_dir=args.input_dir,
        output_dir=args.output_dir,
        prefix=args.prefix,
        start_num=args.start_num,
        img_format=args.img_format
    )
这个代码的运行指令:
python rename_images.py --input-dir /path/to/your/images --output-dir /path/to/output --prefix "fake_"注意上述前缀可以改成"real_"
还有两个补充参数,需要的可以使用:
--start-num  #起始编号(默认从 0 开始)
--img-format #图片格式(auto 保持原格式,默认 auto,可以改成png)在运行整个数据集和模型之前还有一个问题要解决,我在运行的过程中,出现了AutoPipeline无法识别Kandinsky模型的问题,需要对"..\src\aeroblade\image.py"文件对于模型的处理逻辑进行修改:
        if is_kandinsky:
            print(f"检测到Kandinsky模型,使用MOVQ直接编码解码: {repo_id}")
            # 只加载MOVQ组件(避免复杂pipeline调用)
            try:
                ae = VQModel.from_pretrained(
                    repo_id,
                    subfolder="movq",
                    torch_dtype=torch.float16,
                    use_safetensors=True,
                )
                ae.to(device())  # 直接加载到GPU
                print("Kandinsky MOVQ组件加载成功!")
            except Exception as e:
                raise ValueError(f"Kandinsky MOVQ组件加载失败: {e}\n请确保模型目录下有movq子目录及完整文件")
        else:
            # 标准加载(Stable Diffusion系列)
            print(f"使用标准AutoPipeline加载模型: {repo_id}")
            pipe = AutoPipelineForImage2Image.from_pretrained(
                repo_id,
                torch_dtype=torch.float16,
                use_safetensors=True,
                variant="fp16",
            )
            pipe.enable_model_cpu_offload()
            # 提取AE(VAE)
            if hasattr(pipe, "vae"):
                ae = pipe.vae
                if hasattr(pipe, "upcast_vae"):
                    pipe.upcast_vae()
            elif hasattr(pipe, "movq"):
                ae = pipe.movq
        if ae is None:
            raise ValueError("无法提取自动编码器(AE/VAE/MOVQ)")
        ae = torch.compile(ae)
        decode_dtype = next(iter(ae.post_quant_conv.parameters())).dtype
        # 统一重构逻辑(Kandinsky和SD共用一套编码解码流程)
        generator = torch.Generator().manual_seed(seed)
        reconstruction_paths = []
        for images, paths in tqdm(
                DataLoader(ds, batch_size=batch_size, num_workers=num_workers),
                desc=f"Reconstructing with {repo_id.split(os.sep)[-1]}.",
        ):
            # 图像归一化
            images = images.to(device(), dtype=ae.dtype) * 2.0 - 1.0
            # 编码
            if is_kandinsky:
                latents = ae.encode(images).latents
            else:
                latents = retrieve_latents(ae.encode(images), generator=generator)
            # 解码
            if isinstance(ae, (VQModel, DiffusersVQModel)):
                reconstructions = ae.decode(
                    latents.to(decode_dtype), force_not_quantize=True, return_dict=False
                )[0]
            else:
                reconstructions = ae.decode(
                    latents.to(decode_dtype), return_dict=False
                )[0]
            # 反归一化
            reconstructions = (reconstructions / 2 + 0.5).clamp(0, 1)
            # 保存重建图像
            for reconstruction, path in zip(reconstructions, paths):
                reconstruction_path = output_dir / f"{Path(path).stem}.png"
                to_pil_image(reconstruction).save(reconstruction_path)
                reconstruction_paths.append(reconstruction_path)
        print(f"重建图像已保存到: {output_dir}")
    return reconstruction_paths
修改成单独识别Kandinsky模型,使用MOVQ组件(模型对应的文件夹内有)直接编码解码,解决了这个问题我们就可以开始运行了!
接下来我们运行整个数据集和模型:
python experiments/01_detect.py --real-dir "E:\AEROBLADE\data\real_rename" --fake-dirs "E:\AEROBLADE\data\fake_rename" --num-workers 0 --batch-size 1这是我的运行指令,对应的目录需要修改,补充的后面两个参数的意义:
--num-workers 0 #控制数据加载的并行线程数(我们不并行)
--batch-size 1 #每次处理的批量数据量(一次处理多少样本)这样做可以避免出现GPU内存不够的情况
运行结果保存在..\output\01\default目录下,主要有两个结果:
溯源分析: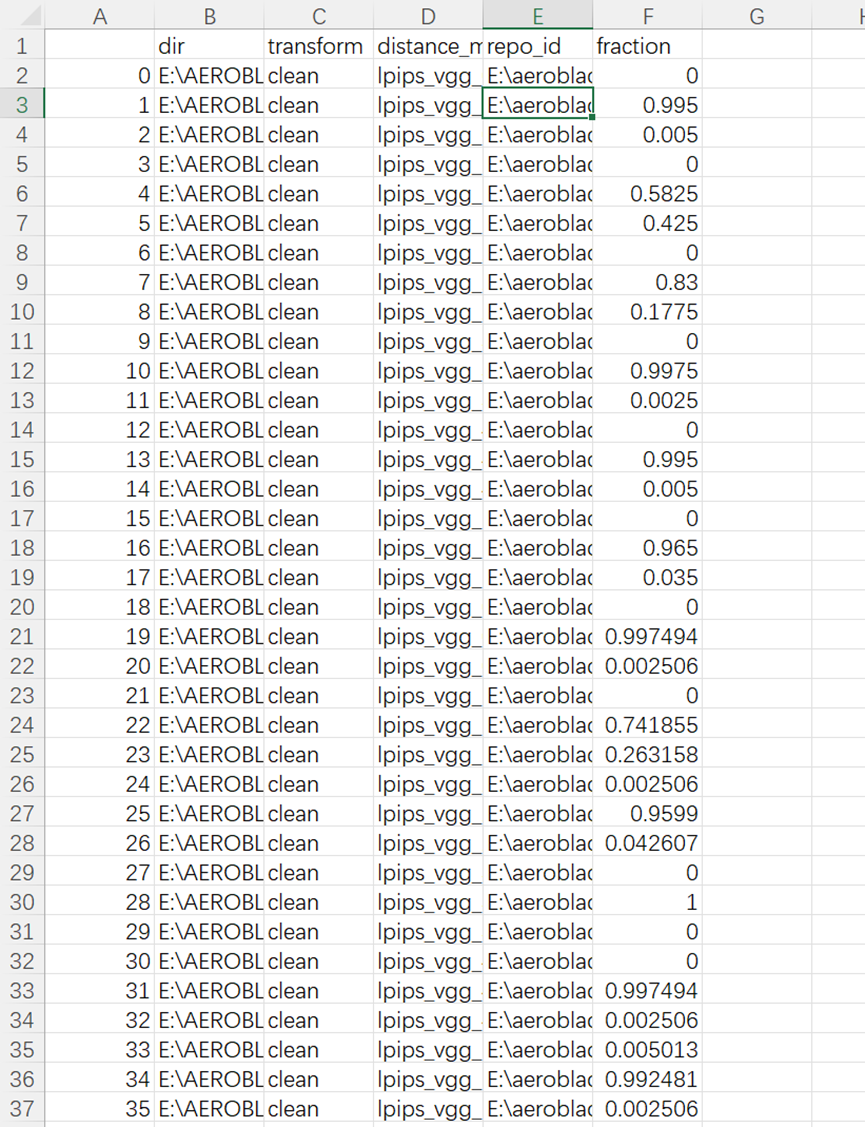
这个说明了我们的生成图像大致都是由model2(stabilityai/stable-diffusion-2-base)产生的。(确实是比较符合的,我们大多数数据都是由豆包生成的)(所以我们的运行结果可能还因为数据集来源单一导致结果会差一点)
性能分析: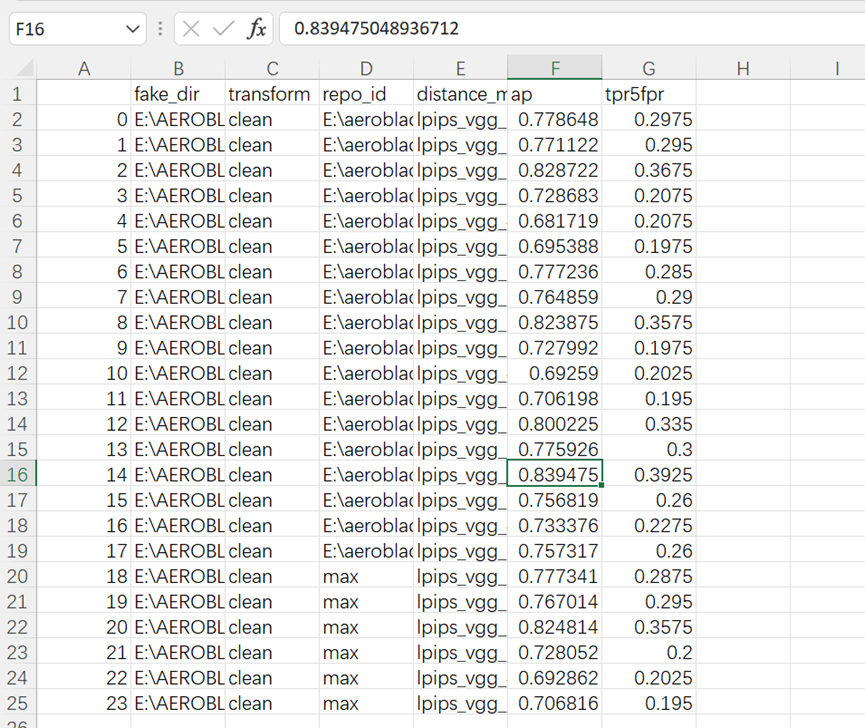
我们效果最好的一种情况是model3且使用lpips_vgg_2
并且各种模型的组合中lpips_vgg_2的组合性能都最好(与论文相符)
在最优组合的情况下84%的图像能被正确区分成真实或伪造图像(比论文数据差一点),且在假阳率小于5%的严格控制误杀情况下,能识别40%的伪造图
补充测试:
1.分析复杂度与重建模型的关系:
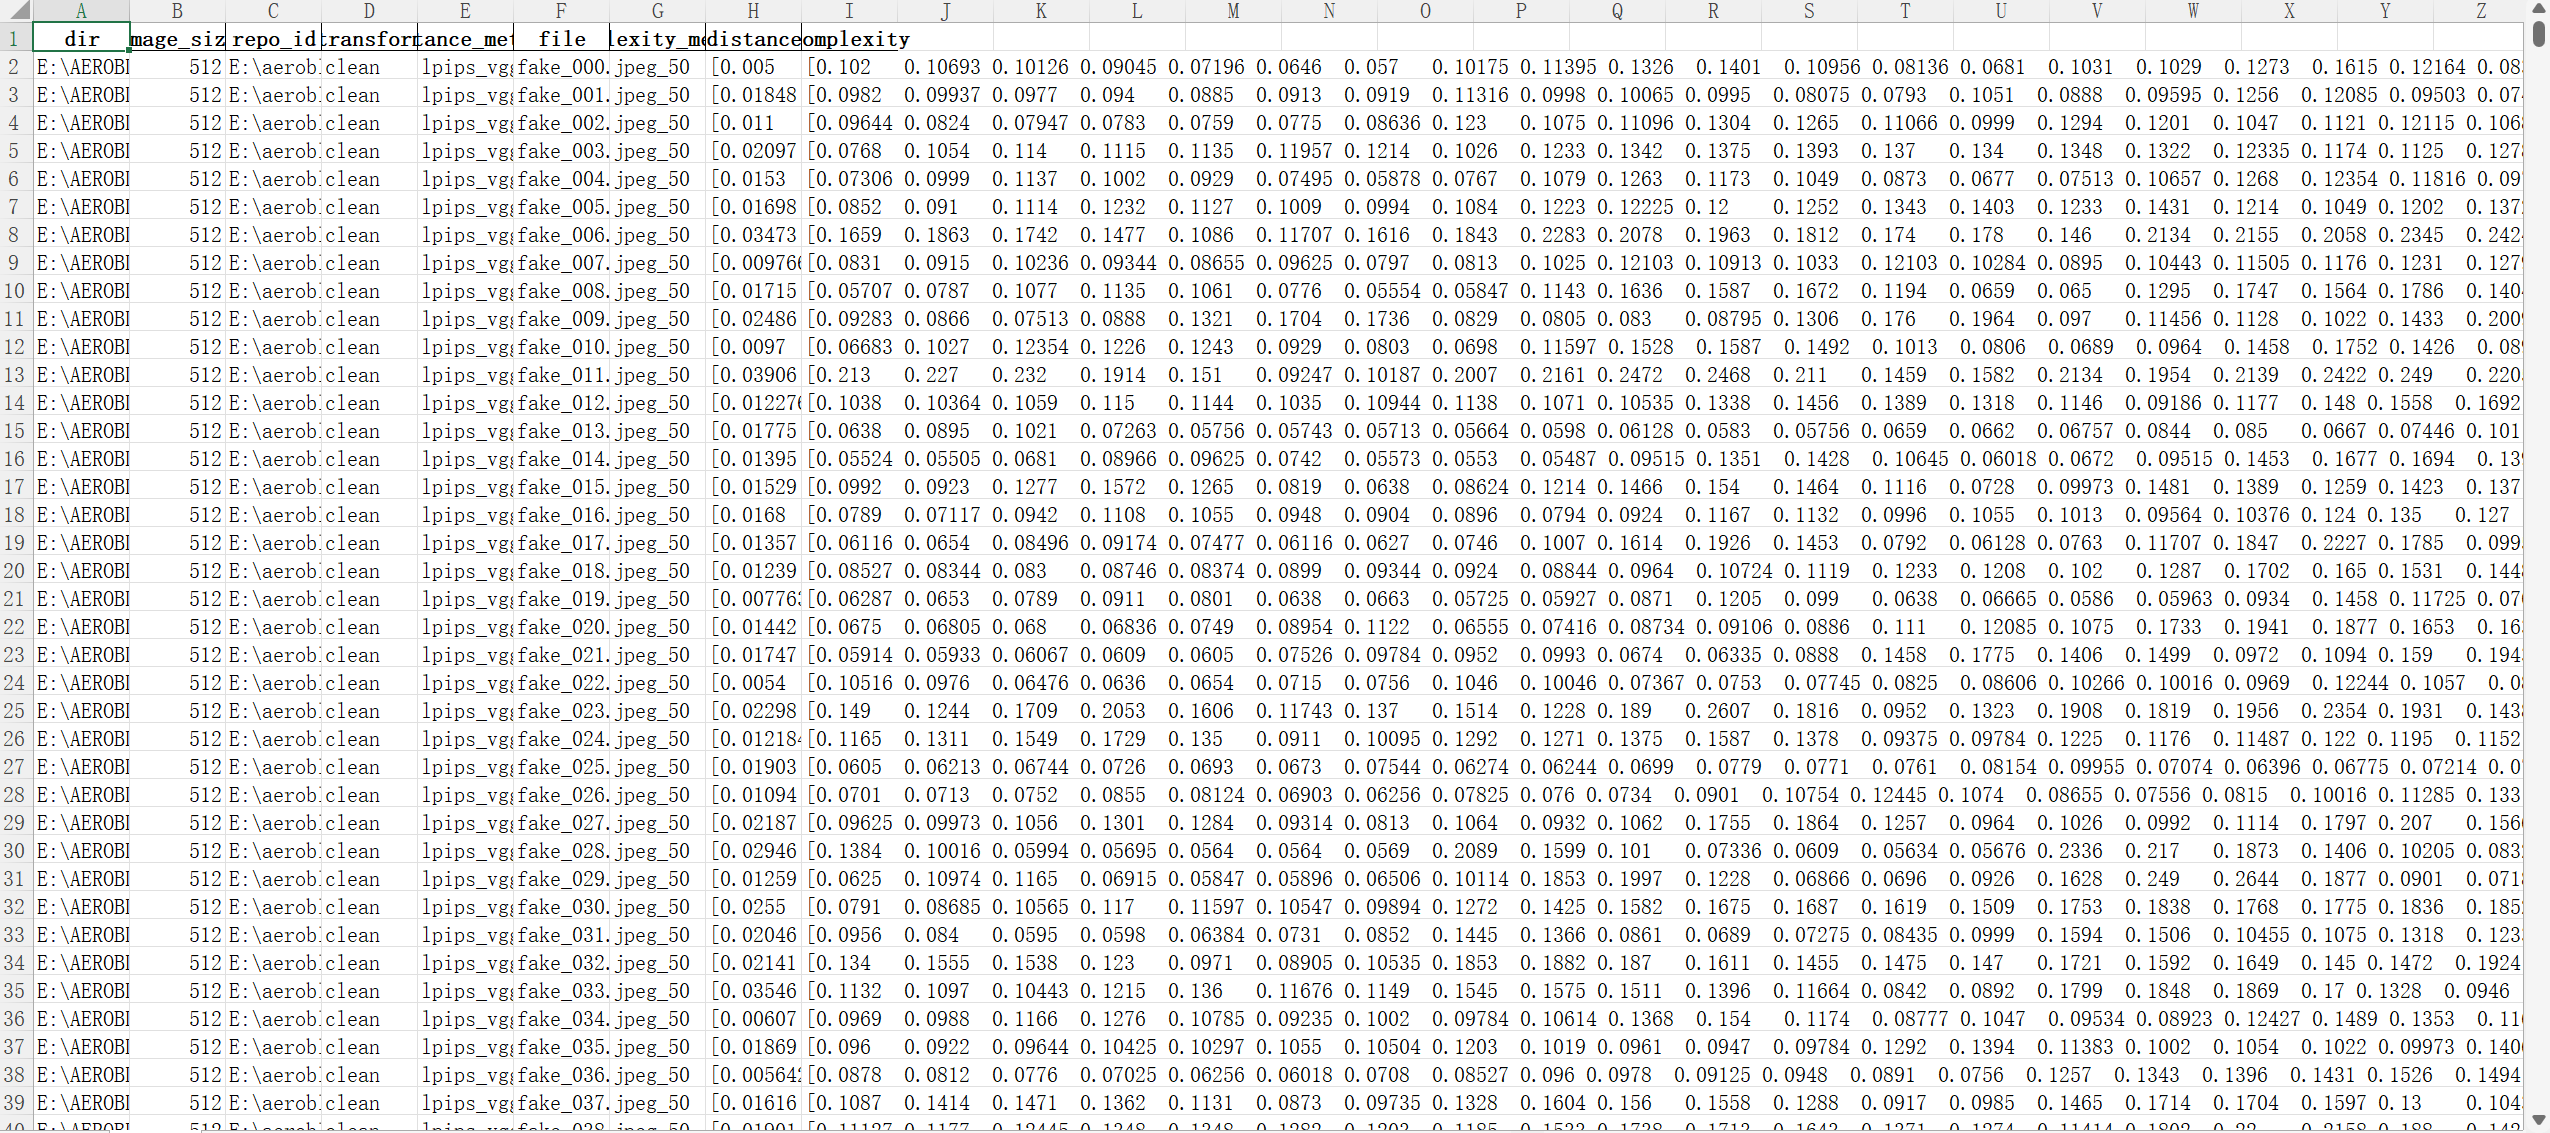
python experiments/02_analyze_patches.py --dirs "E:\AEROBLADE\data\real_rename" "E:\AEROBLADE\data\fake_rename" --num-workers 0 --batch-size 1运行这个代码,会得到一个文件"...\output\02\default\combined_dist_compl.parquet"
这个文件是个二进制文件我们读取不了,可以采用以下操作:
终端输入命令:
(aeroblade) PS E:\aeroblade-main> python
Python 3.10.19 | packaged by Anaconda, Inc. | (main, Oct 21 2025, 16:41:31) [MSC v.1929 64 bit (AMD64)] on win32
Type "help", "copyright", "credits" or "license" for more information.
>>> import pandas as pd
>>> df = pd.read_parquet("E:/aeroblade-main/output/02/default/combined_dist_compl.parquet")
>>> df.to_excel("E:/aeroblade-main/output/02/default/combined_dist_compl.xlsx", index=False)
>>> exit()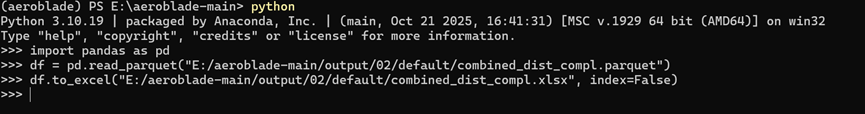
结果会被保存在"...\output\02\default\combined_dist_compl.xlsx"
但是这个数据非常庞大,我们人很难进行处理:
我通过一个辅助代码get_result02.py,帮我们得出结论:
import pandas as pd
import numpy as np
import matplotlib.pyplot as plt
import ast
from scipy.stats import pearsonr
import warnings
warnings.filterwarnings("ignore")
# --------------------------
# 1. 配置参数
# --------------------------
excel_path = r"E:\aeroblade-main\output\02\default\combined_dist_compl.xlsx"
ae_repo = r"E:\aeroblade-model3"
fake_dir = r"E:\AEROBLADE\data\fake_rename"
real_dir = r"E:\AEROBLADE\data\real_rename"
min_patches = 10
# --------------------------
# 2. 数据加载与解析(不变)
# --------------------------
def load_and_parse_excel(file_path):
    df = pd.read_excel(file_path, engine="openpyxl")
    print(f"✅ 成功读取Excel:共{len(df)}行数据,包含{len(df['file'].unique())}个图像文件")
    def parse_list_column(col):
        def process_single_value(x):
            if pd.isna(x) or not isinstance(x, str):
                return []
            x_clean = x.strip().replace("\n", "").replace("\t", "").replace("  ", " ")
            x_single_space = " ".join(x_clean.split())
            x_comma = x_single_space.replace(" ", ", ")
            try:
                return ast.literal_eval(x_comma)
            except:
                return []
        return df[col].apply(process_single_value)
    df["distance_list"] = parse_list_column("distance")
    df["complexity_list"] = parse_list_column("complexity")
    return df
# --------------------------
# 3. 提取图像数据(不变)
# --------------------------
def get_all_image_pairs(df, img_dir, ae_repo):
    mask = (df["dir"] == img_dir) & (df["repo_id"] == ae_repo)
    img_files = df[mask]["file"].unique()
    all_pairs = {}
    for img in img_files:
        img_mask = mask & (df["file"] == img)
        if df[img_mask].empty:
            continue
        complexity = df[img_mask]["complexity_list"].iloc[0]
        distance = df[img_mask]["distance_list"].iloc[0]
        pairs = np.array([(c, d) for c, d in zip(complexity, distance)
                          if not (np.isnan(c) or np.isnan(d) or c < 0 or d < 0)])
        if len(pairs) >= min_patches:
            all_pairs[img] = pairs
        else:
            print(f"⚠️ 过滤图像{img}:有效补丁数{len(pairs)} < {min_patches}(异常)")
    print(f"✅ 从{img_dir}目录筛选出{len(all_pairs)}个有效图像(AE:{ae_repo})")
    return all_pairs
# --------------------------
# 4. 计算相关性(不变)
# --------------------------
def batch_calculate_correlation(all_pairs, img_type):
    correlation_results = []
    for img_name, pairs in all_pairs.items():
        complexity = pairs[:, 0]
        distance = pairs[:, 1]
        corr_coef, p_value = pearsonr(complexity, distance)
        correlation_results.append({
            "图像类型": img_type,
            "图像文件名": img_name,
            "相关系数r": round(corr_coef, 4),
            "显著性P值": round(p_value, 6),
            "有效补丁数": len(pairs),
            "复杂度均值": round(np.mean(complexity), 4),
            "重建误差均值": round(np.mean(distance), 4)
        })
    result_df = pd.DataFrame(correlation_results)
    overall_stats = {
        "图像类型": img_type,
        "平均相关系数r": round(result_df["相关系数r"].mean(), 4),
        "相关系数标准差": round(result_df["相关系数r"].std(), 4),
        "强正相关图像数(r≥0.5)": len(result_df[result_df["相关系数r"] >= 0.5]),
        "弱相关图像数(|r|≤0.3)": len(result_df[abs(result_df["相关系数r"]) <= 0.3]),
        "有效图像总数": len(result_df)
    }
    return result_df, overall_stats
# --------------------------
# 5. 可视化优化:移除r标注+统一坐标轴
# --------------------------
def plot_all_correlation(real_pairs, fake_pairs):
    plt.rcParams['font.sans-serif'] = ['SimHei']
    plt.rcParams['axes.unicode_minus'] = False
    fig, (ax1, ax2) = plt.subplots(1, 2, figsize=(14, 6), sharex=True, sharey=True)  # 统一坐标轴
    # 统一横纵坐标范围
    all_complexity = []
    all_distance = []
    for pairs in list(real_pairs.values()) + list(fake_pairs.values()):
        all_complexity.extend(pairs[:, 0])
        all_distance.extend(pairs[:, 1])
    x_min, x_max = np.min(all_complexity) * 0.9, np.max(all_complexity) * 1.1
    y_min, y_max = np.min(all_distance) * 0.9, np.max(all_distance) * 1.1
    # 子图1:真实图(移除r标注)
    ax1.set_title("所有真实图:局部复杂度 vs 重建误差(非匹配AE)", fontsize=12, fontweight="bold")
    ax1.set_xlabel("局部复杂度(JPEG50)", fontsize=10)
    ax1.set_ylabel("重建误差(LPIPS)", fontsize=10)
    ax1.set_xlim(x_min, x_max)
    ax1.set_ylim(y_min, y_max)
    real_all_points = np.vstack(list(real_pairs.values()))
    ax1.scatter(real_all_points[:, 0], real_all_points[:, 1],
                alpha=0.6, color="#1f77b4", s=20, label="真实图")  # 仅保留“真实图”标注
    ax1.legend(fontsize=9)
    ax1.grid(alpha=0.3, linestyle="--")
    # 子图2:伪造图(移除r标注)
    ax2.set_title("所有伪造图:局部复杂度 vs 重建误差(非匹配AE)", fontsize=12, fontweight="bold")
    ax2.set_xlabel("局部复杂度(JPEG50)", fontsize=10)
    ax2.set_xlim(x_min, x_max)
    ax2.set_ylim(y_min, y_max)
    fake_all_points = np.vstack(list(fake_pairs.values()))
    ax2.scatter(fake_all_points[:, 0], fake_all_points[:, 1],
                alpha=0.6, color="#ff7f0e", s=20, label="伪造图")  # 仅保留“伪造图”标注
    ax2.legend(fontsize=9)
    ax2.grid(alpha=0.3, linestyle="--")
    plt.tight_layout()
    plt.savefig("all_images_correlation_clean.png", dpi=300, bbox_inches="tight", facecolor="white")
    plt.show()
    print("\n 优化后可视化图表已保存为:all_images_correlation_clean.png")
# --------------------------
# 6. 主函数(不变)
# --------------------------
def main():
    df = load_and_parse_excel(excel_path)
    print("\n" + "="*50)
    print("开始提取图像数据...")
    real_all_pairs = get_all_image_pairs(df, real_dir, ae_repo)
    fake_all_pairs = get_all_image_pairs(df, fake_dir, ae_repo)
    print("\n" + "="*50)
    print("开始计算所有图像的相关性...")
    real_result_df, real_stats = batch_calculate_correlation(real_all_pairs, "真实图")
    fake_result_df, fake_stats = batch_calculate_correlation(fake_all_pairs, "伪造图")
    print("\n" + "="*80)
    print(" 所有图像相关性分析汇总(非匹配AE:KD2.1)")
    print("="*80)
    print("\n【真实图整体统计】")
    for key, val in real_stats.items():
        print(f"  {key}: {val}")
    print("\n【伪造图整体统计】")
    for key, val in fake_stats.items():
        print(f"  {key}: {val}")
    all_result_df = pd.concat([real_result_df, fake_result_df], ignore_index=True)
    all_result_df.to_excel("all_images_correlation_results.xlsx", index=False, engine="openpyxl")
    print(f"\n 完整结果已保存到:all_images_correlation_results.xlsx")
    if len(real_all_pairs) > 0 and len(fake_all_pairs) > 0:
        plot_all_correlation(real_all_pairs, fake_all_pairs)
    else:
        print("\n⚠️ 无法生成可视化:真实图或伪造图数量为0")
if __name__ == "__main__":
    main()
这个代码对生成图像和真实图像的复杂度和对应的重建误差进行了聚合,生成散点图
运行指令(直接运行即可):
python get_result02.py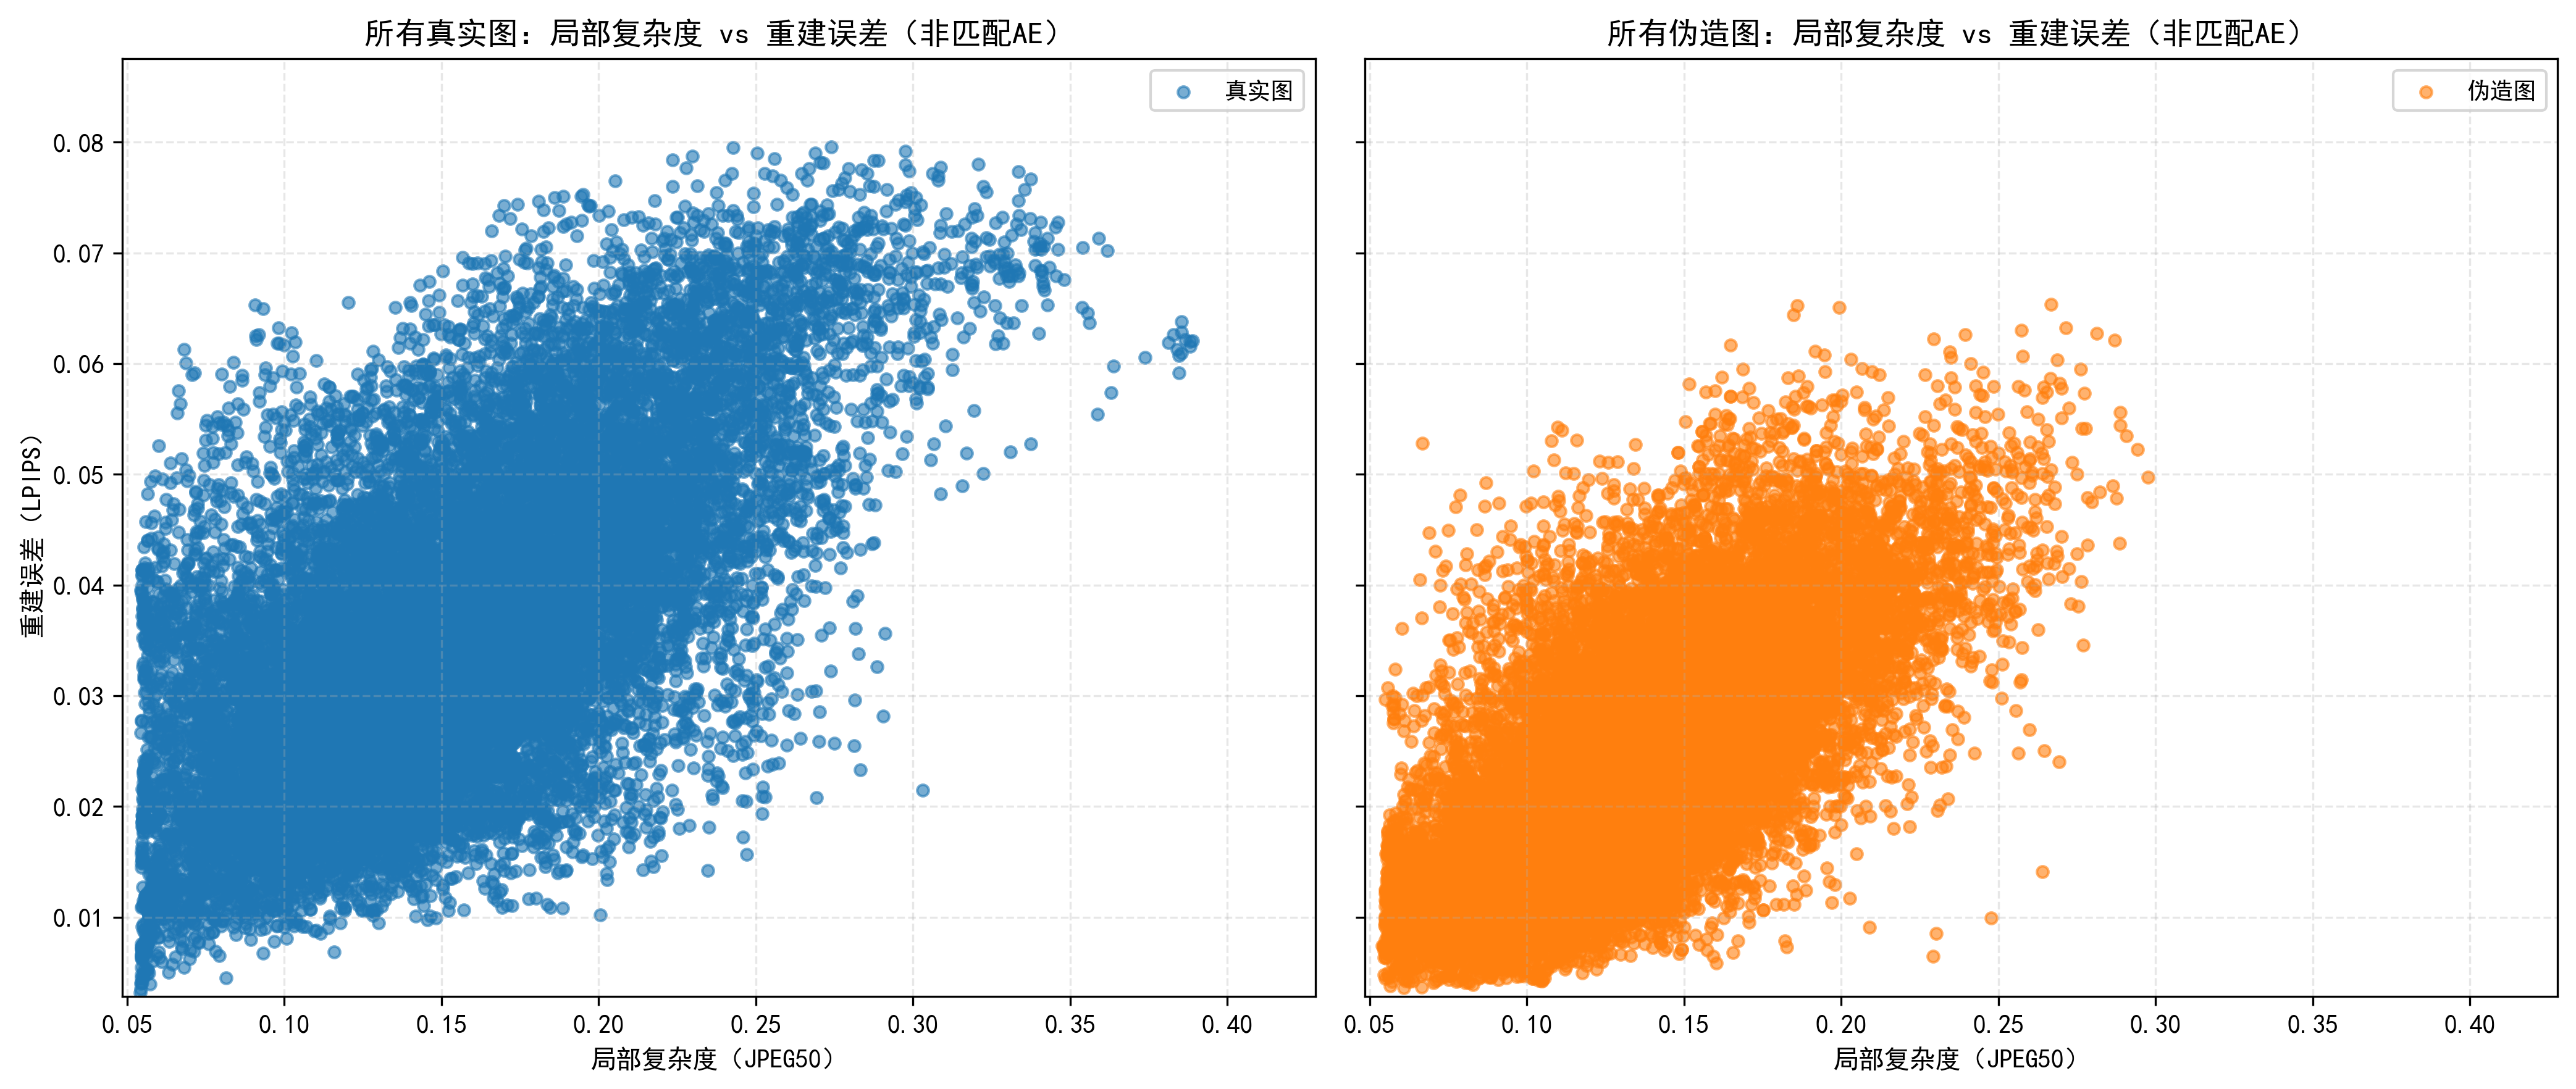
结果如上,有一点是符合原文提到的,真实图像的复杂度可以达到更高
但是原文有一个结论是真实图像的重建误差与复杂度相关性强,生成图像则不。我们这里运行的结果似乎不能明显作证这个结论(猜测有一个很重要的原因就是我们最开始提到了生成图像右下角的文字部分,这部分复杂度高且重建误差确实较大,导致我们的生成图像也像真实图像一样呈现出了重建误差对复杂度的相关性)
2.鲁棒性分析:
python experiments/01_detect.py --experiment-id robustness --transforms clean jpeg_90 jpeg_80 jpeg_70 jpeg_60 jpeg_50 blur_1.0 blur_2.0 blur_3.0 blur_4.0 blur_5.0 crop_0.9 crop_0.8 crop_0.7 crop_0.6 crop_0.5 noise_0.05 noise_0.1 noise_0.15 noise_0.2 noise_0.25 --repo-ids "E:\aeroblade-model3" --real-dir "E:\AEROBLADE\data\real_rename" --fake-dirs "E:\AEROBLADE\data\fake_rename" --num-workers 0 --batch-size 1这里我通过这个指令进行分析(为了减少时间开销我只选择了model3,其实如果正常运行可能需要选择max的结果)
这个同样会生成一个excel表格,我们读取存在一定难度,依旧通过代码来分析:
编写一个robustness_analysis.py代码:
import pandas as pd
import numpy as np
import matplotlib.pyplot as plt
import re
from collections import defaultdict
import os
def setup_plot_style():
    """Set plot style (English font, no Chinese)"""
    plt.rcParams['font.sans-serif'] = ['Arial', 'Helvetica', 'DejaVu Sans']
    plt.rcParams['axes.unicode_minus'] = False
    plt.rcParams['figure.figsize'] = (15, 12)
    plt.rcParams['font.size'] = 10
    plt.rcParams['lines.linewidth'] = 3  # 加粗曲线
    plt.rcParams['lines.markersize'] = 8  # 加大标记
def process_robustness_data(file_path, target_metric='lpips_vgg_-1'):
    """
    Process data with YOUR disturbance types/orders, set clean as first point for each category
    """
    # Read data
    df_original = pd.read_csv(file_path)
    print(f"Successfully read data: {df_original.shape[0]} rows, {df_original.shape[1]} columns")
    # Check target metric exists
    available_metrics = df_original['distance_metric'].unique()
    if target_metric not in available_metrics:
        raise ValueError(f"Target metric '{target_metric}' not found! Available metrics: {', '.join(available_metrics)}")
    print(f"Using fixed distance metric: {target_metric} (LPIPS)")
    # -------------------------- 按你的扰动类型和顺序定义 --------------------------
    disturbance_config = {
        'JPEG Compression': {
            'disturbances': ['jpeg_90', 'jpeg_80', 'jpeg_70', 'jpeg_60', 'jpeg_50'],
            'x_labels': ['w/o', '90', '80', '70', '60', '50']
        },
        'Gaussian Blur': {
            'disturbances': ['blur_1.0', 'blur_2.0', 'blur_3.0', 'blur_4.0', 'blur_5.0'],
            'x_labels': ['w/o', '1.0', '2.0', '3.0', '4.0', '5.0']
        },
        'Image Cropping': {
            'disturbances': ['crop_0.9', 'crop_0.8', 'crop_0.7', 'crop_0.6', 'crop_0.5'],
            'x_labels': ['w/o', '0.9', '0.8', '0.7', '0.6', '0.5']
        },
        'Gaussian Noise': {
            'disturbances': ['noise_0.05', 'noise_0.1', 'noise_0.15', 'noise_0.2', 'noise_0.25'],
            'x_labels': ['w/o', '0.05', '0.1', '0.15', '0.2', '0.25']
        }
    }
    # ----------------------------------------------------------------------------------
    # Get clean data (LPIPS metric)
    clean_data = df_original[
        (df_original['transform'] == 'clean') &
        (df_original['distance_metric'] == target_metric)
    ].copy()
    if len(clean_data) == 0:
        raise ValueError("No clean data found for LPIPS metric!")
    clean_ap = clean_data['ap'].mean()  # clean的LPIPS AP值(所有子图的首点)
    print(f"Clean (baseline) LPIPS AP: {clean_ap:.4f}")
    # Process each disturbance category
    lpips_performance = {}
    for category, config in disturbance_config.items():
        disturbances = config['disturbances']
        x_labels = config['x_labels']
        category_results = []
        # 1. 第一个点:clean数据(固定作为首点)
        category_results.append({
            'transform': 'clean',
            'intensity': 0.0,
            'x_label': x_labels[0],  # 'w/o'
            'ap': clean_ap,
            'data_count': len(clean_data)
        })
        # 2. 后续点:对应扰动的LPIPS数据(按你的顺序)
        for idx, disturbance in enumerate(disturbances):
            # 筛选当前扰动+LPIPS的数据
            dist_data = df_original[
                (df_original['transform'] == disturbance) &
                (df_original['distance_metric'] == target_metric)
            ].copy()
            if len(dist_data) == 0:
                print(f"Warning: No LPIPS data for {category} - {disturbance}, using NaN")
                ap_val = np.nan
                data_count = 0
            else:
                ap_val = dist_data['ap'].mean()  # 多个条目取平均
                data_count = len(dist_data)
            category_results.append({
                'transform': disturbance,
                'intensity': float(re.findall(r'\d+\.?\d*', disturbance)[0]),  # 提取强度数值
                'x_label': x_labels[idx+1],  # 对应x标签(跳过首标签'w/o')
                'ap': ap_val,
                'data_count': data_count
            })
        # 转换为DataFrame并保存
        df_category = pd.DataFrame(category_results)
        lpips_performance[category] = df_category
    # Print detailed summary
    print("\n=== LPIPS Performance Summary (Each category starts with clean) ===")
    for category, df in lpips_performance.items():
        print(f"\n{category}:")
        print(f"  X-axis labels: {', '.join(df['x_label'].tolist())}")
        print(f"  AP values: {[f'{val:.3f}' if not np.isnan(val) else 'NaN' for val in df['ap'].tolist()]}")
    return lpips_performance, df_original
def plot_robustness_curves(lpips_performance, save_path='.', target_metric='lpips_vgg_-1'):
    """
    Plot AP curves: clean as first point, unified y-axis, no baseline line (fixed Matplotlib compatibility)
    """
    print(f"\nResults will be saved to: {os.path.abspath(save_path)}")
    # Configuration
    UNIFIED_AP_YLIM = [0.5, 1.0]  # 统一纵坐标范围(可根据你的数据调整)
    colors = ['#2E86AB', '#A23B72', '#F18F01', '#C73E1D']  # 四个子图的颜色
    markers = ['o', 's', '^', 'D']  # 四个子图的标记
    categories = ['JPEG Compression', 'Gaussian Blur', 'Image Cropping', 'Gaussian Noise']
    # Create 2x2 subplots
    fig, axes = plt.subplots(2, 2, figsize=(16, 12))  # 略微放大画布
    axes = axes.flatten()
    for idx, category in enumerate(categories):
        ax = axes[idx]
        df = lpips_performance[category]
        # Prepare data (过滤NaN值,避免绘图错误)
        x_positions = np.arange(len(df))
        y_data = df['ap'].values
        valid_mask = ~np.isnan(y_data)
        valid_x = x_positions[valid_mask]
        valid_y = y_data[valid_mask]
        valid_labels = df['x_label'].values[valid_mask]
        # 修复:删除 markersevery=1(低版本Matplotlib不支持)
        ax.plot(valid_x, valid_y, color=colors[idx], marker=markers[idx],
               alpha=0.9, linewidth=3, markersize=10)
        # Set plot properties
        ax.set_title(f'Robustness to {category}\n(LPIPS - AP Metric, Higher is Better)',
                    fontsize=13, fontweight='bold', pad=25)
        ax.set_xlabel('Disturbance Level', fontsize=12, fontweight='bold')
        ax.set_ylabel('AP Score', fontsize=12, fontweight='bold')
        # X-axis: 显示所有标签(包括clean的'w/o')
        ax.set_xticks(x_positions)
        ax.set_xticklabels(df['x_label'], fontsize=11)
        # Unified y-axis (关键:四个子图完全一致)
        ax.set_ylim(UNIFIED_AP_YLIM)
        ax.set_yticks(np.linspace(UNIFIED_AP_YLIM[0], UNIFIED_AP_YLIM[1], 6))
        ax.tick_params(axis='y', labelsize=11)
        # Add grid and legend
        ax.grid(True, alpha=0.3, linestyle='-', linewidth=1)
        ax.legend([category], loc='best', framealpha=0.9, fontsize=11)
        # Add value labels (仅显示有效数据)
        for x, y, label in zip(valid_x, valid_y, valid_labels):
            ax.annotate(f'{y:.3f}', (x, y), textcoords="offset points",
                       xytext=(0, 15), ha='center', fontsize=10, fontweight='bold',
                       bbox=dict(boxstyle='round,pad=0.4', facecolor='white', alpha=0.8))
    # Adjust layout to avoid overlap
    plt.tight_layout(pad=4.0)
    curve_file = os.path.join(save_path, 'lpips_robustness_ap_curves_final.png')
    plt.savefig(curve_file, dpi=300, bbox_inches='tight', facecolor='white')
    plt.close()
    print(f"Final LPIPS AP curves saved to: {os.path.abspath(curve_file)}")
    return curve_file
def generate_summary_report(lpips_performance, df_original, save_path='.', target_metric='lpips_vgg_-1'):
    """Generate summary report (matches your disturbance config)"""
    # Flatten results
    all_results = []
    for category, df in lpips_performance.items():
        for _, row in df.iterrows():
            all_results.append({
                'category': category,
                'transform': row['transform'],
                'disturbance_level': row['x_label'],
                'intensity': row['intensity'],
                'distance_metric': target_metric,
                'ap': row['ap'],
                'data_count': row['data_count']
            })
    # Save CSV summary
    summary_df = pd.DataFrame(all_results)
    summary_file = os.path.join(save_path, 'lpips_robustness_summary_final.csv')
    summary_df.to_csv(summary_file, index=False, encoding='utf-8-sig')
    # Generate report content
    clean_ap = next(iter(lpips_performance.values()))['ap'].iloc[0]  # 第一个子图的首点(clean AP)
    report_content = f"""# LPIPS Metric Robustness Analysis Report (Final Version)
## 1. Data Overview
- **Data Source**: detection_results.csv
- **Data Scale**: {df_original.shape[0]} rows, {df_original.shape[1]} columns
- **Fixed Distance Metric**: {target_metric} (LPIPS)
- **Evaluation Metric**: AP (Average Precision)
- **Analysis Time**: {pd.Timestamp.now().strftime('%Y-%m-%d %H:%M:%S')}
## 2. Disturbance Configuration (Matched Your Input)
Each category starts with 'w/o' (clean baseline) followed by your specified disturbance levels:
| Category | Disturbance Levels (Order) |
|----------|-----------------------------|
| JPEG Compression | w/o → 90 → 80 → 70 → 60 → 50 |
| Gaussian Blur | w/o → 1.0 → 2.0 → 3.0 → 4.0 → 5.0 |
| Image Cropping | w/o → 0.9 → 0.8 → 0.7 → 0.6 → 0.5 |
| Gaussian Noise | w/o → 0.05 → 0.1 → 0.15 → 0.2 → 0.25 |
## 3. Baseline Performance (Clean Data)
- **LPIPS AP Score**: {clean_ap:.4f}
## 4. Key Findings
### 4.1 Robustness Trends
- All curves start with the same clean baseline (w/o disturbance) for fair comparison;
- Lower AP values indicate poorer robustness to the disturbance;
- The steeper the curve decline, the more sensitive the model to that disturbance type.
### 4.2 Per-Category Average AP (Excluding Baseline)
"""
    # Calculate average AP for each category (excluding clean)
    for category, df in lpips_performance.items():
        non_clean_ap = df[df['transform'] != 'clean']['ap'].dropna()
        if len(non_clean_ap) > 0:
            avg_ap = non_clean_ap.mean()
            report_content += f"- **{category}**: Average AP = {avg_ap:.4f} ({(avg_ap/clean_ap - 1)*100:.1f}% vs baseline)\n"
        else:
            report_content += f"- **{category}**: Insufficient valid data\n"
    report_content += f"""
## 5. Output Files
- Final LPIPS AP Curves: lpips_robustness_ap_curves_final.png
- Performance Summary CSV: lpips_robustness_summary_final.csv
- Analysis Report: lpips_robustness_report_final.md
"""
    # Save report
    report_file = os.path.join(save_path, 'lpips_robustness_report_final.md')
    with open(report_file, 'w', encoding='utf-8') as f:
        f.write(report_content)
    print(f"\nFinal report saved to: {os.path.abspath(report_file)}")
    print(f"Final summary CSV saved to: {os.path.abspath(summary_file)}")
    return summary_df, report_file
def main(file_path, target_metric='lpips_vgg_2'):
    """Main function: Final version of LPIPS robustness analysis"""
    setup_plot_style()
    # 1. Data processing (match your disturbance config)
    lpips_performance, df_original = process_robustness_data(file_path, target_metric)
    # 2. Plot final AP curves
    curve_file = plot_robustness_curves(lpips_performance, target_metric=target_metric)
    # 3. Generate final report
    summary_df, report_file = generate_summary_report(lpips_performance, df_original, target_metric=target_metric)
    # 4. Completion message
    print("\n=== Final LPIPS Robustness Analysis Completed ===")
    print("Generated Files:")
    print(f"1. {os.path.basename(curve_file)}")
    print(f"2. {os.path.basename(report_file)}")
    print(f"3. lpips_robustness_summary_final.csv")
    return lpips_performance, summary_df
# Execution entry
if __name__ == "__main__":
    # Replace with your CSV file path
    data_file_path = r"E:\aeroblade-main\output\01\robustness\detection_results.csv"
    # Modify this if your LPIPS metric name is different (e.g., 'lpips_vgg_2')
    target_lpips_metric = 'lpips_vgg_2'
    if os.path.exists(data_file_path):
        lpips_performance, summary_df = main(data_file_path, target_metric=target_lpips_metric)
    else:
        print(f"Error: File '{data_file_path}' not found!")
        print("Please check the file path or place the CSV in the current directory.")
这个代码也直接运行
python robustness_analysis.py得到的结果: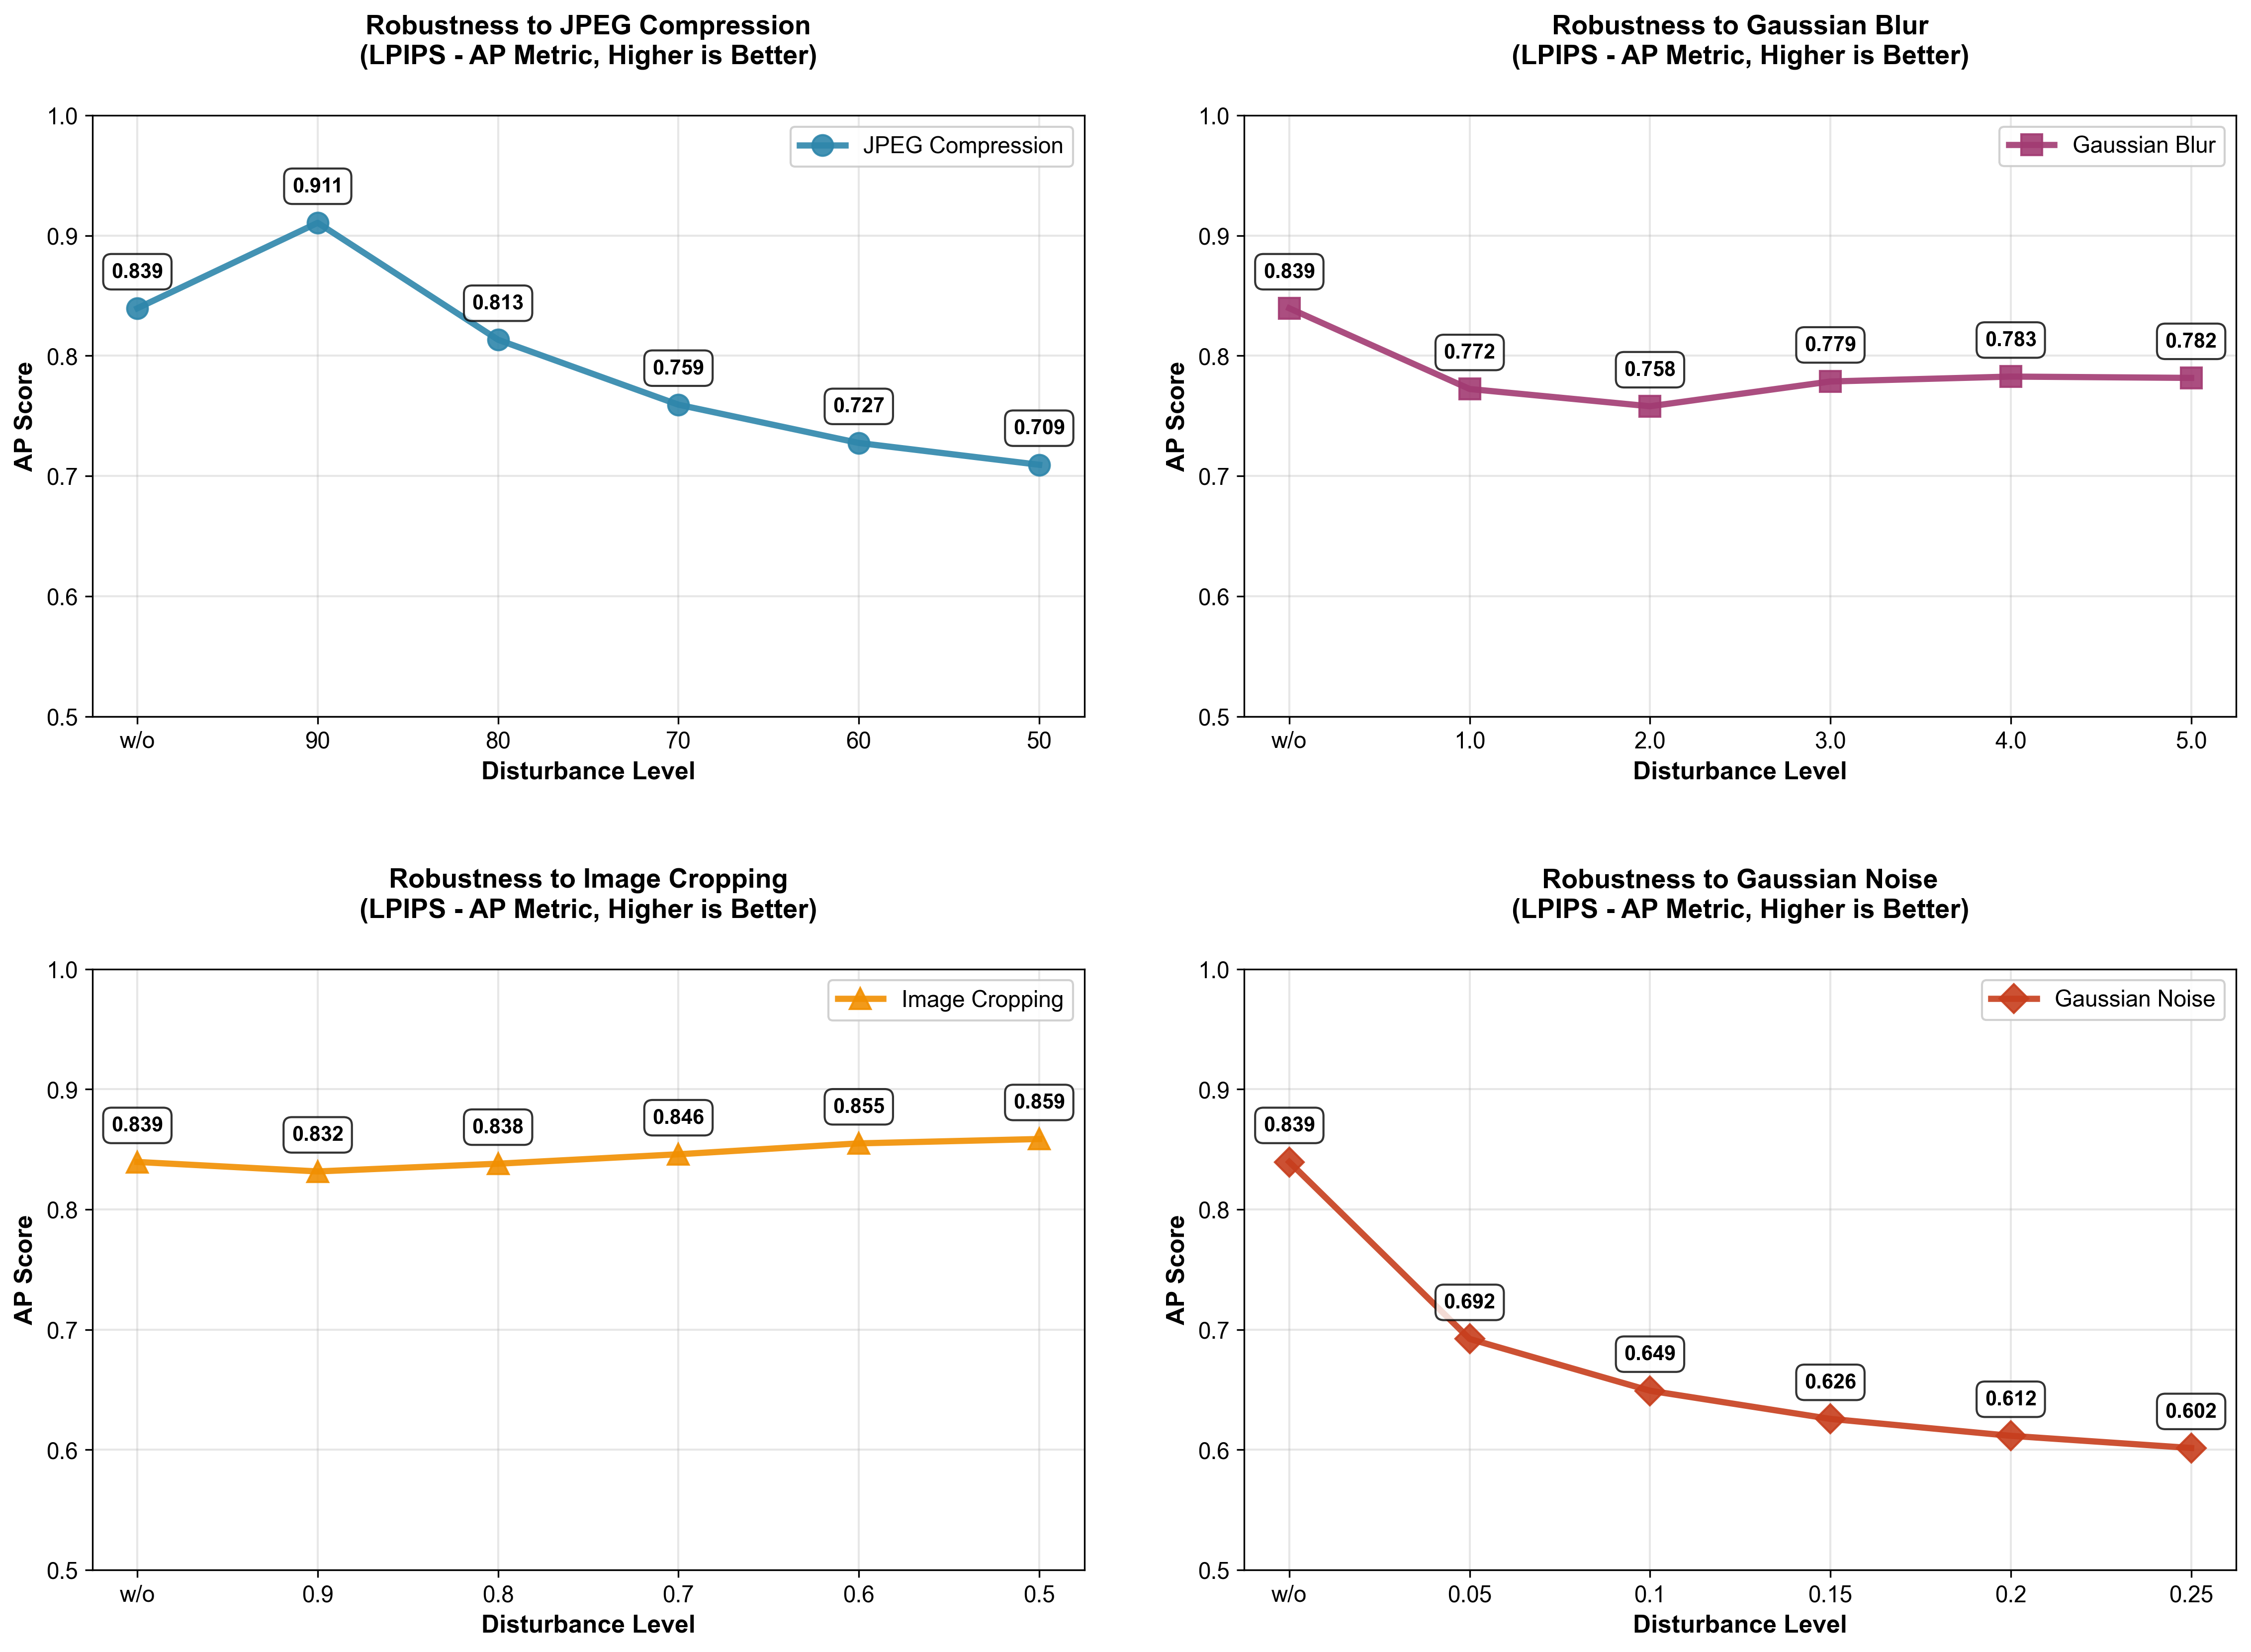
可以发现鲁棒性还是比较好的,尽管存在大幅度下降的情况(这与模型不需要训练存在关系)最差情况准确率还能维持在0.6以上(不过这里存在一个我疑惑的点:采用JPEG90的情况竟然比clean要好???)
3.更深层重建:
这部分我没有选择做
总结复现时存在的实验缺陷:
1.数据集来源过于单一
2.数据集虽然有400,但是可能更大一点可以消除一些“巧合”
3.数据集存在一个比较大的缺陷(生成存在文字部分,导致有一部分真实图像的性质,这会影响实验结果)

 浙公网安备 33010602011771号