
Python大连房价信息爬取与可视化
一、摘要:
本项目应用Python网络爬虫技术,通过爬取贝壳网的房价信息通过可视化查看各个区域每个时间段的房价信息。二、选题背景:
  在现在经济生活中,房地产市场成为金融、建筑和股市等经济板块发展的重要推动力,其产业的兴衰影响着国民经济的发展状态,商品房价格是房地产市场的最重要和最直接的反映,是商品房价值的货币表现.
在我国目前这个特定的紧急发展阶段,商品房市场作为城市经济体系的一个重要组成部分,其发展演变在很大程度上取决与城市的经济状况、城市的发展目标以及城市的相关政策和管制措施.
我国的住房问题更多的是与其他大量微观的和宏观的经济和社会问题联系在一起.因此,我国经济高速发展、农村剩余劳动力向城市快速转移、住房产业逐步成为城市经济支柱产业的背景下发展。
三、数据说明:
爬取贝壳网房价数据和房屋户型信息,对房价信息进行动态可视化,并对户型信息进行词云绘制。
四、实施过程及代码:
导入库
1 import requests
2 import random
3 import time
4 from bs4 import BeautifulSoup
5 import openpyxl
6 from openpyxl import load_workbook
7 from openpyxl import Workbook
8 import matplotlib.pyplot as plt
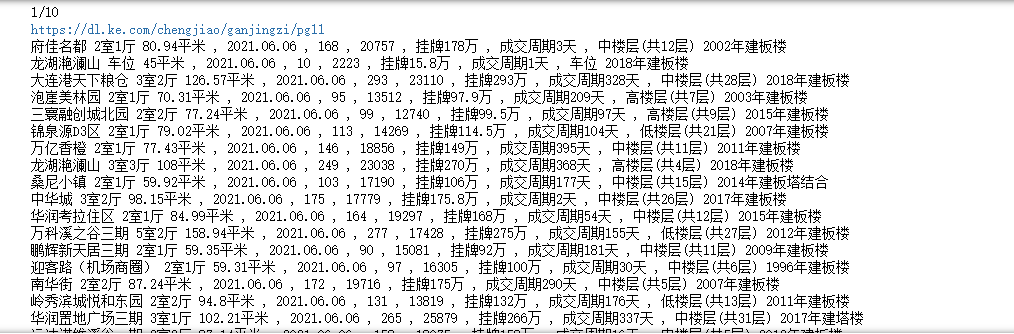
构造爬虫程序,下面演示了爬取甘井子地区前九页房价信息的爬虫,剩下区域可根据相同方法爬取
 1 user_agent_list = [
 2     "Mozilla/5.0 (Windows NT 6.1; WOW64) AppleWebKit/537.1 (KHTML, like Gecko) Chrome/22.0.1207.1 Safari/537.1",
 3     "Mozilla/5.0 (X11; CrOS i686 2268.111.0) AppleWebKit/536.11 (KHTML, like Gecko) Chrome/20.0.1132.57 Safari/536.11",
 4     "Mozilla/5.0 (Windows NT 6.1; WOW64) AppleWebKit/536.6 (KHTML, like Gecko) Chrome/20.0.1092.0 Safari/536.6",
 5     "Mozilla/5.0 (Windows NT 6.2) AppleWebKit/536.6 (KHTML, like Gecko) Chrome/20.0.1090.0 Safari/536.6",
 6     "Mozilla/5.0 (Windows NT 6.2; WOW64) AppleWebKit/537.1 (KHTML, like Gecko) Chrome/19.77.34.5 Safari/537.1",
 7     "Mozilla/5.0 (X11; Linux x86_64) AppleWebKit/536.5 (KHTML, like Gecko) Chrome/19.0.1084.9 Safari/536.5",
 8     "Mozilla/5.0 (Windows NT 6.0) AppleWebKit/536.5 (KHTML, like Gecko) Chrome/19.0.1084.36 Safari/536.5",
 9     "Mozilla/5.0 (Windows NT 6.1; WOW64) AppleWebKit/536.3 (KHTML, like Gecko) Chrome/19.0.1063.0 Safari/536.3"
10 ]#伪装电脑
11 UA = random.choice(user_agent_list)  ##从self.user_agent_list中随机取出一个字符串
12 headers = {'User-Agent': UA}  ##构造成一个完整的User-Agent (UA代表的是上面随机取出来的字符串哦)
13 name = 'ganjingzi'#区域名拼写
14 url = 'https://dl.ke.com/chengjiao/{}/pg'.format(name)#构造URL
15 all_message = []#用于存放所有爬取的信息
16 for x in range(1,10):#页数
17     print('{}/10'.format(x))
18
19     time.sleep(random.randint(2,5))
20     print(url+str(x)+str(x))
21
22     with requests.get(url+str(x), headers=headers, timeout=5) as response:
23
24         soup = BeautifulSoup(response.text, 'lxml')
25
26         # print(soup.title.text)  # 打印title
27
28         li_list = soup.find('ul', class_='listContent').find_all('li')
29         # print(li_list)
30         for li_quick in li_list:
31
32             try:
33                 #取成交日期
34                 dealDate=li_quick.find('div',class_='dealDate').get_text().strip()
35                 #取名称
36                 title=li_quick.find('div',class_='title').a.get_text().strip()
37                 #取总价
38                 totalPrice=li_quick.find('div',class_='totalPrice').find('span',class_='number').get_text().strip()
39                 #取单价
40                 unitPrice=li_quick.find('div',class_='unitPrice').find('span',class_='number').get_text().strip()
41                 #取位置信息
42                 positionInfo=li_quick.find('div',class_='positionInfo').get_text().strip()
43                 #取成交周期
44                 dealCycleTxt0=li_quick.find('div',class_='dealCycleeInfo').find('span',class_='dealCycleTxt').find_all('span')[0].get_text().strip()
45                 #取挂牌价格
46                 dealCycleTxt1=li_quick.find('div',class_='dealCycleeInfo').find('span',class_='dealCycleTxt').find_all('span')[1].get_text().strip()
47                 all_message.append([title,dealDate,totalPrice,unitPrice,dealCycleTxt0,dealCycleTxt1,positionInfo])
48             except:
49                 continue
50             finally:
51                 print(title,',',dealDate,',',totalPrice,',',unitPrice,',',dealCycleTxt0,',',dealCycleTxt1,',',positionInfo)
保存爬取到的房价信息,将各个区域的数据都按照此方法爬取并保存
1 wb3 = Workbook()
2 sheet3 = wb3.active
3 for i in range(len(all_message)):
4     sheet3.append(all_message[i])
5 wb3.save(r'D:\program\黑龙江房价\{}.xlsx'.format(name))
导入数据统计和可视化用到的库
 1 import collections
 2 from pyecharts import options as opts
 3 # from pyecharts import options as opts
 4 from pyecharts.charts import Bar, Page, Pie, Timeline
 5 from random import randrange
 6 import openpyxl
 7 from openpyxl import load_workbook
 8 from openpyxl import Workbook
 9 from collections import Counter
10 import random
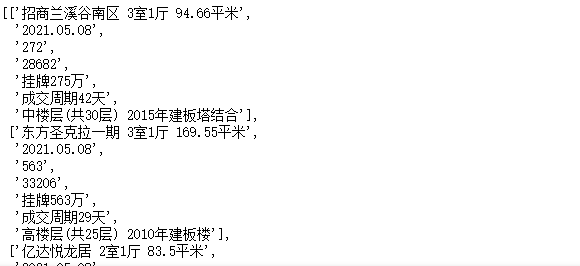
读取爬取的数据,将数据根据日期进行排序并去重
 1 def data_s(name):
 2     all_message = []
 3     wb3 = load_workbook(r'D:\program\黑龙江房价\{}.xlsx'.format(name))
 4     sheet3 = wb3.get_sheet_by_name('Sheet')
 5     rows = sheet3.max_row
 6     columns = sheet3.max_column
 7     for x in range(1,rows+1):
 8         tem = []
 9         for y in range(1,columns+1):
10             tem.append(sheet3.cell(x,y).value)
11         all_message.append(tem)
12
13     # print(all_message)
14     sorted(all_message,key=(lambda x:x[1]))#根据日期排序
15     # print(all_message)
16     final = []
17     for i in all_message:#数据清洗,去重
18         if i not in final:
19             final.append(i)
20     wb4 = Workbook()
21     sheet4 = wb4.active
22     for i in range(len(final)):
23         sheet4.append(final[i])
24     wb4.save(r'D:\program\黑龙江房价\{}_final.xlsx'.format(name))
25     return final
1 data_s('高新园区')#显示高新园区排序和清洗后的数据

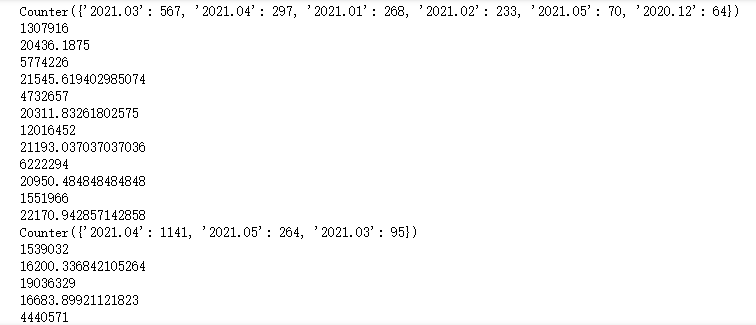
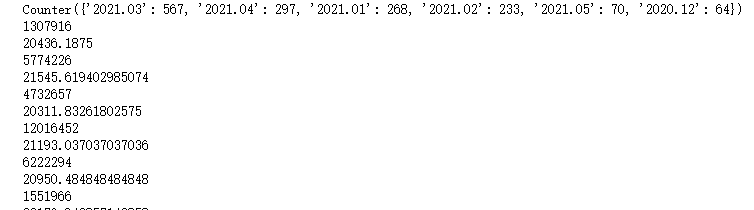
构造统计函数,对处理后的数据进行统计,以便画图
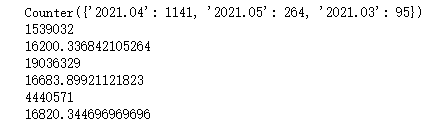
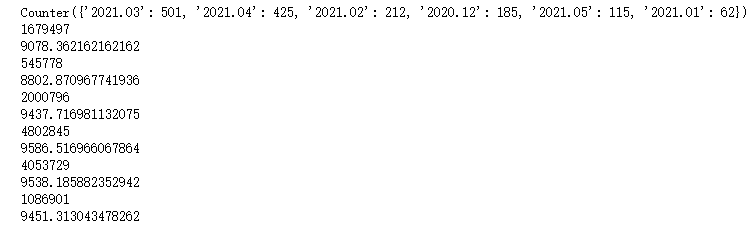
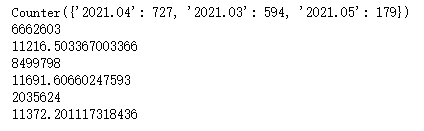
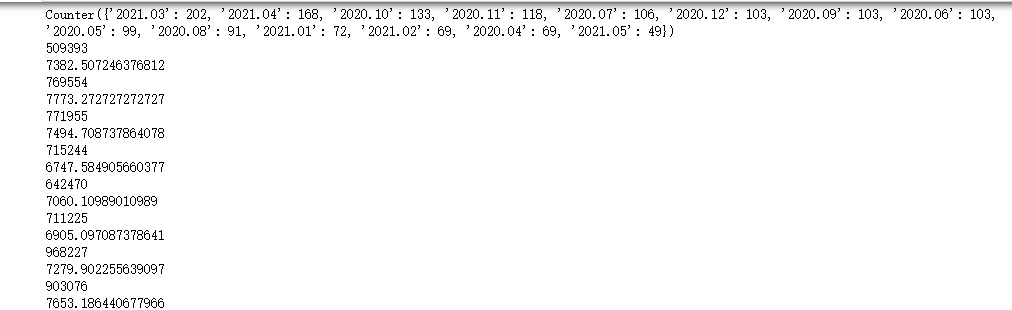
 1 def get_xy(name):#duza
 2     gx = data_s(name)
 3     date = []
 4     for i in gx:
 5         # print(i)
 6         date.append(i[1][:7])
 7     # print(date)
 8     values_counts = Counter(date)
 9 #     print(values_counts)
10 #     print(len(values_counts))
11     sorted(values_counts.keys())
12     print(values_counts)
13     x = []
14     y = []
15     for i in values_counts:
16         x.append(i)
17     x.sort()
18     for i in x:
19         sum = 0
20         for each in gx:
21             if i in each[1]:
22                 sum+=int(each[3])
23         print(sum)
24         print(sum/values_counts[i])
25         y.append(int(sum/values_counts[i]))
26     return x,y
画各个区域每平方房价变化的动态柱状图
 1 city = ['高新园区','甘井子','金州','开发区','旅顺口','沙河口','普兰店','瓦房店','西岗','中山']
 2 # city = ['高新园区']
 3 # x,y = get_xy('gaoxinyuanqu')
 4 corlo = ['blue','red','purple','green','pink','orange','scarlet']
 5 def timeline_bar() -> Timeline:
 6     # x = ['2020.12', '2021.01', '2021.02', '2021.03', '2021.04', '2021.05']
 7     tl = Timeline()
 8     for i in city:
 9         a,y = get_xy(i)
10         x = a
11         bar = Bar()
12         bar.add_xaxis(x)
13         bar.add_yaxis(' ',y)
14         bar.set_global_opts(title_opts=opts.TitleOpts("大连{}平均房价走势图".format(i)))
15         tl.add(bar, "{}".format(i))
16     tl.render(r'D:\program\黑龙江房价\image\各个区域每平方房价变化的动态柱状图.html')
17     tl.render_notebook()
18     return tl
1 timeline_bar()
各个区域的每平方价格
 1 city = ['高新园区','甘井子','金州','开发区','旅顺口','沙河口','普兰店','瓦房店','西岗','中山']
 2 # city = ['高新园区']
 3 # x,y = get_xy('gaoxinyuanqu')
 4 corlo = ['blue','red','purple','green','pink','orange','scarlet']
 5 # x = ['2020.12', '2021.01', '2021.02', '2021.03', '2021.04', '2021.05']
 6 def bar(name):
 7     a,y = get_xy(name)
 8     x = a
 9     bar = Bar()
10     bar = Bar()
11     bar.add_xaxis(x)
12     bar.add_yaxis(' ',y)
13     bar.set_global_opts(title_opts=opts.TitleOpts("{}平均房价柱状图".format(name)))
14     bar.render_notebook()
15     bar.render(r'D:\program\黑龙江房价\image\{}平均房价柱状图.html'.format(name))
16 #     bar.add('{}房价'.format(name), x, y, is_label_show=True, is_datazoom_show=True, datazoom_type='both')
17     return bar
1 bar(city[0])
1 bar(city[1])
1 bar(city[2])
1 bar(city[3])
1 bar(city[4])
1 bar(city[6])

1 bar(city[5])
1 bar(city[7])
1 bar(city[8])
1 bar(city[9])

导入绘制词云图需要的库
 1 import time
 2 import openpyxl
 3 from openpyxl import load_workbook
 4 from openpyxl import Workbook
 5 import random
 6 import re
 7 import datetime
 8 # 导入词云制作库wordcloud和中文分词库jieba
 9 import jieba
10 import wordcloud
11 from wordcloud import WordCloud,ImageColorGenerator
构造生成词云的函数
 1 def cy(name):
 2     # 构建并配置词云对象w,注意要加scale参数,提高清晰度
 3     w = wordcloud.WordCloud(width=1000,
 4                             height=700,
 5                             background_color='white',
 6                             font_path='msyh.ttc',
 7                             scale=15)
 8     txt = []
 9     wb1 = load_workbook(r'D:\program\黑龙江房价\{}_final.xlsx'.format(name))
10     sheet1 = wb1.get_sheet_by_name('Sheet')
11     rows = sheet1.max_row
12     columns = sheet1.max_column
13     for x in range(1,rows):
14         txt.append(sheet1.cell(x,1).value)
15     # txtlist = jieba.lcut(txt)
16     txtlist = txt
17     print('{}的词云图'.format(name))
18     string = " ".join(txtlist)
19     # 将string变量传入w的generate()方法,给词云输入文字
20     w.generate(string)
21     # 将词云图片导出到当前文件夹
22     w.to_file(r'D:\program\黑龙江房价\{}.png'.format(name))
23     plt.figure(name)
24     # 以图片的形式显示词云
25     plt.imshow(w)
26     # 关闭图像坐标系
27     plt.axis("off")
28     plt.show()
画出每个区域的词云图,词云图是根据房型和位置名进行绘制的
1 city = ['高新园区','甘井子','金州','开发区','旅顺口','沙河口','普兰店','瓦房店','西岗','中山']
2 for i in city:
3     cy(i)


完整代码:
  1 import requests
  2 import random
  3 import time
  4 from bs4 import BeautifulSoup
  5 import openpyxl
  6 from openpyxl import load_workbook
  7 from openpyxl import Workbook
  8 import matplotlib.pyplot as plt
  9
 10 user_agent_list = [
 11     "Mozilla/5.0 (Windows NT 6.1; WOW64) AppleWebKit/537.1 (KHTML, like Gecko) Chrome/22.0.1207.1 Safari/537.1",
 12     "Mozilla/5.0 (X11; CrOS i686 2268.111.0) AppleWebKit/536.11 (KHTML, like Gecko) Chrome/20.0.1132.57 Safari/536.11",
 13     "Mozilla/5.0 (Windows NT 6.1; WOW64) AppleWebKit/536.6 (KHTML, like Gecko) Chrome/20.0.1092.0 Safari/536.6",
 14     "Mozilla/5.0 (Windows NT 6.2) AppleWebKit/536.6 (KHTML, like Gecko) Chrome/20.0.1090.0 Safari/536.6",
 15     "Mozilla/5.0 (Windows NT 6.2; WOW64) AppleWebKit/537.1 (KHTML, like Gecko) Chrome/19.77.34.5 Safari/537.1",
 16     "Mozilla/5.0 (X11; Linux x86_64) AppleWebKit/536.5 (KHTML, like Gecko) Chrome/19.0.1084.9 Safari/536.5",
 17     "Mozilla/5.0 (Windows NT 6.0) AppleWebKit/536.5 (KHTML, like Gecko) Chrome/19.0.1084.36 Safari/536.5",
 18     "Mozilla/5.0 (Windows NT 6.1; WOW64) AppleWebKit/536.3 (KHTML, like Gecko) Chrome/19.0.1063.0 Safari/536.3"
 19 ]#伪装电脑
 20 UA = random.choice(user_agent_list)  ##从self.user_agent_list中随机取出一个字符串
 21 headers = {'User-Agent': UA}  ##构造成一个完整的User-Agent (UA代表的是上面随机取出来的字符串哦)
 22 name = 'ganjingzi'#区域名拼写
 23 url = 'https://dl.ke.com/chengjiao/{}/pg'.format(name)#构造URL
 24 all_message = []#用于存放所有爬取的信息
 25 for x in range(1,10):#页数
 26     print('{}/10'.format(x))
 27
 28     time.sleep(random.randint(2,5))
 29     print(url+str(x)+str(x))
 30
 31     with requests.get(url+str(x), headers=headers, timeout=5) as response:
 32
 33         soup = BeautifulSoup(response.text, 'lxml')
 34
 35         # print(soup.title.text)  # 打印title
 36
 37         li_list = soup.find('ul', class_='listContent').find_all('li')
 38         # print(li_list)
 39         for li_quick in li_list:
 40
 41             try:
 42                 #取成交日期
 43                 dealDate=li_quick.find('div',class_='dealDate').get_text().strip()
 44                 #取名称
 45                 title=li_quick.find('div',class_='title').a.get_text().strip()
 46                 #取总价
 47                 totalPrice=li_quick.find('div',class_='totalPrice').find('span',class_='number').get_text().strip()
 48                 #取单价
 49                 unitPrice=li_quick.find('div',class_='unitPrice').find('span',class_='number').get_text().strip()
 50                 #取位置信息
 51                 positionInfo=li_quick.find('div',class_='positionInfo').get_text().strip()
 52                 #取成交周期
 53                 dealCycleTxt0=li_quick.find('div',class_='dealCycleeInfo').find('span',class_='dealCycleTxt').find_all('span')[0].get_text().strip()
 54                 #取挂牌价格
 55                 dealCycleTxt1=li_quick.find('div',class_='dealCycleeInfo').find('span',class_='dealCycleTxt').find_all('span')[1].get_text().strip()
 56                 all_message.append([title,dealDate,totalPrice,unitPrice,dealCycleTxt0,dealCycleTxt1,positionInfo])
 57             except:
 58                 continue
 59             finally:
 60                 print(title,',',dealDate,',',totalPrice,',',unitPrice,',',dealCycleTxt0,',',dealCycleTxt1,',',positionInfo)
 61
 62 wb3 = Workbook()
 63 sheet3 = wb3.active
 64 for i in range(len(all_message)):
 65     sheet3.append(all_message[i])
 66 wb3.save(r'D:\program\黑龙江房价\{}.xlsx'.format(name))
 67
 68 import collections
 69 from pyecharts import options as opts
 70 # from pyecharts import options as opts
 71 from pyecharts.charts import Bar, Page, Pie, Timeline
 72 from random import randrange
 73 import openpyxl
 74 from openpyxl import load_workbook
 75 from openpyxl import Workbook
 76 from collections import Counter
 77 import random
 78
 79 def data_s(name):
 80     all_message = []
 81     wb3 = load_workbook(r'D:\program\黑龙江房价\{}.xlsx'.format(name))
 82     sheet3 = wb3.get_sheet_by_name('Sheet')
 83     rows = sheet3.max_row
 84     columns = sheet3.max_column
 85     for x in range(1,rows+1):
 86         tem = []
 87         for y in range(1,columns+1):
 88             tem.append(sheet3.cell(x,y).value)
 89         all_message.append(tem)
 90
 91     # print(all_message)
 92     sorted(all_message,key=(lambda x:x[1]))#根据日期排序
 93     # print(all_message)
 94     final = []
 95     for i in all_message:#数据清洗,去重
 96         if i not in final:
 97             final.append(i)
 98     wb4 = Workbook()
 99     sheet4 = wb4.active
100     for i in range(len(final)):
101         sheet4.append(final[i])
102     wb4.save(r'D:\program\黑龙江房价\{}_final.xlsx'.format(name))
103     return final
104
105 data_s('高新园区')#显示高新园区排序和清洗后的数据
106
107 def get_xy(name):#duza
108     gx = data_s(name)
109     date = []
110     for i in gx:
111         # print(i)
112         date.append(i[1][:7])
113     # print(date)
114     values_counts = Counter(date)
115 #     print(values_counts)
116 #     print(len(values_counts))
117     sorted(values_counts.keys())
118     print(values_counts)
119     x = []
120     y = []
121     for i in values_counts:
122         x.append(i)
123     x.sort()
124     for i in x:
125         sum = 0
126         for each in gx:
127             if i in each[1]:
128                 sum+=int(each[3])
129         print(sum)
130         print(sum/values_counts[i])
131         y.append(int(sum/values_counts[i]))
132     return x,y
133
134 city = ['高新园区','甘井子','金州','开发区','旅顺口','沙河口','普兰店','瓦房店','西岗','中山']
135 # city = ['高新园区']
136 # x,y = get_xy('gaoxinyuanqu')
137 corlo = ['blue','red','purple','green','pink','orange','scarlet']
138 def timeline_bar() -> Timeline:
139     # x = ['2020.12', '2021.01', '2021.02', '2021.03', '2021.04', '2021.05']
140     tl = Timeline()
141     for i in city:
142         a,y = get_xy(i)
143         x = a
144         bar = Bar()
145         bar.add_xaxis(x)
146         bar.add_yaxis(' ',y)
147         bar.set_global_opts(title_opts=opts.TitleOpts("大连{}平均房价走势图".format(i)))
148         tl.add(bar, "{}".format(i))
149     tl.render(r'D:\program\黑龙江房价\image\各个区域每平方房价变化的动态柱状图.html')
150     tl.render_notebook()
151     return tl
152
153 timeline_bar()
154
155
156 city = ['高新园区','甘井子','金州','开发区','旅顺口','沙河口','普兰店','瓦房店','西岗','中山']
157 # city = ['高新园区']
158 # x,y = get_xy('gaoxinyuanqu')
159 corlo = ['blue','red','purple','green','pink','orange','scarlet']
160 # x = ['2020.12', '2021.01', '2021.02', '2021.03', '2021.04', '2021.05']
161 def bar(name):
162     a,y = get_xy(name)
163     x = a
164     bar = Bar()
165     bar = Bar()
166     bar.add_xaxis(x)
167     bar.add_yaxis(' ',y)
168     bar.set_global_opts(title_opts=opts.TitleOpts("{}平均房价柱状图".format(name)))
169     bar.render_notebook()
170     bar.render(r'D:\program\黑龙江房价\image\{}平均房价柱状图.html'.format(name))
171 #     bar.add('{}房价'.format(name), x, y, is_label_show=True, is_datazoom_show=True, datazoom_type='both')
172     return bar
173
174
175 bar(city[0])
176
177 bar(city[1])
178
179 bar(city[2])
180
181 bar(city[3])
182
183 bar(city[4])
184
185 bar(city[6])
186
187 bar(city[5])
188
189 bar(city[7])
190
191 bar(city[8])
192
193 bar(city[9])
194
195 import time
196 import openpyxl
197 from openpyxl import load_workbook
198 from openpyxl import Workbook
199 import random
200 import re
201 import datetime
202 # 导入词云制作库wordcloud和中文分词库jieba
203 import jieba
204 import wordcloud
205 from wordcloud import WordCloud,ImageColorGenerator
206
207 def cy(name):
208     # 构建并配置词云对象w,注意要加scale参数,提高清晰度
209     w = wordcloud.WordCloud(width=1000,
210                             height=700,
211                             background_color='white',
212                             font_path='msyh.ttc',
213                             scale=15)
214     txt = []
215     wb1 = load_workbook(r'D:\program\黑龙江房价\{}_final.xlsx'.format(name))
216     sheet1 = wb1.get_sheet_by_name('Sheet')
217     rows = sheet1.max_row
218     columns = sheet1.max_column
219     for x in range(1,rows):
220         txt.append(sheet1.cell(x,1).value)
221     # txtlist = jieba.lcut(txt)
222     txtlist = txt
223     print('{}的词云图'.format(name))
224     string = " ".join(txtlist)
225     # 将string变量传入w的generate()方法,给词云输入文字
226     w.generate(string)
227     # 将词云图片导出到当前文件夹
228     w.to_file(r'D:\program\黑龙江房价\{}.png'.format(name))
229     plt.figure(name)
230     # 以图片的形式显示词云
231     plt.imshow(w)
232     # 关闭图像坐标系
233     plt.axis("off")
234     plt.show()
235
236
237 city = ['高新园区','甘井子','金州','开发区','旅顺口','沙河口','普兰店','瓦房店','西岗','中山']
238 for i in city:
239     cy(i)
总结:
通过该项目的可视化效果可以查看每个区域每个季度的房价信息以便根据实际价格决定房屋购买时间,还可以通过词云直观的将受欢迎的房型表示出来,供用户参考 。

