
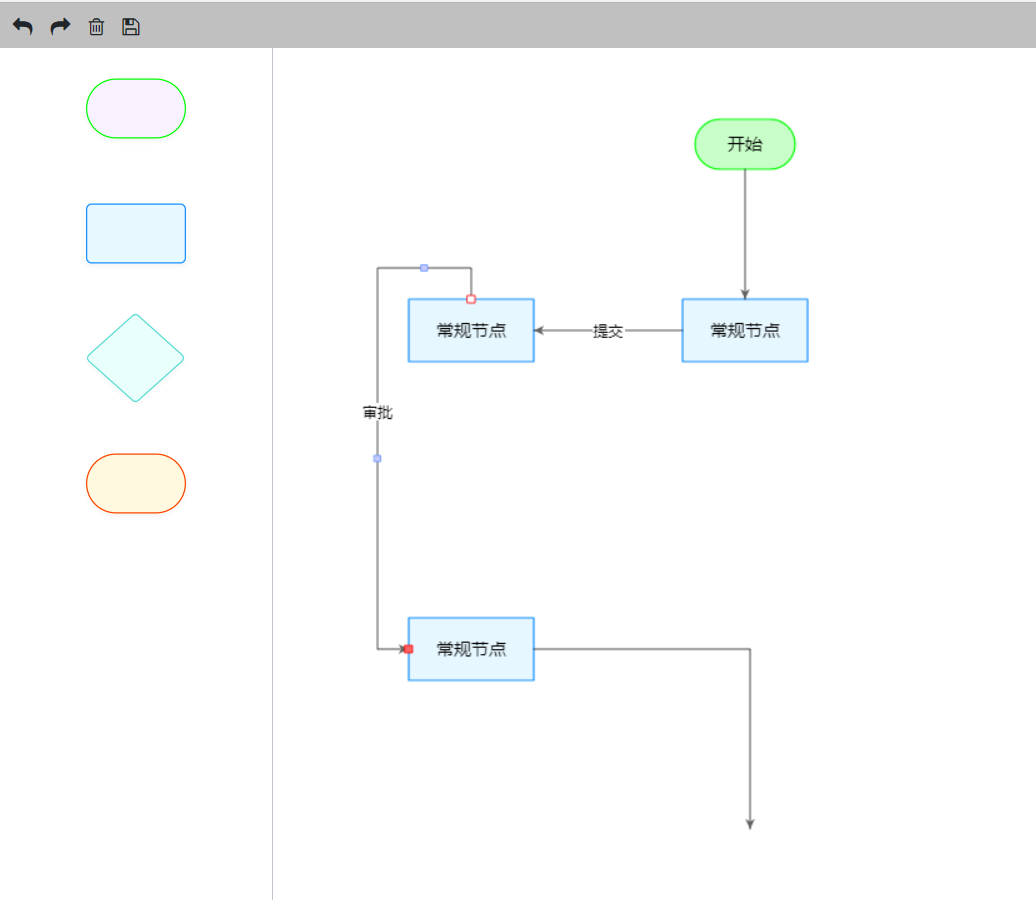
基于canvas的流程编辑器
今年由于项目上需要给客户的流程管理系统进行升级,其中包含流程的可视化。于是在网上找一些可以用的轮子,考察了D3,js、GooFlow.js、G6-Editor等工具后,发现D3,js学习成本太高,G6-Editor功能基本够用,但是不能放大缩小图形和移动连接线是硬伤,而且GooFlow.js和G6-Editor目前已经闭源,于是就决定自己试着写一个流程编辑器。
由于之前画流程图基本使用的都是Visio,所以编辑器的操作风格基本和Visio一致,也吸收了一些G6-Editor的操作风格。
HTML内容如下:
<!DOCTYPE html>
<html>
    <head>
        <meta charset="utf-8" />
        <title>Test Page</title>
        <meta name="viewport" content="width=device-width, initial-scale=1, shrink-to-fit=no">
        <link rel="shortcut icon" href="assets/img/favicon.jpg">
        <link rel="stylesheet" href="assets/css/bootstrap.min.css" type="text/css" />
        <link rel="stylesheet" href="assets/css/font-awesome.min.css" type="text/css" />
        <link rel="stylesheet" href="assets/css/editor.css" type="text/css" />
    </head>
    <body>
        <div style="width:99%">
            <div id="toolbar" class="toolbar">
                <i data-command="undo" class="fa fa-mail-reply" title="撤销"></i>
                <i data-command="redo" class="fa fa-mail-forward" title="重做"></i>
                <i data-command="delete" class="fa fa-trash-o" title="删除"></i>
                <i data-command="save" class="fa fa-save" title="保存"></i>
            </div>
            <div class="row" style="width:99%">
                <div class="col-md-2">
                    <div id="itempannel" class="itempannel">
                        <div class="node" data-type="node" data-shape="capsule" data-size="80*40" data-label="开始" data-color="rgba(200,255,200,1)" data-edgecolor="rgb(10,255,10,1)" >
                            <img draggable="false" src="assets/img/start.svg" alt="" scrset="">
                        </div>
                        <div class="node" data-type="node" data-shape="rect" data-size="100*50" data-label="常规节点" data-color="#E6F7FF" data-edgecolor="#1890FF" >
                            <img draggable="false" src="assets/img/normal.svg" alt="" scrset="">
                        </div>
                        <div class="node" data-type="node" data-shape="rhomb" data-size="100*80" data-label="判断" data-color="#E6FFFB" data-edgecolor="#5CDBD3" >
                            <img draggable="false" src="assets/img/judge.svg" alt="" scrset="">
                        </div>
                        <div class="node" data-type="node" data-shape="capsule" data-size="80*40" data-label="结束" data-color="rgba(255,200,200,1)" data-edgecolor="rgb(255,50,50,1)" >
                            <img draggable="false" src="assets/img/end.svg" alt="" scrset="">
                        </div>
                    </div>
                </div>
                <div class="col-md-7">
                    <div id="canvas"></div>
                </div>
                <div class="col-md-3">
                    <div id="detailpannel" class="detailpannel">
                        <div><b>属性详情</b></div>
                        <div id="nodedetail" style="display:none">
                            <div class="row">
                                <label class="col-sm-4 control-label">
                                    节点名称
                                </label>
                                <div class="col-sm-8">
                                    <input id="nodename" type="text" class="form-control" />
                                </div>
                            </div>
                            <div class="row">
                                <label class="col-sm-4 control-label">
                                    字体大小
                                </label>
                                <div class="col-sm-8">
                                    <input id="fontsize_node" type="text" class="form-control" />
                                </div>
                            </div>
                            <div class="row">
                                <label class="col-sm-4 control-label">
                                    自定义属性
                                </label>
                                <div class="col-sm-8">
                                    <input id="nodecustom" type="text" class="form-control" />
                                </div>
                            </div>
                        </div>
                        <div id="linedetail" style="display:none">
                            <div class="row">
                                <label class="col-sm-4 control-label">
                                    线条名称
                                </label>
                                <div class="col-sm-8">
                                    <input id="linename" type="text" class="form-control" />
                                </div>
                            </div>
                            <div class="row">
                                <label class="col-sm-4 control-label">
                                    字体大小
                                </label>
                                <div class="col-sm-8">
                                    <input id="fontsize_line" type="text" class="form-control" />
                                </div>
                            </div>
                            <div class="row">
                                <label class="col-sm-4 control-label">
                                    自定义属性
                                </label>
                                <div class="col-sm-8">
                                    <input id="linecustom" type="text" class="form-control" />
                                </div>
                            </div>
                        </div>
                    </div>
                </div>
            </div>
        </div>
        <script type="text/javascript" src="assets\js\popper.min.js"></script>
        <script type="text/javascript" src="assets\js\jquery.min.js"></script>
        <script type="text/javascript" src="assets\js\bootstrap.min.js"></script>
        <script type="text/javascript" src="assets\js\graphEditor.js"></script>
        <script type="text/javascript" src="assets\js\index.js"></script>
    </body>
</html>
其中graphEditor.js就是编辑器的js文件,编辑器的画布加载在id为canvas的容器中。
index.js文件内容如下:
const data = {};
//节点格式
data.nodes = [
    {
        color:"rgba(200,200,255,1)",
        customProperties: {
            nodestyle: "11"
        },
        edgeColor:"#1890FF",
        id: "9471a484-7a2e-4ca9-949d-6ec4b495a1a2",
        index: 1,
        label: "测试加载节点",
        shape: "rect",
        size: "100*50",
        type: "node",
        x: 282,
        y: 222
    },
    {
        color:"rgba(200,200,255,1)",
        customProperties: {
            nodestyle: "22"
        },
        edgeColor:"#1890FF",
        id: "9471a484-7a2e-4ca9-949d-6ec4b495a1a3",
        index: 2,
        label: "测试加载判断",
        shape: "rhomb",
        size: "100*80",
        type: "node",
        x: 282,
        y: 422,
        fontSize: "12px"
    }
]
//线条格式
data.lines = [
    {
        color:"rgba(0,0,0,1)",
        customProperties: {
            btnstyle: "test"
        },
        index: 3,
        label: "测试线条1",
        fontSize: "12px",
        fromConOrder: 3,
        source: "9471a484-7a2e-4ca9-949d-6ec4b495a1a2",
        type: "line",
        endPoint: { x: 81, y: 210 },
        inflexionPoint: [
            { x: 282, y: 272 },
            { x: 81, y: 272 }
        ]
    },
    {
        color:"rgba(0,0,0,1)",
        customProperties: {
            btnstyle: "test"
        },
        index: 4,
        label: "测试线条2",
        fontSize: "14px",
        toConOrder: 1,
        startPoint: { x: 555, y: 447 },
        target: "9471a484-7a2e-4ca9-949d-6ec4b495a1a3",
        type: "line",
        inflexionPoint: [
            { x: 555, y: 357 },
            { x: 282, y: 357 }
        ]
    }
]
//创建编辑器
const editor = new GraphEditor();
//编辑器加载数据
//editor.load(data);

//绑定元素容器
editor.itemPannel = 'itempannel';
//绑定详细属性栏
editor.detailPannel = 'detailpannel';
//绑定工具栏
editor.toolbar = 'toolbar';
const nodeDetail = $('#nodedetail');
const lineDetail = $('#linedetail');
const nodeName = $('#nodename');
const lineName = $('#linename');
const nodeCustom = $('#nodecustom');
const lineCustom = $('#linecustom');
const nodeFontSize = $('#fontsize_node');
const lineFontSize = $('#fontsize_line');

//选择元素事件
editor.on('selectedElement', function(e) {
    if(e.element.isNode){
        lineDetail.hide();
        nodeDetail.show();
        nodeName.val(e.element.label);
        nodeFontSize.val(e.element.fontSize);
        nodeCustom.val(e.element.customProperties.nodestyle);
    } else if (e.element.isLine){
        nodeDetail.hide();
        lineDetail.show();
        lineName.val(e.element.label);
        lineFontSize.val(e.element.fontSize);
        lineCustom.val(e.element.customProperties.btnstyle);
    }
});
//点击画布事件
editor.on('click', function(e) {
    if(!e.element){
        nodeDetail.hide();
        lineDetail.hide();
    }
});
//撤销事件
editor.on('undo', function(e) {
    nodeDetail.hide();
    lineDetail.hide();
    //console.log(e.data);
});
//重做事件
editor.on('redo', function(e) {
    nodeDetail.hide();
    lineDetail.hide();
    //console.log(e.data);
});
//保存事件
editor.on('save', function(e) {console.log(e.data)});

nodeName.change(function(e){
    updateEditor(e, 'label');
});

lineName.change(function(e){
    updateEditor(e, 'label');
});

nodeFontSize.change(function(e){
    updateEditor(e, 'fontSize');
});

lineFontSize.change(function(e){
    updateEditor(e, 'fontSize');
});

nodeCustom.change(function(e){
    updateEditor(e, 'nodestyle');
});

lineCustom.change(function(e){
    updateEditor(e, 'btnstyle');
});

function updateEditor(e, name){
    const property = {};
    property.name = name;
    property.value = $('#' +e.target.id).val();
    if (editor.selectedElement){
        editor.update(editor.selectedElement.id, property);
    };
}
GraphEditor方法列表:
- load(data):用于加载数据,data的结构参考index.js。
node节点的属性如下:
color:节点填充颜色
edgeColor:节点边框颜色
shape:“rect”为矩形,“rhomb”为菱形,“capsule”为胶囊
id:节点编号
index:节点层级
label:文字内容
fontSize:文字大小
size:节点的长和宽,例如“100*50”
type:“node”
x:节点x轴坐标
y:节点y轴坐标
customProperties:自定义属性,用于保存业务相关数据
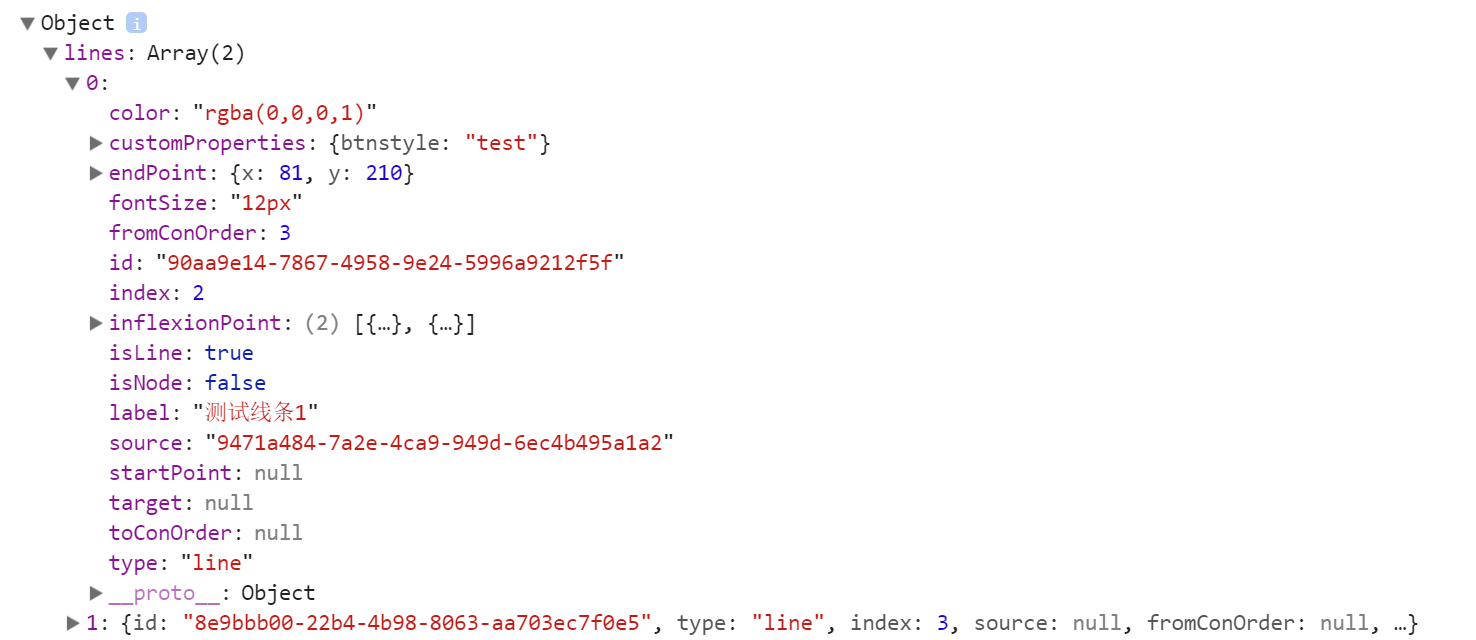
line线条的属性如下:
color:线条颜色
id:线条编号
index:线条层级
label:文字内容
fontSize:文字大小
type:“line”
source:线条起始节点的编号
target:线条结束节点的编号
fromConOrder:起始节点对应的锚点编号
toConOrder:结束节点对应的锚点编号
startPoint:起始点坐标,用于无起始节点情况
endPoint:结束点坐标,用于无结束节点情况
inflexionPoint:线条拐点集合
- update(id,property)
id:元素的编号
property:{ name: 要更新的属性名称, value:更新的值 }
GraphEditor事件列表:
- selectedElement:选中任何canvas元素触发,事件对象的element属性存放选中的元素
-
click:点击canvas容器触发
-
undo:撤销操作触发
-
redo:重做操作触发
- save:保存操作触发,事件对象的data属性存放画布中所有的元素,编辑器对象的data属性也包含画布所有元素
GraphEditor快捷键列表:
- Delete:删除画布上的元素
- Ctrl+z:撤销
- Ctrl+y:重做
- Ctrl+s:保存
Demo下载地址:https://files.cnblogs.com/files/lixincloud/GraphEditorDemo.rar
