matplotlib.pyplot模块-基本图像类型
- 导入
import matplotlib.pyplot as plt导入
- 散点图
matplotlib.pyplot.scatter(x, y, s=None, c=None, marker=None, cmap=None, norm=None, vmin=None, vmax=None, alpha=None, linewidths=None, verts=<deprecated parameter>, edgecolors=None, *, plotnonfinite=False, data=None, **kwargs)
使用的数据:
x, y float or array-like, shape (n, )
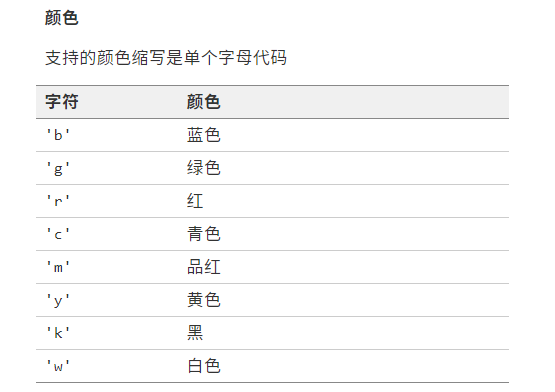
颜色列表:
c array-like or list of colors or color, optional
- A scalar or sequence of n numbers to be mapped to colors using cmap and norm.
- A 2-D array in which the rows are RGB or RGBA.
- A sequence of colors of length n.
- A single color format string.
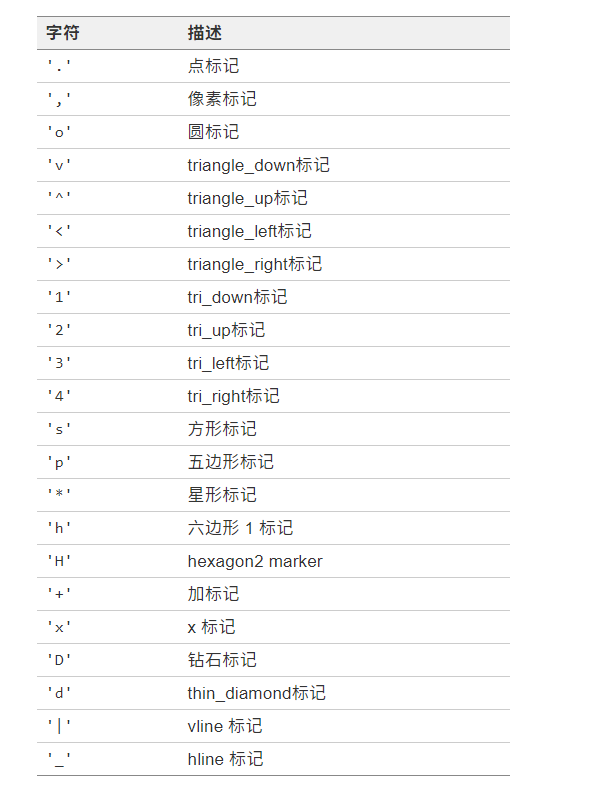
散点形状:
marker default: 'o'
透明度:
alpha float, default: None
The alpha blending value, between 0 (transparent) and 1 (opaque).
散点边的宽度:
linewidths float or array-like, default: 1.5
The linewidth of the marker edges. Note: The default edgecolors is 'face'. You may want to change this as well
散点边的颜色:
edgecolors {'face', 'none', None} or color or sequence of color, default: 'face'
The edge color of the marker. Possible values:
- 'face': The edge color will always be the same as the face color.
- 'none': No patch boundary will be drawn.
- A color or sequence of colors.
For non-filled markers, the edgecolors kwarg is ignored and forced to 'face' internally.
- 折线图
matplotlib.pyplot.plot(*args, scalex=True, scaley=True, data=None, **kwargs)
数据:
x, y array-like or scalar
The horizontal / vertical coordinates of the data points. x values are optional and default to .range(len(y))
Commonly, these parameters are 1D arrays.
They can also be scalars, or two-dimensional (in that case, the columns represent separate data sets).
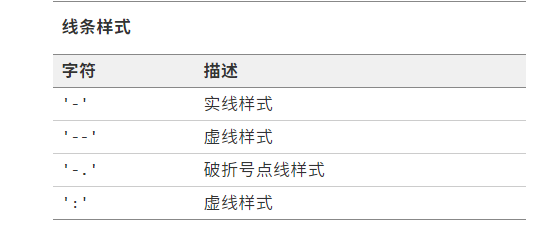
格式字符串,为简短的属性缩写,可以不添加关键字参数:
fmt str, optional
例如'[marker][line][color]'
A format string, e.g. 'ro' for red circles. See the Notes section for a full description of the format strings.
Format strings are just an abbreviation for quickly setting basic line properties. All of these and more can also be controlled by keyword arguments.
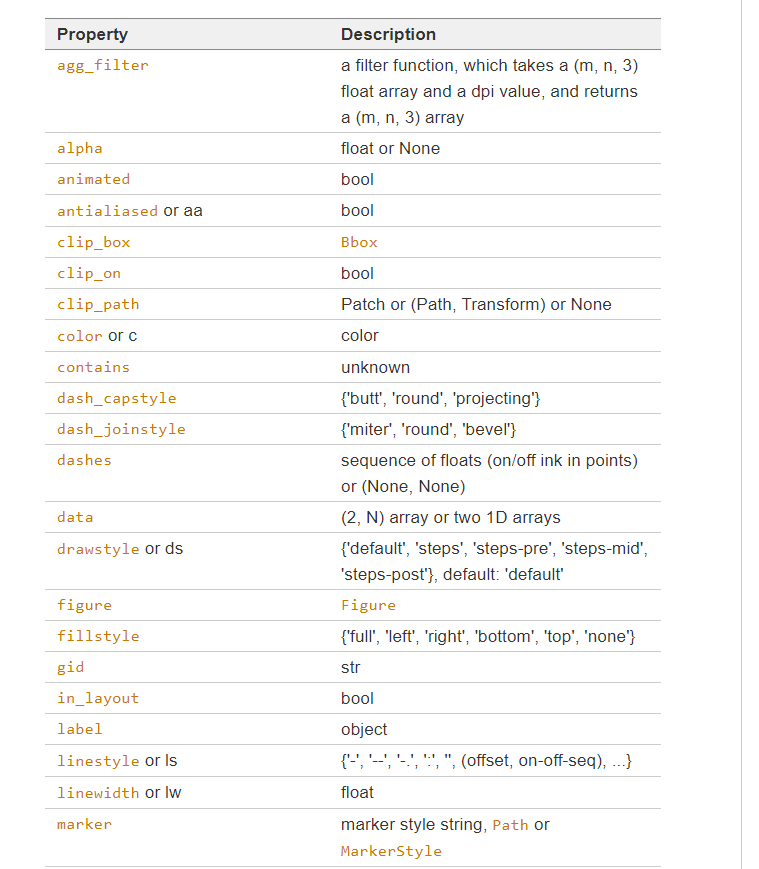
同时也可使用用于line2D的属性
- 条形图
matplotlib.pyplot.bar(x, height, width=0.8, bottom=None, *, align='center', data=None, **kwargs)
数据:
x float or array-like
height float or array-like
条形宽度:
width float or array-like, default: 0.8
条形基准高度(使用该项可以绘制堆积条形图):
bottom float or array-like, default: 0
条形对齐位置:
align {'center', 'edge'}, default: 'center'
Alignment of the bars to the x coordinates:
- 'center': Center the base on the x positions.
- 'edge': Align the left edges of the bars with the x positions.
如果想要对齐右侧,则使用负宽度
条形颜色:
color color or list of color, optional
条形边界颜色:
edgecolor color or list of color, optional
条形边界宽度:
linewidth float or array-like, optional
条形标签:
tick_label str or list of str, optional
- 水平条形图
matplotlib.pyplot.barh(y, width, height=0.8, left=None, *, align='center', **kwargs)
数据:
y float or array-like
width float or array-like
条形高度,实际上为条形宽度:
heightfloat or array-like, default: 0.8
条形左侧偏移,实际上为条形的基准高度:
left float or array-like, default: 0
其他与之前的条形图基本一致
- 直方图
matplotlib.pyplot.hist(x, bins=None, range=None, density=False, weights=None, cumulative=False, bottom=None, histtype='bar', align='mid', orientation='vertical', rwidth=None, log=False, color=None, label=None, stacked=False, *, data=None, **kwargs)
数据:
x (n,) array or sequence of (n,) arrays
Input values, this takes either a single array or a sequence of arrays which are not required to be of the same length
只需要一组数据,因为直方图本身是一种统计图像,而不是二维数据的直接绘制
直方个数(包括了等宽或者不等宽):
bins int or sequence or str, default: 10
If bins is an integer, it defines the number of equal-width bins in the range.
If bins is a sequence, it defines the bin edges, including the left edge of the first bin and the right edge of the last bin; in this case, bins may be unequally spaced. All but the last (righthand-most) bin is half-open.
直方的范围:
range tuple or None, default: None
概率密度显示:
density bool, default: False
If , draw and return a probability density: each bin will display the bin's raw count divided by the total number of counts and the bin width (), so that the area under the histogram integrates to 1
权重显示???:
weights (n,) array-like or None, default: None
An array of weights, of the same shape as x. Each value in x only contributes its associated weight towards the bin count (instead of 1). If density is , the weights are normalized, so that the integral of the density over the range remains 1.
累积展示???:
cumulative bool or -1, default: False
If , then a histogram is computed where each bin gives the counts in that bin plus all bins for smaller values. The last bin gives the total number of datapoints.True
If density is also then the histogram is normalized such that the last bin equals 1.True
If cumulative is a number less than 0 (e.g., -1), the direction of accumulation is reversed. In this case, if density is also , then the histogram is normalized such that the first bin equals 1
直方基准位置:
bottom array-like, scalar, or None, default: None
Location of the bottom of each bin, ie. bins are drawn from to If a scalar, the bottom of each bin is shifted by the same amount. If an array, each bin is shifted independently and the length of bottom must match the number of bins.
指定直方类型:
histtype {'bar', 'barstacked', 'step', 'stepfilled'}, default: 'bar'
The type of histogram to draw.
- 'bar' is a traditional bar-type histogram. If multiple data are given the bars are arranged side by side.
- 'barstacked' is a bar-type histogram where multiple data are stacked on top of each other.
- 'step' generates a lineplot that is by default unfilled.
- 'stepfilled' generates a lineplot that is by default filled.
对齐方式:
align {'left', 'mid', 'right'}, default: 'mid'
The horizontal alignment of the histogram bars.
- 'left': bars are centered on the left bin edges.
- 'mid': bars are centered between the bin edges.
- 'right': bars are centered on the right bin edges.
直方的方向:
orientation {'vertical', 'horizontal'}, default: 'vertical'
If 'horizontal', barh will be used for bar-type histograms and the bottom kwarg will be the left edges.
直方的相对宽度:
rwidth float or None, default: None
The relative width of the bars as a fraction of the bin width. If , automatically compute the width.None
Ignored if histtype is 'step' or 'stepfilled'.
对数化:
log bool, default: False
If , the histogram axis will be set to a log scale. If log is and x is a 1D array, empty bins will be filtered out and only the non-empty will be returned.TrueTrue(n, bins, patches)
颜色:
color color or array-like of colors or None, default: None
Color or sequence of colors, one per dataset. Default () uses the standard line color sequence.None
- 双变量直方图
matplotlib.pyplot.hist2d(x, y, bins=10, range=None, density=False, weights=None, cmin=None, cmax=None, *, data=None, **kwargs)
数据:
x, y array-like, shape (n, )
注意为两组数据进行分析
直方个数:
bins None or int or [int, int] or array-like or [array, array]
The bin specification:
- If int, the number of bins for the two dimensions (nx=ny=bins).
- If , the number of bins in each dimension (nx, ny = bins).
[int, int] - If array-like, the bin edges for the two dimensions (x_edges=y_edges=bins).
- If , the bin edges in each dimension (x_edges, y_edges = bins).
[array, array]
The default value is 10.
范围:
range array-like shape(2, 2), optional
The leftmost and rightmost edges of the bins along each dimension
- 饼状图
matplotlib.pyplot.pie(x, explode=None, labels=None, colors=None, autopct=None, pctdistance=0.6, shadow=False, labeldistance=1.1, startangle=0, radius=1, counterclock=True, wedgeprops=None, textprops=None, center=0, 0, frame=False, rotatelabels=False, *, normalize=None, data=None)
数据:
x 1D array-like
只需要一组数据,用于表示百分比
饼块的偏移:
explode array-like, default: None
If not None, is a array which specifies the fraction of the radius with which to offset each wedge
饼块的标签:
labels list, default: None
饼块的颜色:
colors array-like, default: None
A sequence of colors through which the pie chart will cycle. If None, will use the colors in the currently active cycle.
对标签使用格式化字符串:
autopct None or str or callable, default: None
If not None, is a string or function used to label the wedges with their numeric value. The label will be placed inside the wedge. If it is a format string, the label will be . If it is a function, it will be called.fmt % pct
饼块中心与文本的距离:
pctdistance float, default: 0.6
The ratio between the center of each pie slice and the start of the text generated by autopct. Ignored if autopct is None.
饼块的阴影:
shadow bool, default: False
标签与饼块中心的距离:
labeldistance float or None, default: 1.1
The radial distance at which the pie labels are drawn. If set to , label are not drawn, but are stored for use in Nonelegend()
饼块开始的角度:
startangle float, default: 0 degrees
The angle by which the start of the pie is rotated, counterclockwise from the x-axis.
饼块的半径:
radius float, default: 1
饼块的顺逆时针方向:
counterclock bool, default: True
指定饼块的形状,颜色等属性:
wedgeprops dict, default: None
使用字典来进行指定
指定文本的字体,大小等属性:
textprops dict, default: None
使用字典来进行指定
饼图的中心:
center (float, float), default: (0, 0)
为饼图添加轴:
frame bool, default: False
标签随饼块角度移动:
rotatelabels bool, default: False
- 箱线图
matplotlib.pyplot.boxplot(x, notch=None, sym=None, vert=None, whis=None, positions=None, widths=None, patch_artist=None, bootstrap=None, usermedians=None, conf_intervals=None, meanline=None, showmeans=None, showcaps=None, showbox=None, showfliers=None, boxprops=None, labels=None, flierprops=None, medianprops=None, meanprops=None, capprops=None, whiskerprops=None, manage_ticks=True, autorange=False, zorder=None, *, data=None)
数据:
x Array or a sequence of vectors.
是否有凹口:
notch bool, default: False
异常点的形状:
sym str, optional
The default symbol for flier points. An empty string ('') hides the fliers. If None, then the fliers default to 'b+'. More control is provided by the flierprops parameter.
方向:
vert bool, default: True
If True, draws vertical boxes. If False, draw horizontal boxes.、
上下须和上下四分位的距离
whis float or (float, float), default: 1.5
The position of the whiskers.
是否需要引导置信区间:
bootstrap int, optional
强制设置中位数值:
usermedians array-like, optional
强制设置置信区间:
conf_intervals array-like, optional
是否填充箱体的颜色:
patch_artist bool, default: False
设置框的位置:
positions array-like, optional
框的宽度:
widths float or array-like
框对应的标签:
labels sequence, optional
匹配标签和刻度线:
manage_ticks bool, default: True
If True, the tick locations and labels will be adjusted to match the boxplot positions.
自动设置范围???:
autorange bool, default: False
是否用线的形式表示均值:
meanline bool, default: False
层次:
zorder float, default: Line2D.zorder = 2
是否显示箱线图顶端和末端的两条线:
showcaps bool, default: True
显示箱体:
showbox bool, default: True
显示异常值:
showfliers bool, default: True
显示平均值:
showmeans bool, default: False
设置线的属性:
capprops dict, default: None
设置箱的属性:
boxprops dict, default: None
设置须得属性:
whiskerprops dict, default: None
设置异常值的属性:
flierprops dict, default: None
设置中位数的属性:
medianprops dict, default: None
设置平均值的属性:
meanprops dict, default: None
- 填充两条水平曲线之间区域,常用于折线图的美化
matplotlib.pyplot.fill_between(x, y1, y2=0, where=None, interpolate=False, step=None, *, data=None, **kwargs)
限定区域:
x array (length N)
The x coordinates of the nodes defining the curves.
y1 array (length N) or scalar
The y coordinates of the nodes defining the first curve.
y2 array (length N) or scalar, default: 0
The y coordinates of the nodes defining the second curve.
同样要设置color,alpha,zorder以保证效果

 浙公网安备 33010602011771号