

[原]OpeanLayers3 For ArcGIS MapServer
由于OpenLayers3比较新,百度能找到的demo很少,自己不得不参考官方给出的Examples来依葫芦画瓢了,地图服务采用的局方给的ArcGIS MapServer,先上图:
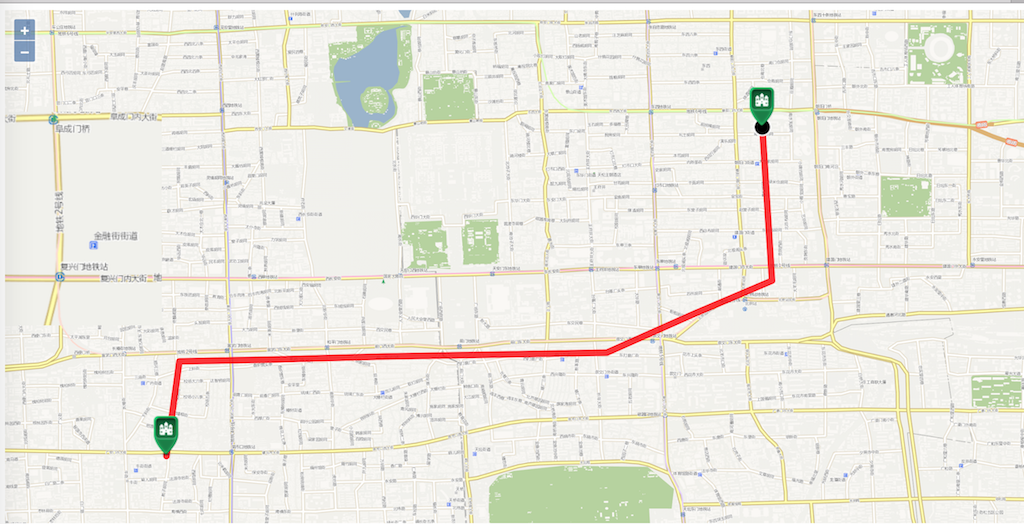
这个例子是按照官方Examples中的Marker Animation来做的,实现了轨迹回放的功能,下面上代码:
1 <!DOCTYPE html> 2 <html> 3 <head> 4 <title>Marker Animation</title> 5 <link rel="stylesheet" href="ol.css" type="text/css"> 6 <style> 7 .ol-attribution{ 8 display:none 9 } 10 </style> 11 <script src="ol.js"></script> 12 </head> 13 <body> 14 <div id="map" class="map"></div> 15 <label for="speed"> 16 speed: 17 <input id="speed" type="range" min="1" max="999" step="10" value="1"> 18 </label> 19 <button id="start-animation">Start Animation</button> 20 <script> 21 //GIS服务地址 22 var url = 'http://127.0.0.1:8399/arcgis/rest/services/beijingnewmap/MapServer'; 23 //一组经纬度,用于在地图上打点 24 var coords = [ 25 [116.429001,39.922701], 26 [116.430001,39.906901], 27 [116.422001,39.903501], 28 [116.413001,39.899501], 29 [116.390001,39.899101], 30 [116.379001,39.898801], 31 [116.369001,39.898601], 32 [116.367667,39.888861] 33 ]; 34 35 //轨迹图层 36 var lineFeature = new ol.Feature({ 37 type: 'route', 38 geometry: new ol.geom.LineString(coords) 39 }); 40 //运动点 41 var geoMarker = new ol.Feature({ 42 type: 'geoMarker', 43 geometry: new ol.geom.Point(coords[0]) 44 }); 45 //开始点 46 var startMarker = new ol.Feature({ 47 type: 'icon', 48 geometry: new ol.geom.Point(coords[0]) 49 }); 50 //结束点 51 var endMarker = new ol.Feature({ 52 type: 'icon', 53 geometry: new ol.geom.Point(coords[coords.length-1]) 54 }); 55 56 //一组样式 57 var styles = { 58 'route': new ol.style.Style({ 59 stroke: new ol.style.Stroke({ 60 width: 8, color: [255, 0, 0, 0.8] 61 }) 62 }), 63 'icon': new ol.style.Style({ 64 image: new ol.style.Icon({ 65 anchor: [0.5, 1], 66 src: 'icon.png' 67 }) 68 }), 69 'geoMarker': new ol.style.Style({ 70 image: new ol.style.Circle({ 71 radius: 10, 72 snapToPixel: false, 73 fill: new ol.style.Fill({color: 'black'}), 74 stroke: new ol.style.Stroke({ 75 color: 'white', width: 2 76 }) 77 }) 78 }) 79 }; 80 81 var animating = false; 82 var speed, now; 83 var speedInput = document.getElementById('speed'); 84 var startButton = document.getElementById('start-animation'); 85 86 var vectorLayer = new ol.layer.Vector({ 87 source: new ol.source.Vector({ 88 features: [lineFeature, geoMarker, startMarker, endMarker] 89 }), 90 style: function(feature) { 91 // hide geoMarker if animation is active 92 if (animating && feature.get('type') === 'geoMarker') { 93 return null; 94 } 95 return styles[feature.get('type')]; 96 } 97 }); 98 99 //将轨迹的中心点设置为地图的中心点 100 var center = [coords[coords.length/2]]; 101 var map = new ol.Map({ 102 target: document.getElementById('map'), 103 loadTilesWhileAnimating: true, 104 view: new ol.View({ 105 projection: 'EPSG:4326', 106 center: center, 107 zoom: 14, 108 minZoom: 2, 109 maxZoom: 19 110 }), 111 layers: [ 112 new ol.layer.Tile({ 113 source: new ol.source.TileArcGISRest({ 114 url: url 115 }) 116 }), 117 vectorLayer 118 ] 119 }); 120 121 var moveFeature = function(event) { 122 var vectorContext = event.vectorContext; 123 var frameState = event.frameState; 124 125 if (animating) { 126 var elapsedTime = frameState.time - now; 127 // here the trick to increase speed is to jump some indexes 128 // on lineString coordinates 129 var index = Math.round(speed * elapsedTime / 1000); 130 131 if (index >= coords.length) { 132 stopAnimation(true); 133 return; 134 } 135 136 var currentPoint = new ol.geom.Point(coords[index]); 137 var feature = new ol.Feature(currentPoint); 138 vectorContext.drawFeature(feature, styles.geoMarker); 139 } 140 // tell OL3 to continue the postcompose animation 141 map.render(); 142 }; 143 144 function startAnimation() { 145 if (animating) { 146 stopAnimation(false); 147 } else { 148 animating = true; 149 now = new Date().getTime(); 150 speed = speedInput.value; 151 startButton.textContent = 'Cancel Animation'; 152 // hide geoMarker 153 geoMarker.setStyle(null); 154 // just in case you pan somewhere else 155 map.getView().setCenter(center); 156 map.on('postcompose', moveFeature); 157 map.render(); 158 } 159 } 160 161 162 /** 163 * @param {boolean} ended end of animation. 164 */ 165 function stopAnimation(ended) { 166 animating = false; 167 startButton.textContent = 'Start Animation'; 168 169 // if animation cancelled set the marker at the beginning 170 var coord = ended ? coords[coords.length-1] : coords[0]; 171 /** @type {ol.geom.Point} */ (geoMarker.getGeometry()) 172 .setCoordinates(coord); 173 //remove listener 174 map.un('postcompose', moveFeature); 175 } 176 177 startButton.addEventListener('click', startAnimation, false); 178 </script> 179 </body> 180 </html>
需要注意的是我这里使用的是经纬度,所以在构建地图的时候需要指定坐标系projection: 'EPSG:4326',否则地图是出不来的。
下面的样式是去除地图右下角OpenLayers的logo的:
1 <style>
2      .ol-attribution{
3          display:none
4      }
5 </style>
心有多大,林子就有多大

 浙公网安备 33010602011771号