

第七次
import numpy as np
a=np.random.randn(4,4) #4行4列的正态分布随机数组
print(a)
import numpy as np

mu = 10  #期望为10
sigma = 30  #标准差为30
num = 100  #个数为100

rand_data = np.random.normal(mu, sigma, num)
print(rand_data)
import numpy as np
from sklearn.datasets import load_iris

data=load_iris()
print(type(data))
print(data.keys(),data.feature_names)
iris=data.data
print(iris)

petal_length=iris[:,2]
print(petal_length)
print("鸢尾花花瓣长度的最大值",np.max(petal_length))
print("鸢尾花花瓣长度的平均值",np.mean(petal_length))
print("鸢尾花花瓣长度的中值",np.median(petal_length))
print("鸢尾花花瓣长度的均方差",np.std(petal_length))
import numpy as np
import matplotlib.pyplot as plt
mu=np.mean(pental_len)
sigma=np.std(pental_len)
num=99999
rand_data = np.random.normal(mu,sigma,num)
count, bins, ignored = plt.hist(rand_data, 30, normed=True)
plt.plot(bins, 1/(sigma * np.sqrt(2 * np.pi)) *np.exp( - (bins - mu)**2 / (2 * sigma**2)), linewidth=2, color='r')
plt.show()

# 用鸢尾花花瓣作分析
x = np.array(iris_length)
y = np.zeros(x.shape[0])
kc = initcen(x,3)
flag = True
while flag:
y = xclassify(x,y,kc)
kc,flag = kcmean(x,y,kc,3)
print(kc,flag)
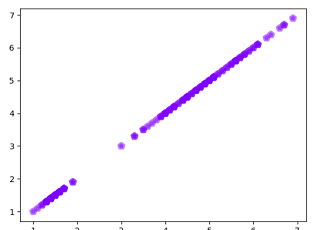
# 分析鸢尾花花瓣长度的数据,并用散点图表示出来
import matplotlib.pyplot as plt
plt.scatter(iris_length, iris_length, marker='p', c=y, alpha=0.5, linewidths=4, cmap='Paired')
plt.show()
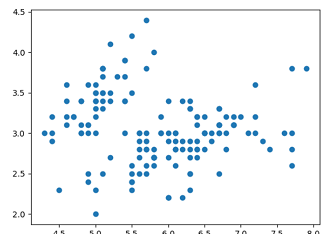
#4鸢尾花完整数据做聚类并用散点图显示.

from sklearn.datasets import load_iris
iris=load_iris()
x=iris.data

from sklearn.cluster import KMeans
eat=KMeans(n_clusters=3)
eat.fit(x)
eat.cluster_centers_
y=eat.predict(x)
y

import matplotlib.pyplot as plt
plt.scatter(x[:,0],x[:,1])
plt.show()

 浙公网安备 33010602011771号