
Python爬虫——豆果美食菜谱爬取及数据分析
一、选题的背景
中国文化,博大精深,中国美食,也是数不胜数,在我国,不同地域的人,吃的美食也不相同,中国菜系我们统分为川菜、粤菜、东北菜、湘菜、鲁菜、浙菜、湖北菜和清真菜。通过数据,浏览者可以直观的了解到这八大菜系的美食、配料表以及大众评分标准,当为了吃什么美食而烦恼时,只要通过此数据分析,就可以解决这一问题。
二、大数据分析设计方案
1.本数据集的数据内容与数据特征分析
数据共计5419条
|
字段名称 |
字段类型 |
字段说明 |
|
菜谱 |
浮点型 |
八大菜系的菜谱 |
|
菜谱链接 |
浮点型 |
八大菜系的菜谱链接 |
|
用料 |
浮点型 |
菜谱的用料 |
|
评分 |
浮点型 |
菜谱的评分 |
|
用户 |
浮点型 |
用户 |
|
图片链接 |
浮点型 |
菜谱的图片链接 |
|
菜系 |
浮点型 |
八大菜系,川菜、粤菜、东北菜、湘菜、鲁菜、浙菜、湖北菜和清真菜 |
2.数据分析的课程设计方案概述
(1)先采集需要的数据集
(2)对数据集的数据进行所需要的处理
(2)对数据集每一种数据进行python可视化处理分析
三、数据分析步骤
1.数据源
爬取豆果美食网站获取到5419条数据
首先获取网站的url地址:
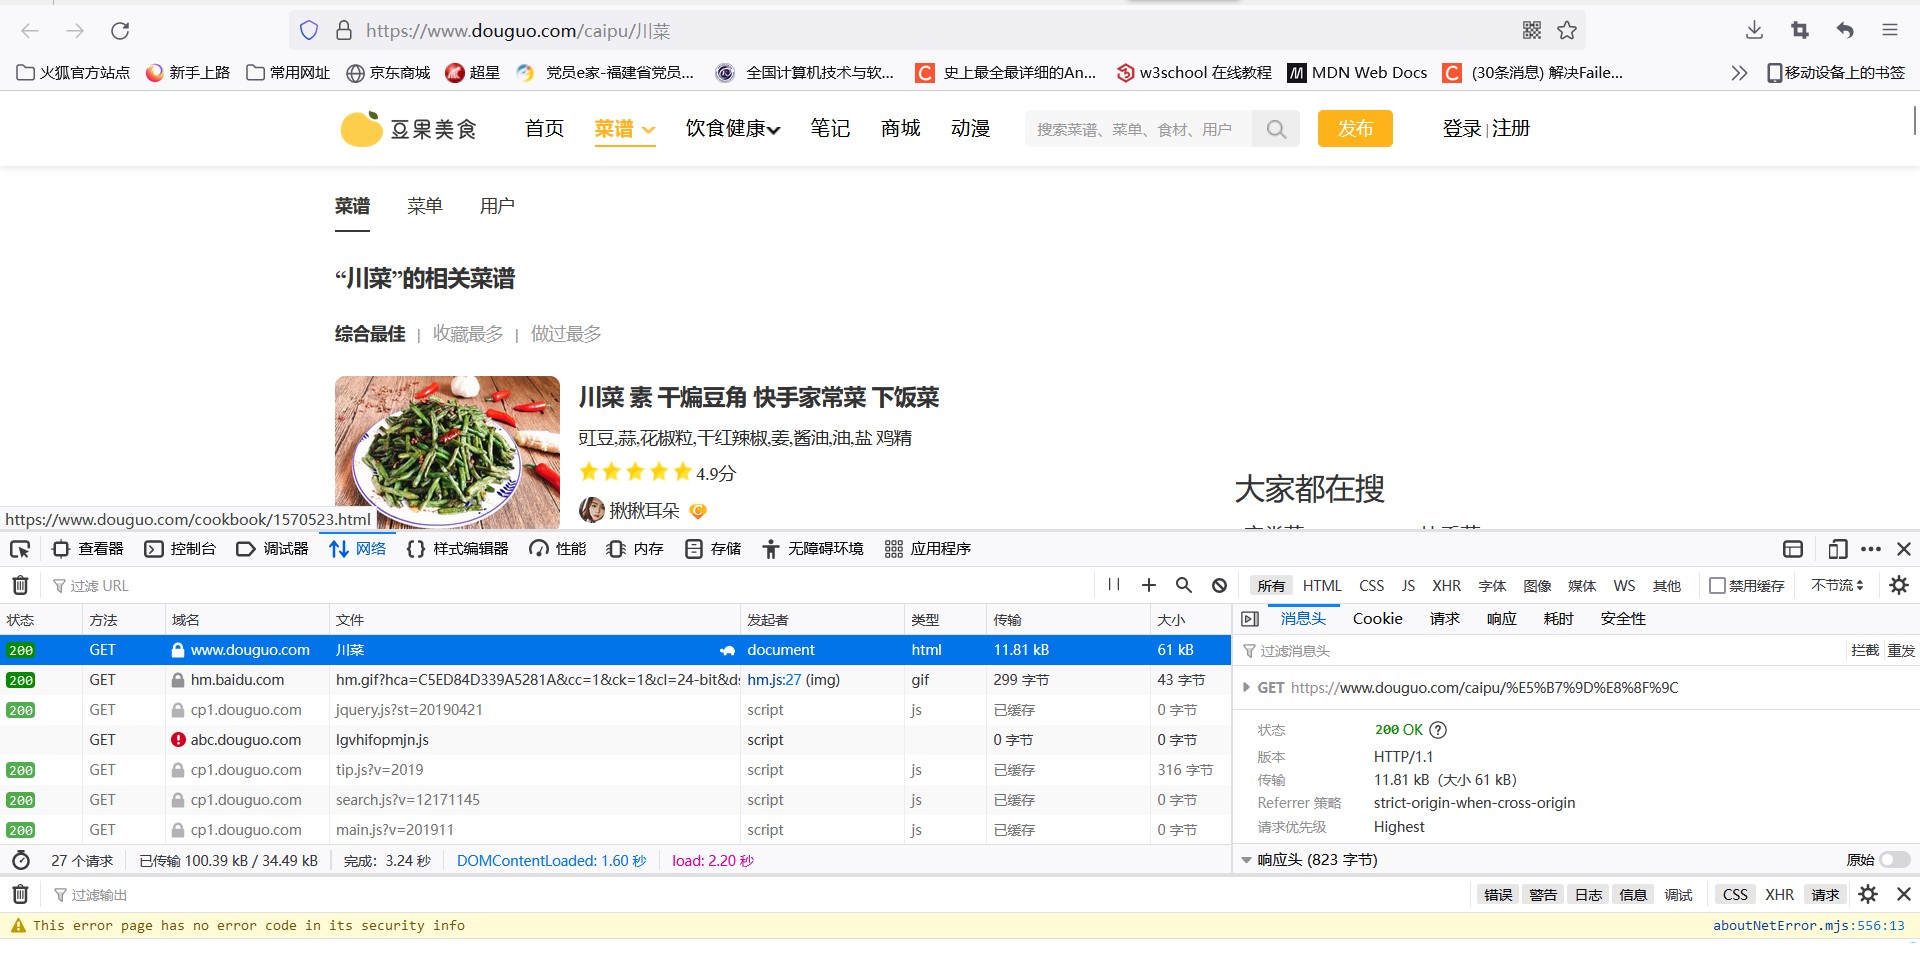
最后进行爬取:
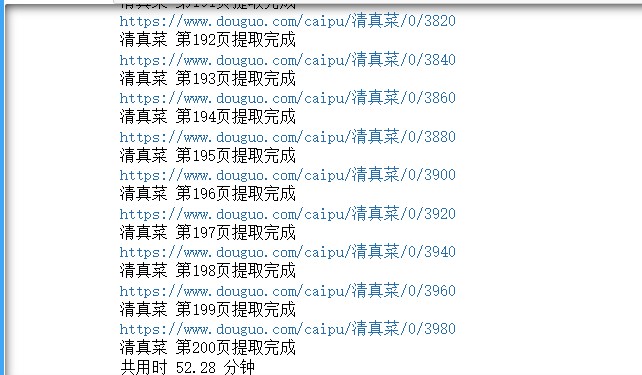
import csv
import time
import random
import requests
import traceback
from time import sleep
from lxml import etree


# 获取首页源码
def get_page(url):
    n = 3
    while True:
        try:
            # sleep(random.uniform(1, 2))  # 随机出现1-2之间的数,包含小数
            headers = {
                'User-Agent': "Mozilla/5.0 (Macintosh; Intel Mac OS X 10_14_6) AppleWebKit/537.36 (KHTML, like Gecko) Chrome/81.0.4044.129 Safari/537.36"
            }
            response = requests.get(url, headers=headers, timeout=10)
            # print(response.text)
            return response.text
        except (TimeoutError, Exception):
            n -= 1
            if n == 0:
                print('请求3次均失败,放弃此url请求,检查请求条件')
                return
            else:
                print('请求失败,重新请求')
                continue


#爬取一页数据
def parse_page(html,caipu):
    try:
        parse = etree.HTML(html)  # 解析网页
        items = parse.xpath('//li[@class="clearfix"]')
        for item in items:
            title = ''.join(item.xpath('./a/@title')).strip()
            href = 'https://www.douguo.com' + ''.join(item.xpath('./div/a/@href')).strip()
            peiliao = ''.join(item.xpath('./div/p/text()')).strip()
            rate = ''.join(item.xpath('./div/div[1]/span[2]/text()')).strip()
            id = ''.join(item.xpath('./div/div[2]/a[1]/text()')).strip()
            img = ''.join(item.xpath('./a/img/@src')).strip()
            item = {
                'title': title,
                'href':  href,
                'peiliao': peiliao,
                'rate': rate,
                'id': id,
                'img': img,
                'caipu':caipu
            }
            # print(item)
            try:
                with open('D:/python/菜谱/caipu.csv', 'a', encoding='utf_8_sig', newline='') as fp:
                    # 'a'为追加模式(添加)
                    # utf_8_sig格式导出csv不乱码
                    fieldnames = ['title','href', 'peiliao', 'rate', 'id','img','caipu']
                    writer = csv.DictWriter(fp, fieldnames)
                    writer.writerow(item)
            except Exception:
                print(traceback.print_exc())  # 代替print e 来输出详细的异常信息
    except Exception:
        print(traceback.print_exc())


# 主函数
def main(x):
    url = 'https://www.douguo.com/caipu/{}/0/{}'.format(caipu,x*20)
    print(url)
    html = get_page(url)
    parse_page(html,caipu)


if __name__ == '__main__':
    caipu_list = ['川菜', '湘菜','粤菜','东北菜','鲁菜','浙菜','湖北菜','清真菜'] #中国菜系
    start = time.time()  # 计时
    for caipu in caipu_list:
        for i in range(200):
            # 爬取多页
            main(x=i)
            time.sleep(random.uniform(1, 2))
            print(caipu,"第" + str(i+1) + "页提取完成")
    end = time.time()
    print('共用时',round((end - start) / 60, 2), '分钟')
2.数据清洗
导入所需的库
import pandas as pd
import numpy as np
import matplotlib.pyplot as plt
from pyecharts import options as opts
from pyecharts.charts import Page, Pie
from pyecharts import options as opts
from pyecharts.charts import Page, Pie
from pyecharts.charts import Bar,Pie
import jieba
from wordcloud import WordCloud
import matplotlib.pyplot as plt
import stylecloud
from IPython.display import Image
import seaborn as sns
plt.rcParams['font.sans-serif'] = ['SimHei']  # 设置加载的字体名
plt.rcParams['axes.unicode_minus'] = False   # 解决保存图像是负号'-'显示为方块的问题
import re
from pyecharts.charts import *
from pyecharts.globals import ThemeType
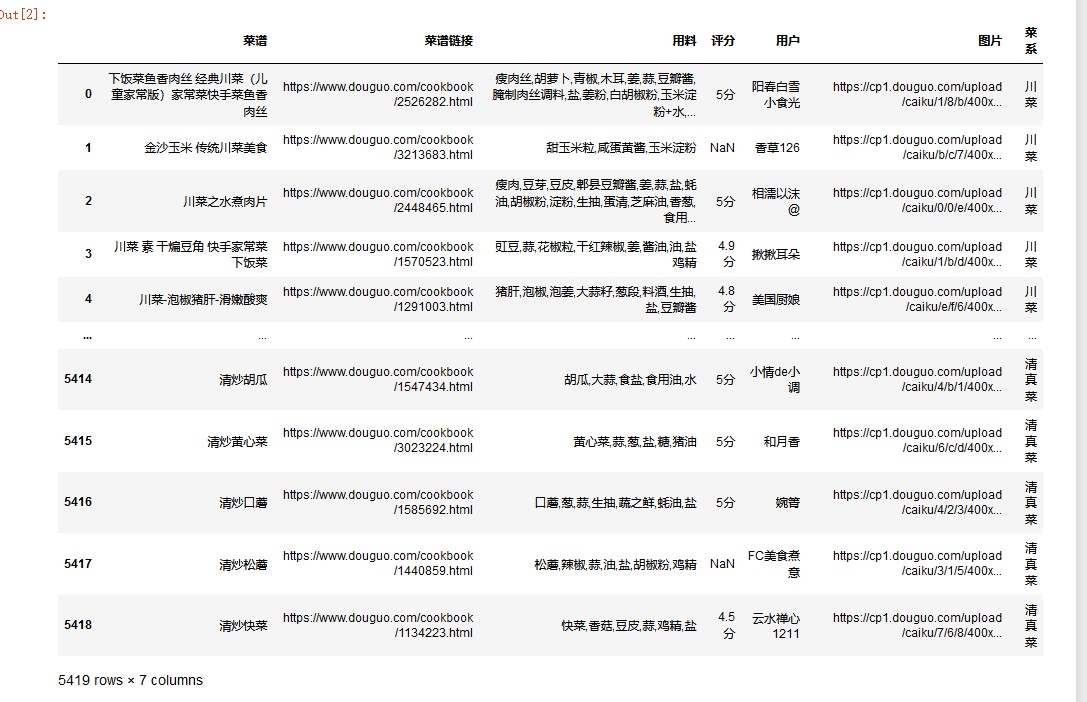
导入数据集
df = pd.read_csv('D:/python/菜谱/caipu.csv'
                 ,names = ['菜谱','菜谱链接', '用料', '评分', '用户','图片','菜系'])
df
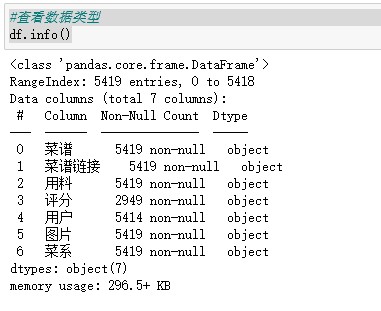
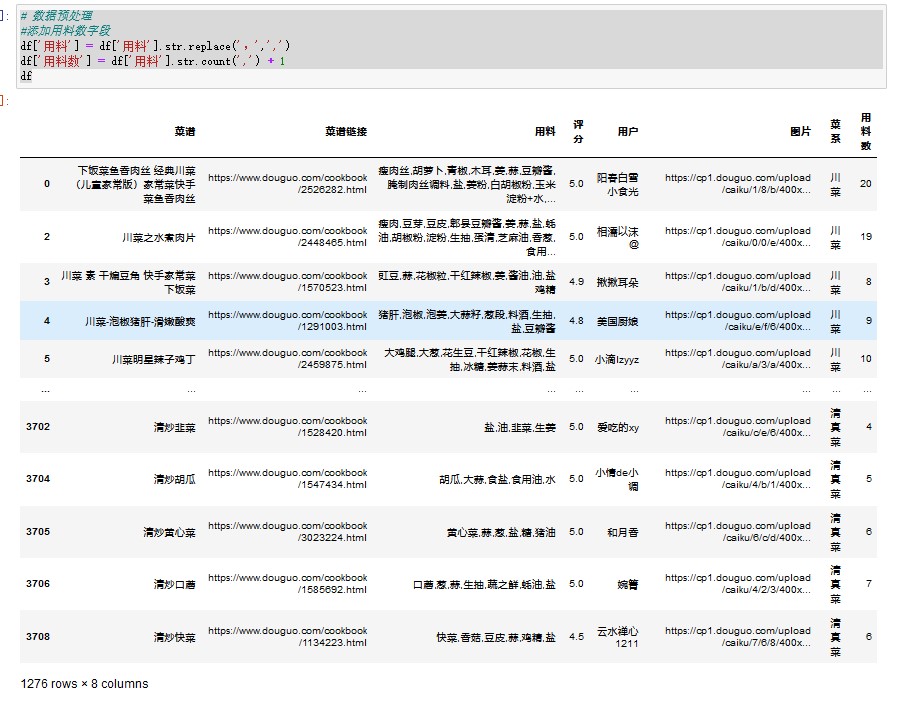
数据处理
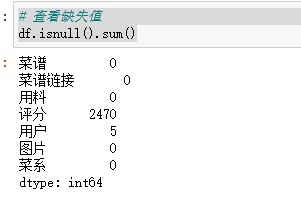
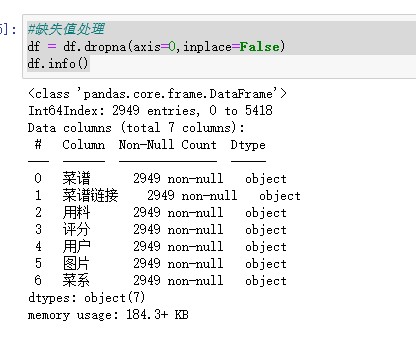
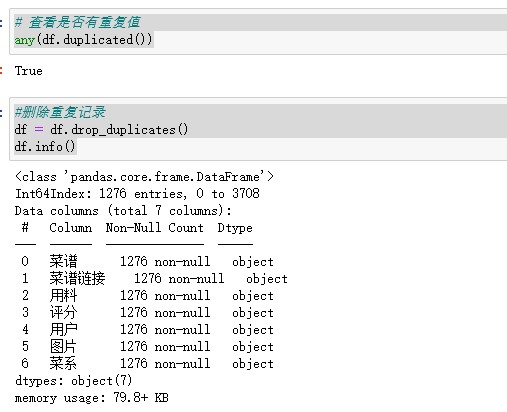
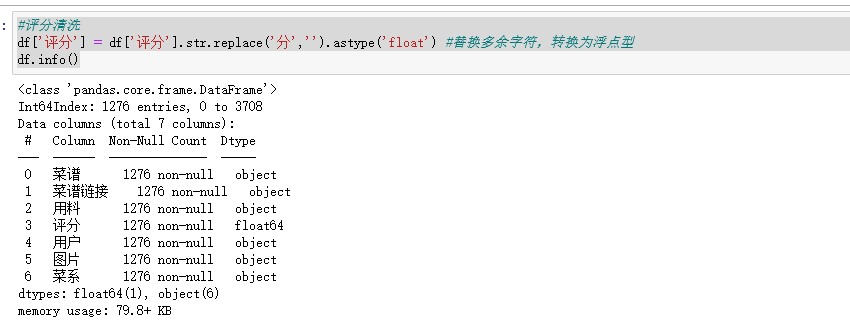
#查看数据类型
df.info()
# 查看缺失值
df.isnull().sum()
#缺失值处理
df = df.dropna(axis=0,inplace=False)
df.info()
# 查看是否有重复值
any(df.duplicated())
#删除重复记录
df = df.drop_duplicates()
df.info()
#评分清洗
df['评分'] = df['评分'].str.replace('分','').astype('float') #替换多余字符,转换为浮点型
df.info()
# 数据预处理
#添加用料数字段
df['用料'] = df['用料'].str.replace(',',',')
df['用料数'] = df['用料'].str.count(',') + 1
df
# 描述性分析
color_map = sns.light_palette('orange', as_cmap=True)  # light_palette调色板
df.describe().style.background_gradient(color_map)
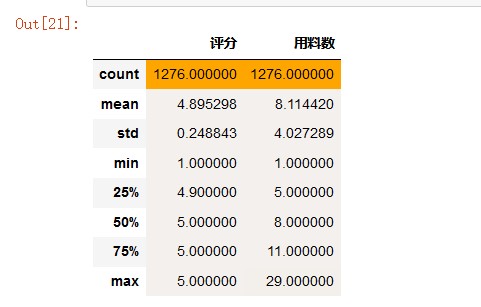
从描述性统计表可知,剔除重复数据后,剩余1276个菜谱
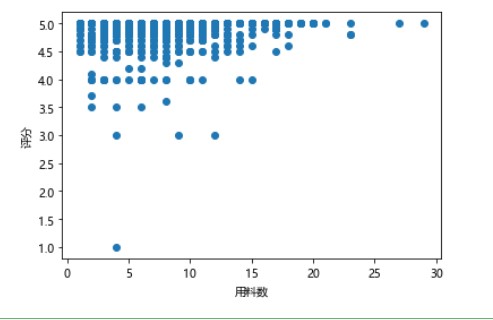
#散点图
import matplotlib.pyplot as plt
plt.rcParams['font.sans-serif']=['Microsoft YaHei'] #用来正常显示中文标签
plt.rcParams['axes.unicode_minus']=True #用来正常显示负号
xs=df['用料数']
ys=df['评分']
# plt.bar(df.用料数,df.评分,color='pink')
plt.xlabel('用料数')
plt.ylabel('评分')
plt.scatter(xs,ys)
plt.show()
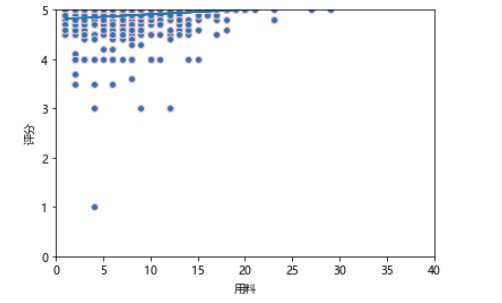
#线性回归
def slope_intercept(x_val,y_val):
    x=np.array(x_val)
    y=np.array(y_val)
    m=(((np.mean(x)*np.mean(y))-np.mean(x*y))/((np.mean(x)*np.mean(x))-np.mean(x*x)))
    m=round(m,2)
    b=(np.mean(y)-np.mean(x)*m)
    b=round(b,2)
    return m,b
m,b=slope_intercept(xs,ys)
reg_line=[(m*x)+b for x in xs]
plt.scatter(xs,ys,edgecolors='pink')
plt.xlim(0,40)
plt.ylim(0,5)
plt.xlabel('用料')
plt.ylabel('评分')
plt.plot(xs,reg_line)
plt.show()
#菜品评分分布
listBins = [0,3,4.9,5] #设置切分区域
listLabels = ['4分及以下','4.1-4.9分','5分'] #设置切分后对应标签
df['评分分布'] = pd.cut(df['评分'], bins=listBins, labels=listLabels, include_lowest=True) #利用pd.cut进行数据离散化切分
df

df2 = df.groupby('评分分布')['评分'].count()
df2 = df2.sort_values(ascending=False)
df2 = df2.round(2)
print(df2)
c = (
        Pie()
        .add(
            "",
            [list(z) for z in zip(df2.index.to_list(),df2.to_list())],
            radius=["20%", "80%"],# 圆环的粗细和大小
            rosetype='area' #玫瑰图
        )
        .set_global_opts(
            title_opts=opts.TitleOpts(title="菜谱评分分布"
                                     ),
            legend_opts=opts.LegendOpts(
                orient="vertical", pos_top="5%", pos_left="2%" ,textstyle_opts=opts.TextStyleOpts(font_size=14)# 左面比例尺
            ),


        )
        .set_series_opts(label_opts=opts.LabelOpts(formatter="{b}:{d}%",font_size=18),
                      )
    )
c.render_notebook()
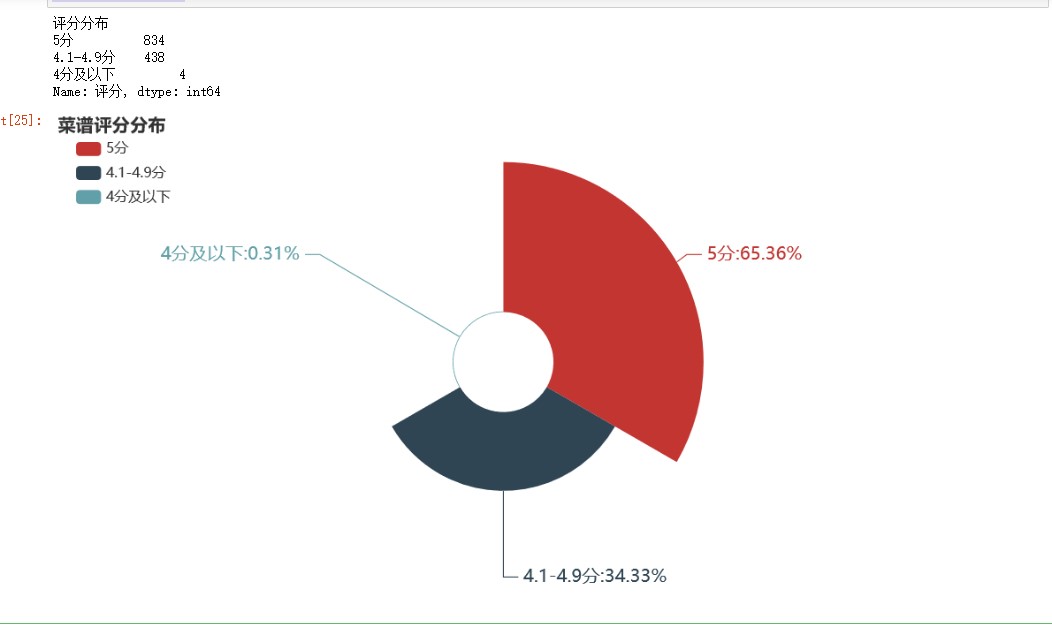
菜谱评分实行5分制。由上图可知,4分以下的菜谱占比不到1%,满分菜谱高达65.36%,可见用户对中国菜系菜谱评价普遍较高。
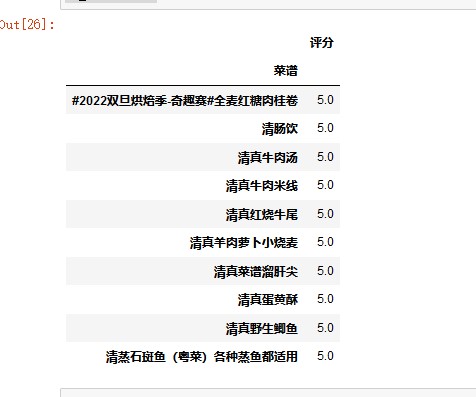
df_score = df.pivot_table(index='菜谱',values='评分')
df_score.sort_values('评分',inplace=True,ascending=False)
df_score[:10]
#菜系占比
df2 = df.groupby('菜系')['评分'].count() #按菜系分组,对评分计数
df2 = df2.sort_values(ascending=False) #降序
print(df2)
c = (
        Pie()
        .add("", [list(z) for z in zip(df2.index.to_list(),df2.to_list())])
        .set_global_opts(title_opts=opts.TitleOpts(title="各菜系菜谱数量占比",subtitle="数据来源:爬虫获取"))
        .set_series_opts(label_opts=opts.LabelOpts(formatter="{b}: {c}",font_size=18))
    )
c.render_notebook()
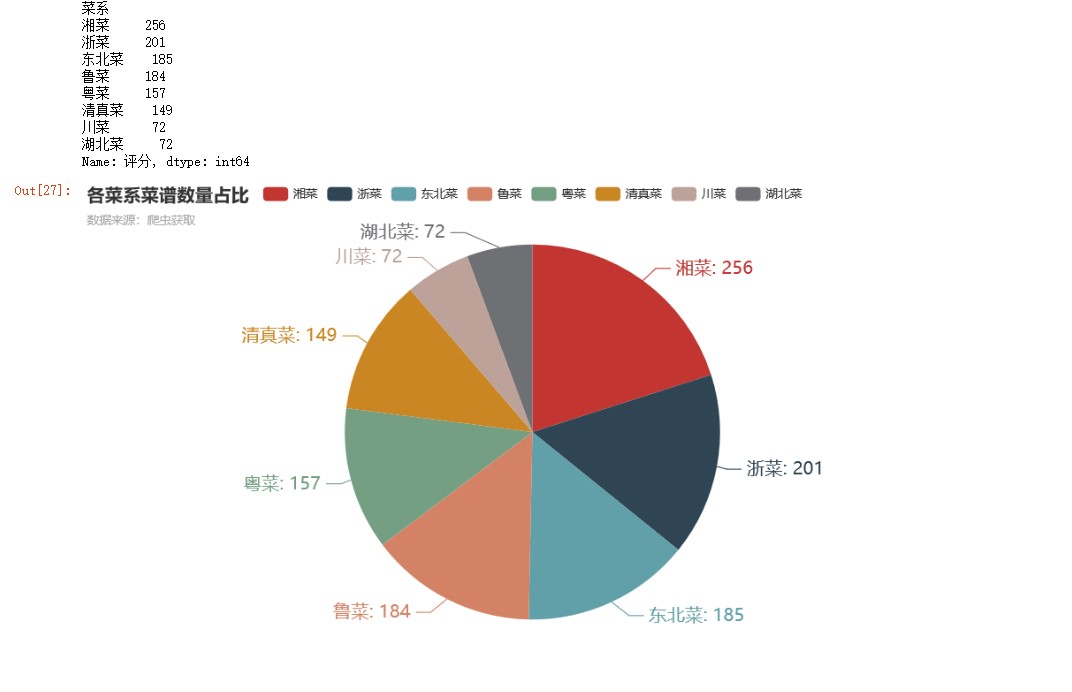
由上图可知,湘菜和浙菜菜谱数量较多,显示出作为中国“八大菜系”成员的地位。湖北菜和川菜菜谱数量较少,相对更为小众
#各菜系平均评分
df2 = df.groupby('菜系')['评分'].mean()
df2 = df2.sort_values(ascending=False)
df2 = df2.round(2)
print(df2)
c = (
        Pie()
        .add(
            "",
            [list(z) for z in zip(df2.index.to_list(),df2.to_list())],
            radius=["40%", "75%"]   # 圆环的粗细和大小

        )
        .set_global_opts(
            title_opts=opts.TitleOpts(title="各菜系平均评分"),
            legend_opts=opts.LegendOpts(
                orient="vertical", pos_top="5%", pos_left="2%"  # 左面比例尺
            ),
        )
        .set_series_opts(label_opts=opts.LabelOpts(formatter="{b}:{c}",font_size=18))
    )
c.render_notebook()
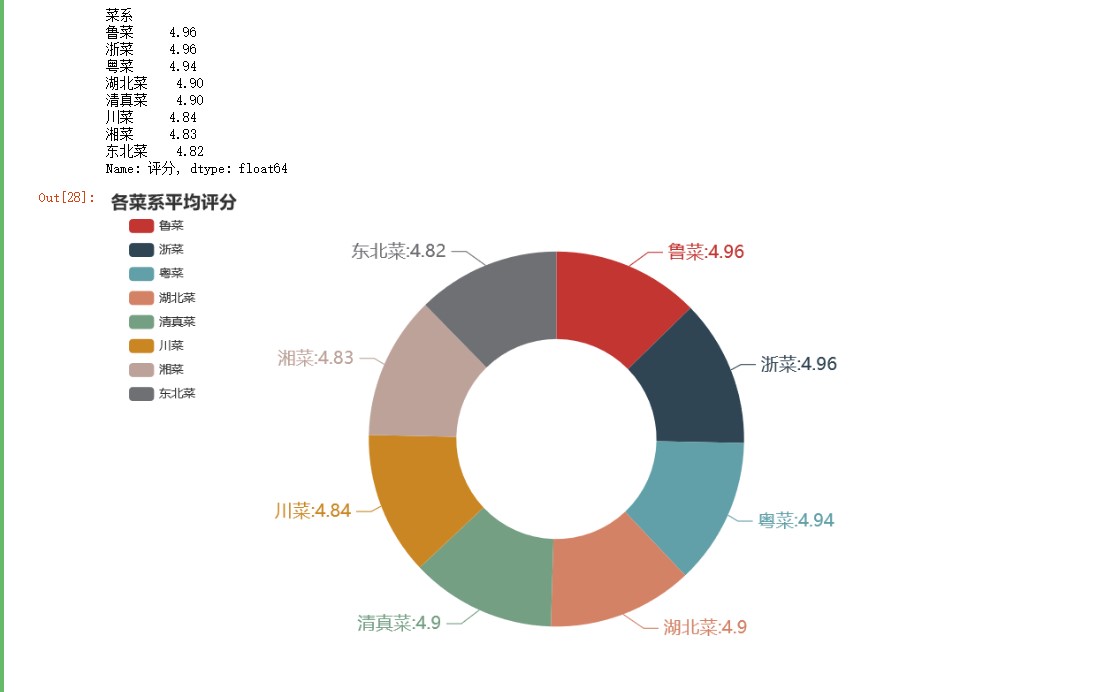
由上图可知,各菜系评分非常接近,用户平均评分都在4.8分以上。相对一致的评分,导致通过用户评分来评价菜谱的可信度降低。
#用料数量
df1 = df.groupby('菜系')['用料数'].mean() #按菜系分组,对评分计数
df1 = df1.sort_values(ascending=False) #降序
df1 = df1.round(0)
print(df1)
bar = Bar()
bar.add_xaxis(df1.index.to_list())
bar.add_yaxis("用料数量",df1.to_list(),color="green")
bar.set_global_opts(title_opts=opts.TitleOpts(title="各菜系用料数量",subtitle="数据来源:爬虫数据"),
                   xaxis_opts=opts.AxisOpts(axislabel_opts=opts.LabelOpts(font_size=18)) #更改横坐标字体大小
                   )
bar.set_series_opts(label_opts=opts.LabelOpts(font_size=16))
bar.render_notebook()
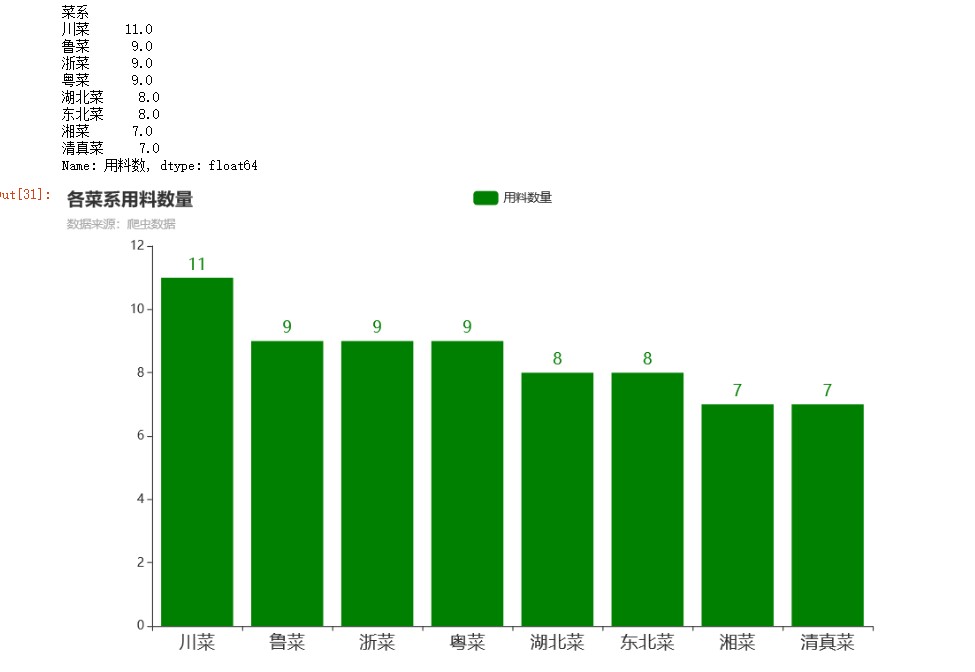
由上图可知,川菜用料最足。川菜素有取材广泛、调味多、菜式多样等特点。
# 定义分词函数
def get_cut_words(content_series):
    # 读入停用词表
    stop_words = []

    with open("stop_words.txt", 'r', encoding='utf-8') as f:
        lines = f.readlines()
        for line in lines:
            stop_words.append(line.strip())

    # 添加关键词
    my_words = ['', '']

    for i in my_words:
        jieba.add_word(i)

    # 自定义停用词
    my_stop_words = ['生抽', '料酒','淀粉','鸡蛋']
    stop_words.extend(my_stop_words)

    # 分词
    word_num = jieba.lcut(content_series.str.cat(sep='。'), cut_all=False)

    # 条件筛选
    word_num_selected = [i for i in word_num if i not in stop_words and len(i)>=2]

    return word_num_selected
# 绘制词云图
text1 = get_cut_words(content_series=df[df['菜系']=='川菜']['用料'])
stylecloud.gen_stylecloud(text=' '.join(text1), max_words=1000,
                          collocations=False,
                          font_path='simhei.ttf',
                          icon_name='fas fa-fish',
                          size=653,
                          output_name='./川菜.jpg')
Image(filename='./川菜.jpg')

由川菜用料词云图可知,川菜主要用料包括花椒、豆瓣酱和干辣椒。不怕辣的四川人喜好种植花椒,四川火锅也因为有了花椒的加入更有吸引力,千千万万的海内外寻味者奔涌相随。料实材真,一般都能出美味。
df1 = df[df['菜系']=='川菜'].groupby('菜谱')['用料数'].max() #按菜系分组,对评分计数
df1 = df1.sort_values(ascending=False) [:3]#降序
df1 = df1.round(0)
print(df1)
bar = Bar()
bar.add_xaxis(df1.index.to_list())
bar.add_yaxis("用料数量",df1.to_list(),color="pink")
bar.set_global_opts(title_opts=opts.TitleOpts(title="川菜用料Top3",subtitle="数据来源:爬虫数据"),
                   xaxis_opts=opts.AxisOpts(axislabel_opts=opts.LabelOpts(font_size=5)) #更改横坐标字体大小
                   )
bar.set_series_opts(label_opts=opts.LabelOpts(font_size=1))
bar.render_notebook()
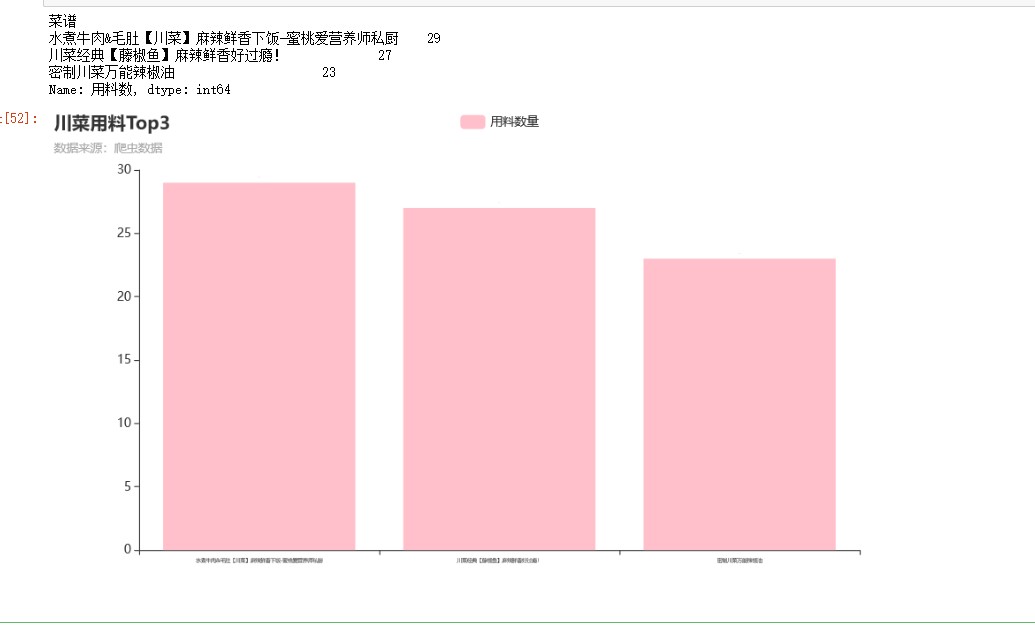
川菜用料最足的菜谱为水煮牛肉&毛肚【川菜】麻辣鲜香下饭-蜜桃爱营养师私厨,共用料29种。
4.附上完整代码
  1 import csv
  2 import time
  3 import random
  4 import requests
  5 import traceback
  6 from time import sleep
  7 from lxml import etree
  8 import pandas as pd
  9 import numpy as np
 10 import matplotlib.pyplot as plt
 11 from pyecharts import options as opts
 12 from pyecharts.charts import Page, Pie
 13 from pyecharts import options as opts
 14 from pyecharts.charts import Page, Pie
 15 from pyecharts.charts import Bar,Pie
 16 import jieba
 17 from wordcloud import WordCloud
 18 import matplotlib.pyplot as plt
 19 import stylecloud
 20 from IPython.display import Image
 21 import seaborn as sns
 22 plt.rcParams['font.sans-serif'] = ['SimHei']  # 设置加载的字体名
 23 plt.rcParams['axes.unicode_minus'] = False   # 解决保存图像是负号'-'显示为方块的问题
 24 import re
 25 from pyecharts.charts import *
 26 from pyecharts.globals import ThemeType
 27
 28 # 获取首页源码
 29 def get_page(url):
 30     n = 3
 31     while True:
 32         try:
 33             # sleep(random.uniform(1, 2))  # 随机出现1-2之间的数,包含小数
 34             headers = {
 35                 'User-Agent': "Mozilla/5.0 (Macintosh; Intel Mac OS X 10_14_6) AppleWebKit/537.36 (KHTML, like Gecko) Chrome/81.0.4044.129 Safari/537.36"
 36             }
 37             response = requests.get(url, headers=headers, timeout=10)
 38             # print(response.text)
 39             return response.text
 40         except (TimeoutError, Exception):
 41             n -= 1
 42             if n == 0:
 43                 print('请求3次均失败,放弃此url请求,检查请求条件')
 44                 return
 45             else:
 46                 print('请求失败,重新请求')
 47                 continue
 48
 49
 50 #爬取一页数据
 51 def parse_page(html,caipu):
 52     try:
 53         parse = etree.HTML(html)  # 解析网页
 54         items = parse.xpath('//li[@class="clearfix"]')
 55         for item in items:
 56             title = ''.join(item.xpath('./a/@title')).strip()
 57             href = 'https://www.douguo.com' + ''.join(item.xpath('./div/a/@href')).strip()
 58             peiliao = ''.join(item.xpath('./div/p/text()')).strip()
 59             rate = ''.join(item.xpath('./div/div[1]/span[2]/text()')).strip()
 60             id = ''.join(item.xpath('./div/div[2]/a[1]/text()')).strip()
 61             img = ''.join(item.xpath('./a/img/@src')).strip()
 62             item = {
 63                 'title': title,
 64                 'href':  href,
 65                 'peiliao': peiliao,
 66                 'rate': rate,
 67                 'id': id,
 68                 'img': img,
 69                 'caipu':caipu
 70             }
 71             # print(item)
 72             try:
 73                 with open('D:/python/菜谱/caipu.csv', 'a', encoding='utf_8_sig', newline='') as fp:
 74                     # 'a'为追加模式(添加)
 75                     # utf_8_sig格式导出csv不乱码
 76                     fieldnames = ['title','href', 'peiliao', 'rate', 'id','img','caipu']
 77                     writer = csv.DictWriter(fp, fieldnames)
 78                     writer.writerow(item)
 79             except Exception:
 80                 print(traceback.print_exc())  # 代替print e 来输出详细的异常信息
 81     except Exception:
 82         print(traceback.print_exc())
 83
 84
 85 # 主函数
 86 def main(x):
 87     url = 'https://www.douguo.com/caipu/{}/0/{}'.format(caipu,x*20)
 88     print(url)
 89     html = get_page(url)
 90     parse_page(html,caipu)
 91
 92
 93 if __name__ == '__main__':
 94     caipu_list = ['川菜', '湘菜','粤菜','东北菜','鲁菜','浙菜','湖北菜','清真菜'] #中国菜系
 95     start = time.time()  # 计时
 96     for caipu in caipu_list:
 97         for i in range(200):
 98             # 爬取多页
 99             main(x=i)
100             time.sleep(random.uniform(1, 2))
101             print(caipu,"第" + str(i+1) + "页提取完成")
102     end = time.time()
103     print('共用时',round((end - start) / 60, 2), '分钟')
104
105 df = pd.read_csv('D:/python/菜谱/caipu.csv'
106                  ,names = ['菜谱','菜谱链接', '用料', '评分', '用户','图片','菜系'])
107 df
108 #查看数据类型
109 df.info()
110 # 查看缺失值
111 df.isnull().sum()
112 #缺失值处理
113 df = df.dropna(axis=0,inplace=False)
114 df.info()
115 # 查看是否有重复值
116 any(df.duplicated())
117 #删除重复记录
118 df = df.drop_duplicates()
119 df.info()
120 #评分清洗
121 df['评分'] = df['评分'].str.replace('分','').astype('float') #替换多余字符,转换为浮点型
122 df.info()
123 # 数据预处理
124 #添加用料数字段
125 df['用料'] = df['用料'].str.replace(',',',')
126 df['用料数'] = df['用料'].str.count(',') + 1
127 df
128 # 描述性分析
129 color_map = sns.light_palette('orange', as_cmap=True)  # light_palette调色板
130 df.describe().style.background_gradient(color_map)
131 #散点图
132 import matplotlib.pyplot as plt
133 plt.rcParams['font.sans-serif']=['Microsoft YaHei'] #用来正常显示中文标签
134 plt.rcParams['axes.unicode_minus']=True #用来正常显示负号
135 xs=df['用料数']
136 ys=df['评分']
137 # plt.bar(df.用料数,df.评分,color='pink')
138 plt.xlabel('用料数')
139 plt.ylabel('评分')
140 plt.scatter(xs,ys)
141 plt.show()
142 #线性回归
143 def slope_intercept(x_val,y_val):
144     x=np.array(x_val)
145     y=np.array(y_val)
146     m=(((np.mean(x)*np.mean(y))-np.mean(x*y))/((np.mean(x)*np.mean(x))-np.mean(x*x)))
147     m=round(m,2)
148     b=(np.mean(y)-np.mean(x)*m)
149     b=round(b,2)
150     return m,b
151 m,b=slope_intercept(xs,ys)
152 reg_line=[(m*x)+b for x in xs]
153 plt.scatter(xs,ys,edgecolors='pink')
154 plt.xlim(0,40)
155 plt.ylim(0,5)
156 plt.xlabel('用料')
157 plt.ylabel('评分')
158 plt.plot(xs,reg_line)
159 plt.show()
160 #菜品评分分布
161 listBins = [0,3,4.9,5] #设置切分区域
162 listLabels = ['4分及以下','4.1-4.9分','5分'] #设置切分后对应标签
163 df['评分分布'] = pd.cut(df['评分'], bins=listBins, labels=listLabels, include_lowest=True) #利用pd.cut进行数据离散化切分
164 df
165 df2 = df.groupby('评分分布')['评分'].count()
166 df2 = df2.sort_values(ascending=False)
167 df2 = df2.round(2)
168 print(df2)
169 c = (
170         Pie()
171         .add(
172             "",
173             [list(z) for z in zip(df2.index.to_list(),df2.to_list())],
174             radius=["20%", "80%"],# 圆环的粗细和大小
175             rosetype='area' #玫瑰图
176         )
177         .set_global_opts(
178             title_opts=opts.TitleOpts(title="菜谱评分分布"
179                                      ),
180             legend_opts=opts.LegendOpts(
181                 orient="vertical", pos_top="5%", pos_left="2%" ,textstyle_opts=opts.TextStyleOpts(font_size=14)# 左面比例尺
182             ),
183
184
185         )
186         .set_series_opts(label_opts=opts.LabelOpts(formatter="{b}:{d}%",font_size=18),
187                       )
188     )
189 c.render_notebook()
190 df_score = df.pivot_table(index='菜谱',values='评分')
191 df_score.sort_values('评分',inplace=True,ascending=False)
192 df_score[:10]
193 #菜系占比
194 df2 = df.groupby('菜系')['评分'].count() #按菜系分组,对评分计数
195 df2 = df2.sort_values(ascending=False) #降序
196 print(df2)
197 c = (
198         Pie()
199         .add("", [list(z) for z in zip(df2.index.to_list(),df2.to_list())])
200         .set_global_opts(title_opts=opts.TitleOpts(title="各菜系菜谱数量占比",subtitle="数据来源:爬虫获取"))
201         .set_series_opts(label_opts=opts.LabelOpts(formatter="{b}: {c}",font_size=18))
202     )
203 c.render_notebook()
204 #各菜系平均评分
205 df2 = df.groupby('菜系')['评分'].mean()
206 df2 = df2.sort_values(ascending=False)
207 df2 = df2.round(2)
208 print(df2)
209 c = (
210         Pie()
211         .add(
212             "",
213             [list(z) for z in zip(df2.index.to_list(),df2.to_list())],
214             radius=["40%", "75%"]   # 圆环的粗细和大小
215
216         )
217         .set_global_opts(
218             title_opts=opts.TitleOpts(title="各菜系平均评分"),
219             legend_opts=opts.LegendOpts(
220                 orient="vertical", pos_top="5%", pos_left="2%"  # 左面比例尺
221             ),
222         )
223         .set_series_opts(label_opts=opts.LabelOpts(formatter="{b}:{c}",font_size=18))
224     )
225 c.render_notebook()
226 #用料数量
227 df1 = df.groupby('菜系')['用料数'].mean() #按菜系分组,对评分计数
228 df1 = df1.sort_values(ascending=False) #降序
229 df1 = df1.round(0)
230 print(df1)
231 bar = Bar()
232 bar.add_xaxis(df1.index.to_list())
233 bar.add_yaxis("用料数量",df1.to_list(),color="green")
234 bar.set_global_opts(title_opts=opts.TitleOpts(title="各菜系用料数量",subtitle="数据来源:爬虫数据"),
235                    xaxis_opts=opts.AxisOpts(axislabel_opts=opts.LabelOpts(font_size=18)) #更改横坐标字体大小
236                    )
237 bar.set_series_opts(label_opts=opts.LabelOpts(font_size=16))
238 bar.render_notebook()
239 # 定义分词函数
240 def get_cut_words(content_series):
241     # 读入停用词表
242     stop_words = []
243
244     with open("stop_words.txt", 'r', encoding='utf-8') as f:
245         lines = f.readlines()
246         for line in lines:
247             stop_words.append(line.strip())
248
249     # 添加关键词
250     my_words = ['', '']
251
252     for i in my_words:
253         jieba.add_word(i)
254
255     # 自定义停用词
256     my_stop_words = ['生抽', '料酒','淀粉','鸡蛋']
257     stop_words.extend(my_stop_words)
258
259     # 分词
260     word_num = jieba.lcut(content_series.str.cat(sep='。'), cut_all=False)
261
262     # 条件筛选
263     word_num_selected = [i for i in word_num if i not in stop_words and len(i)>=2]
264
265     return word_num_selected
266 # 绘制词云图
267 text1 = get_cut_words(content_series=df[df['菜系']=='川菜']['用料'])
268 stylecloud.gen_stylecloud(text=' '.join(text1), max_words=1000,
269                           collocations=False,
270                           font_path='simhei.ttf',
271                           icon_name='fas fa-fish',
272                           size=653,
273                           output_name='./川菜.jpg')
274 Image(filename='./川菜.jpg')
275 df1 = df[df['菜系']=='川菜'].groupby('菜谱')['用料数'].max() #按菜系分组,对评分计数
276 df1 = df1.sort_values(ascending=False) [:3]#降序
277 df1 = df1.round(0)
278 print(df1)
279 bar = Bar()
280 bar.add_xaxis(df1.index.to_list())
281 bar.add_yaxis("用料数量",df1.to_list(),color="pink")
282 bar.set_global_opts(title_opts=opts.TitleOpts(title="川菜用料Top3",subtitle="数据来源:爬虫数据"),
283                    xaxis_opts=opts.AxisOpts(axislabel_opts=opts.LabelOpts(font_size=5)) #更改横坐标字体大小
284                    )
285 bar.set_series_opts(label_opts=opts.LabelOpts(font_size=1))
286 bar.render_notebook()
四、总结
通过以上的数据分析,我们直观的看到八大菜系中各有什么特色菜,哪些特色菜喜欢的人群相对比较多,值得推荐,大致可以获得以下几点启发:
1.八大菜系中,湘菜菜系的菜谱占比最多
2.八大菜系中,川菜系的菜谱用料最多
3.菜谱评价普遍较高。

 浙公网安备 33010602011771号