


一、Grafana5.3安装及配置
官方下载
https://grafana.com/grafana/download/5.3.4
http://docs.grafana.org/installation/rpm/
1.下载 rpm 包
wget https://dl.grafana.com/oss/release/grafana-5.3.4-1.x86_64.rpm
2.安装本地rpm包
yum -y localinstall grafana-5.3.4-1.x86_64.rpm

3.安装图像呈现组件
yum -y install fontconfig
yum -y install freetype*
yum -y install urw-fonts
4.启动grafana,并设置开机启动
$ systemctl daemon-reload
$ systemctl start grafana-server
$ systemctl status grafana-server
sudo systemctl enable grafana-server.service

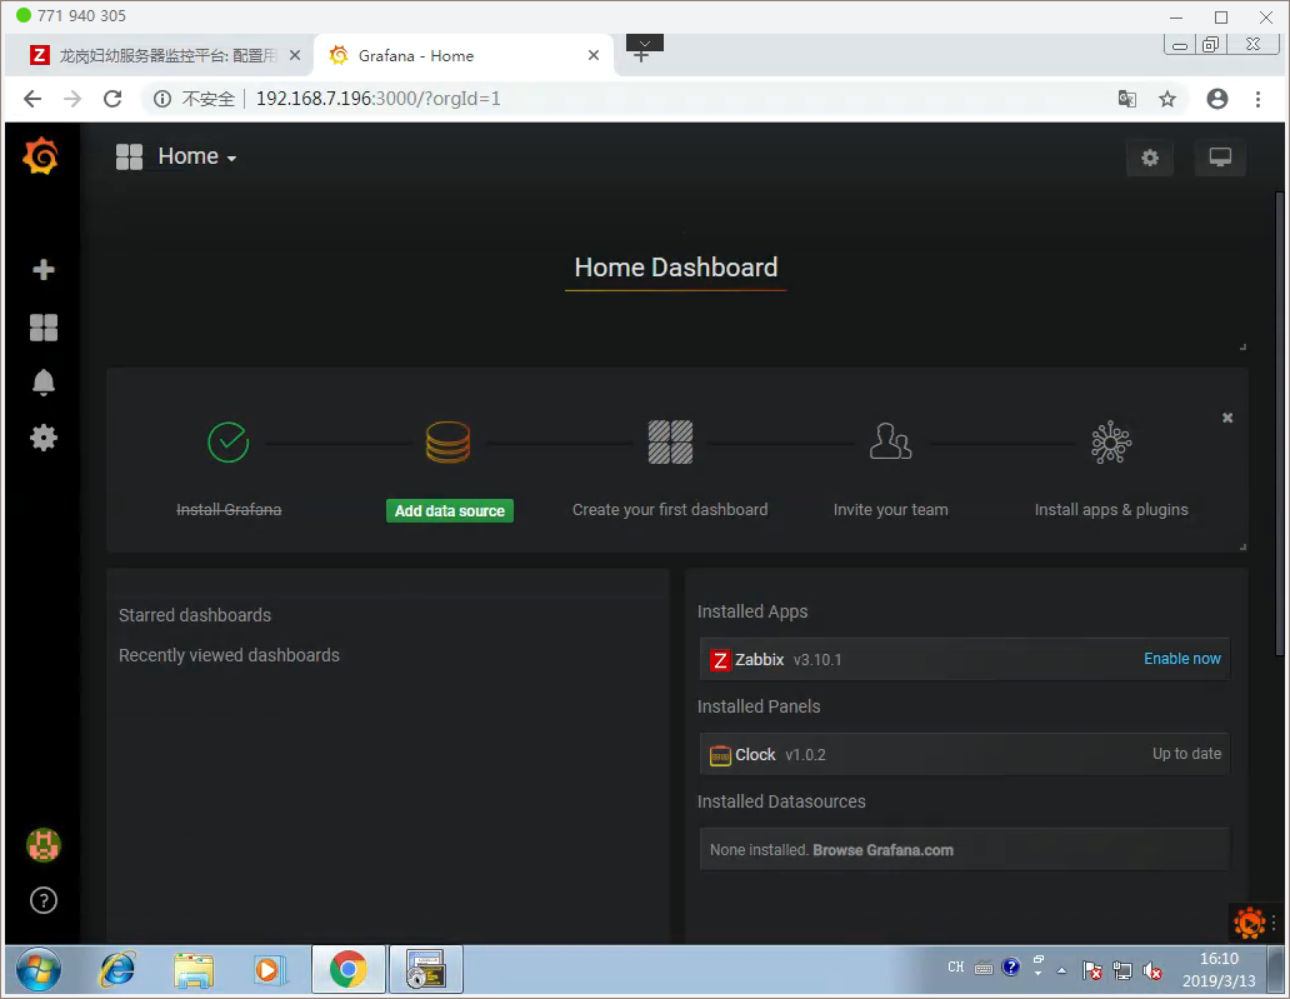
5. 访问Grafana
地址:http://ServerIP:3000
默认登录用户名密码:admin/admin
二、Grafana插件
官方文档
http://docs.grafana.org/plugins/installation/
插件网址
https://grafana.com/plugins
Grafana-cli命令
列出可用的插件
grafana-cli plugins list-remote
列出已安装的插件
grafana-cli plugins ls
安装最新版本的插件
grafana-cli plugins install <plugin-id>
安装特定版本的插件
grafana-cli plugins install <plugin-id> <version>
删除一个插件
grafana-cli plugins remove <plugin-id>
更新所有已安装的插件
grafana-cli plugins update-all
更新一个插件
grafana-cli plugins update <plugin-id>
三、结合Zabbix3.4实现可视化图形监控
1.安装grafana-zabbix插件
grafana-cli plugins install alexanderzobnin-zabbix-app
2.安装grafana-clock-panel插件
grafana-cli plugins install grafana-clock-panel
3.安装插件要重启grafana服务
service restart grafana-server
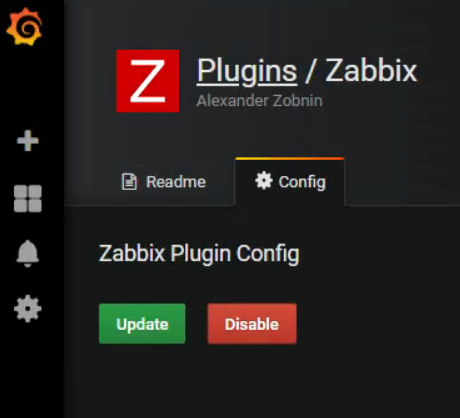
4.插件中配置 开启
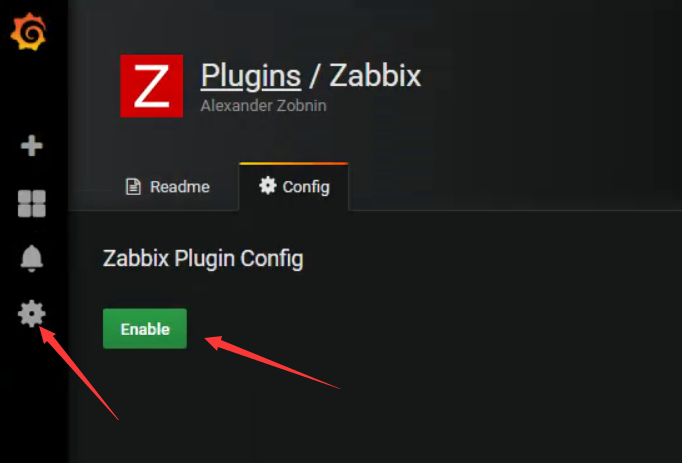 1
1
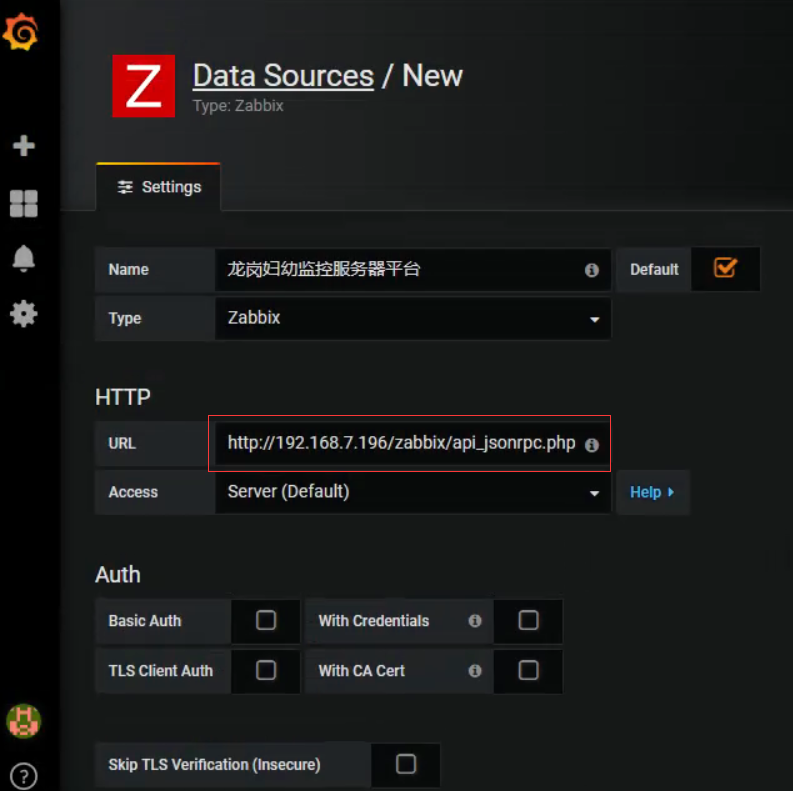
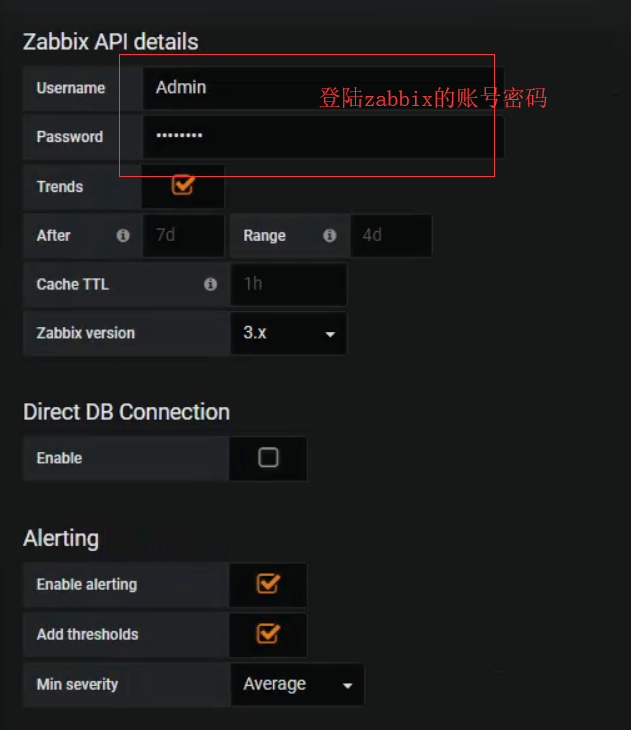
5.配置zabbix数据源

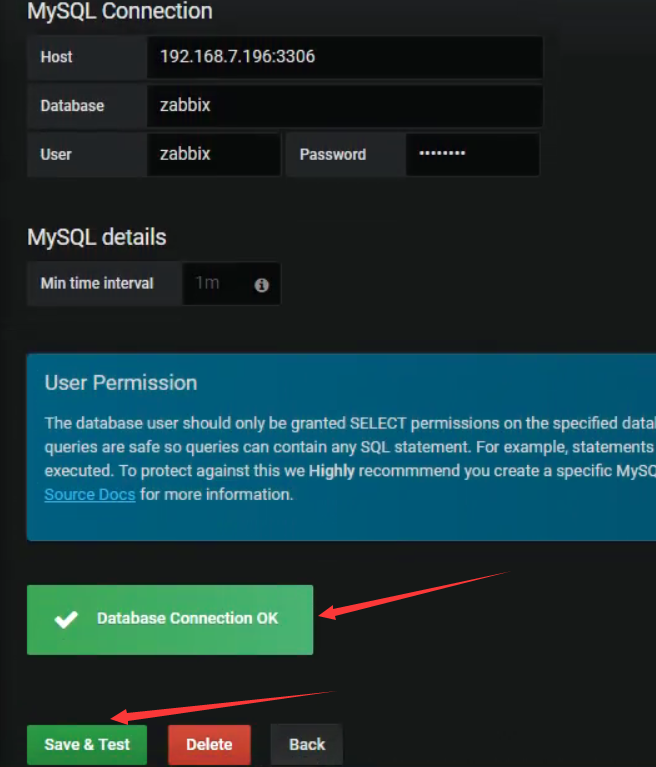
6.配置zabbix服务器MySQL数据源

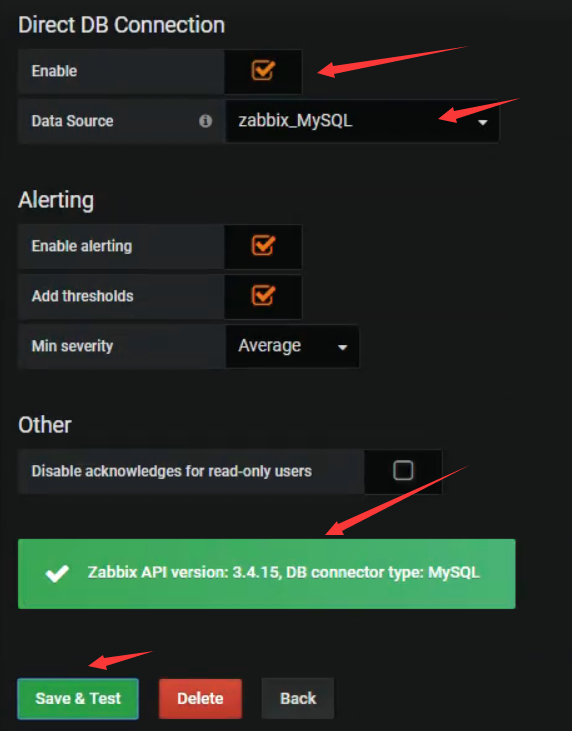
7.将MySQL源添加到zabbix源中
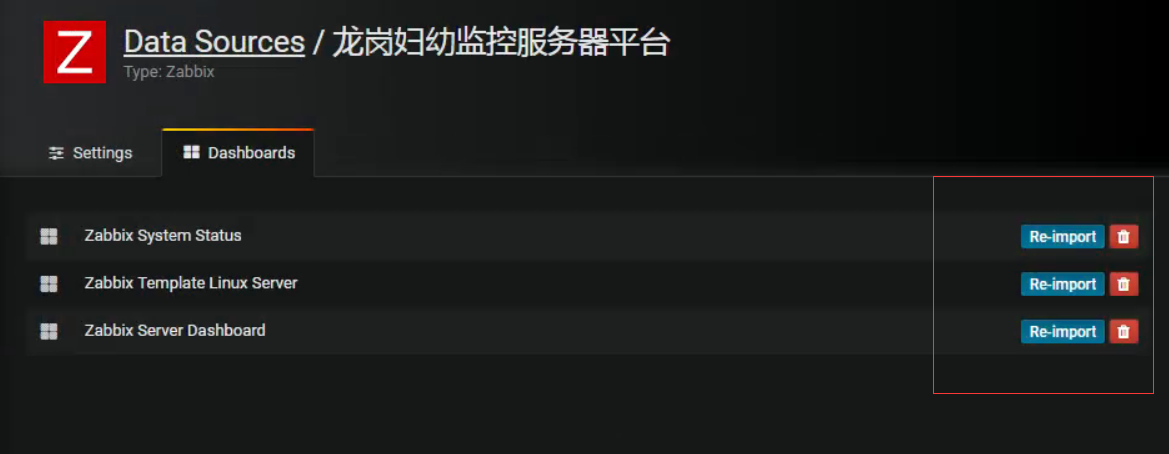
8.导入模板
9. 最后提供以下官方提供的模板地址,可以导出想要的地址到自己的系统中,然后编辑相应内容
地址:http://play.grafana-zabbix.org/dashboard/db/grafana-zabbix-demo
参考链接:
https://www.cnblogs.com/zengqinglei/p/6503548.html

 浙公网安备 33010602011771号