prometheus监控安装
下载软件:
wget https://github.com/prometheus/prometheus/releases/download/v2.28.0/prometheus-2.28.0.linux-amd64.tar.gz
解压
tar -zxf prometheus-2.28.0.linux-amd64.tar.gz
移动文件并重命名:
mv prometheus-2.28.0.linux-amd64 /usr/local/prometheus-2.28.0
启动:
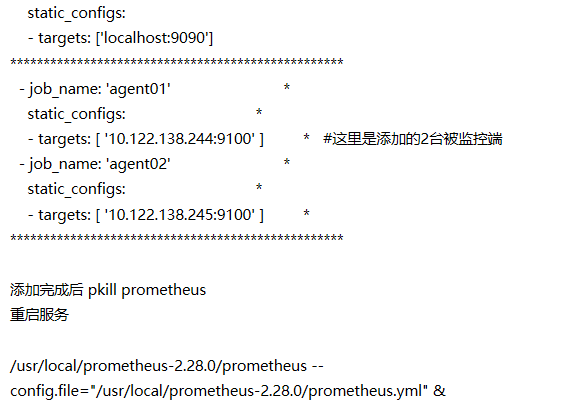
/usr/local/prometheus-2.28.0/prometheus --config.file="/usr/local/prometheus-2.28.0/prometheus.yml" &
浏览器输入 http://ip:9090
默认只监控了本机,点 Status --> 点 Targets --> 可以看到只监控了本机。
vim /usr/local/prometheus-2.28.0/prometheus.yml
被监控端配置
wget https://github.com/prometheus/node_exporter/releases/download/v1.1.2/node_exporter-1.1.2.linux-amd64.tar.gz
tar -zxf node_exporter-1.1.2.linux-amd64.tar.gz
mv node_exporter-1.1.2.linux-amd64 /usr/local/node_exporter-1.1.2
cd /usr/local/node_exporter-1.1.2/
ll
nohup /usr/local/node_exporter-1.1.2/node_exporter &
通过浏览器访问 http://被监控端ip:9100/metrics 就可以查看到node_exporter在被监控端收集的监控信息
[root@k8s-master01 ~]# cat  /etc/systemd/system/prometheus.service
[Unit]

Description=Prometheus

Documentation=https://prometheus.io/

After=network.target


[Service]

# Type设置为notify时,服务会不断重启

Type=simple

User=root
Group=root

# --storage.tsdb.path是可选项,默认数据目录在运行目录的./dada目录中

ExecStart=/usr/local/prometheus-2.28.0/prometheus  --config.file=/usr/local/prometheus-2.28.0/prometheus.yml --web.enable-lifecycle --web.listen-address "0.0.0.0:9090" --web.enable-admin-api
Restart=on-failure
[Install]
WantedBy=multi-user.target
systemctl enable prometheus
prometheus热重启:curl -XPOST http://localhost:9090/-/reload

 浙公网安备 33010602011771号