

python绘制基础折线图
import matplotlib.pyplot as plt
# 准备数据,可用 numpy 数组
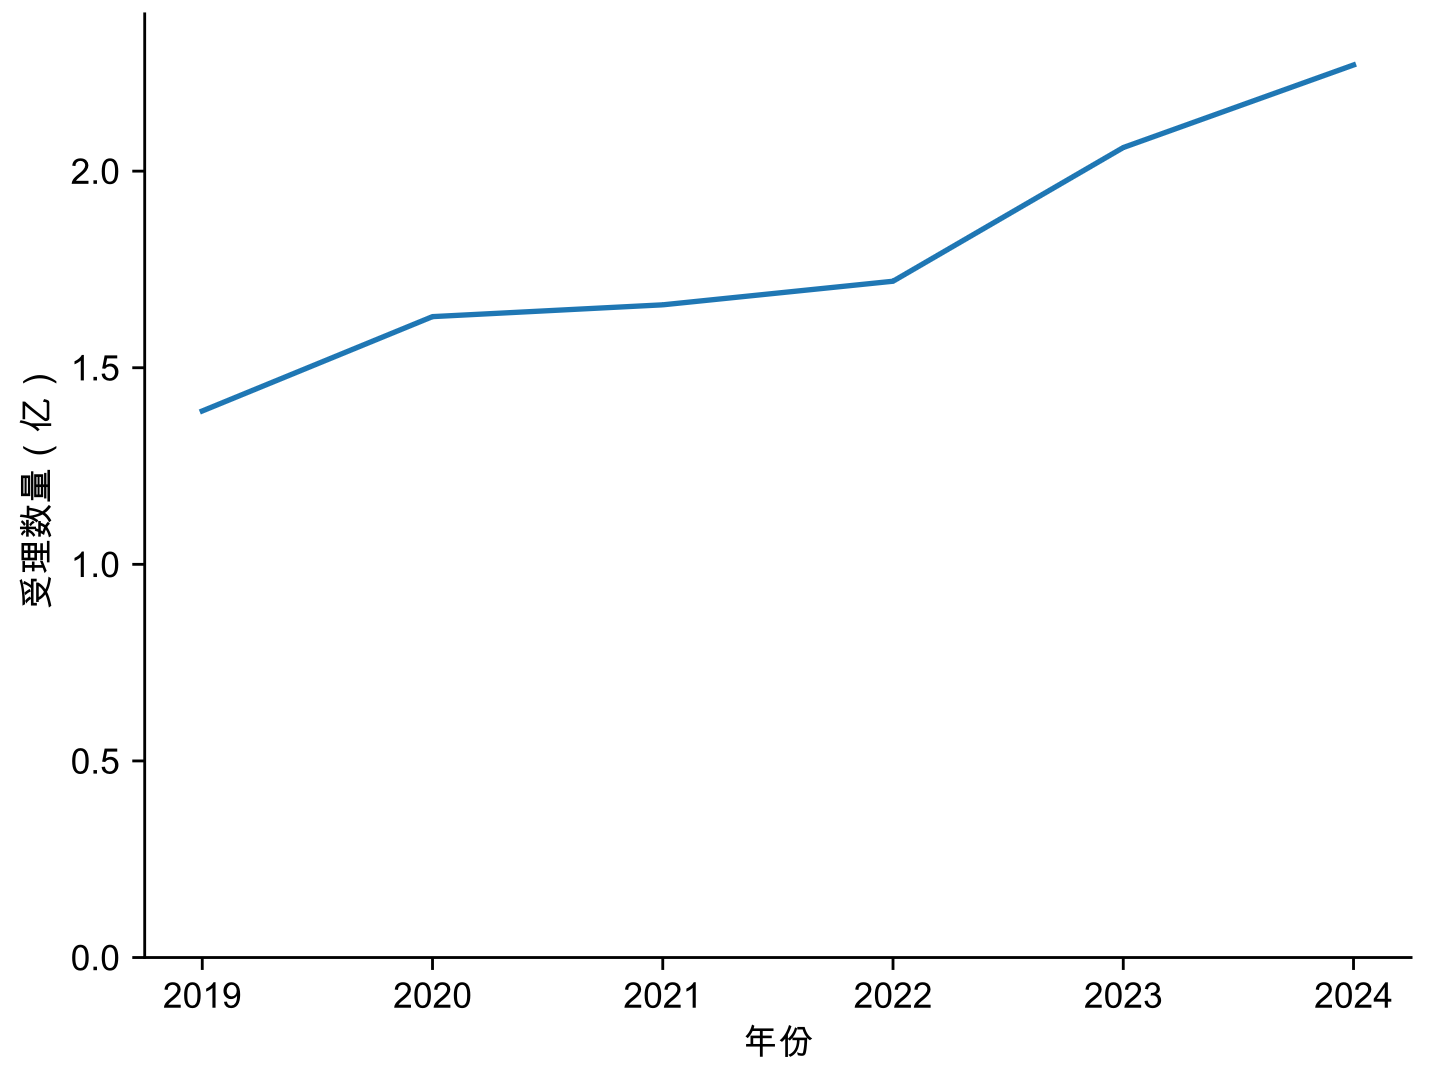
x = [2019, 2020, 2021, 2022, 2023, 2024]
y= [1.39, 1.63, 1.66, 1.72, 2.06, 2.27]
fig, ax = plt.subplots()
ax.plot(x, y)
# 设置 y 轴范围
ax.set_ylim(0, 2.4)
plt.xlabel("年份")
plt.ylabel("受理数量(亿)")
ax.spines['top'].set_visible(False)
ax.spines['right'].set_visible(False)
# 设置中文字体
plt.rcParams['font.sans-serif'] = ['Arial Unicode MS']
plt.savefig("output.pdf", format="pdf", dpi=300, bbox_inches="tight")
plt.show()

 浙公网安备 33010602011771号