【菜鸟入门R语言】利用R语言画箱线图
初学R语言,本练习需要理解的概念及函数
- read.csv() 与 read.table的差异,其预设参数是不一样
- R语言常用的数据结构——数据框
- R语言基础绘图函数——boxplok
- file.choose()的便捷性
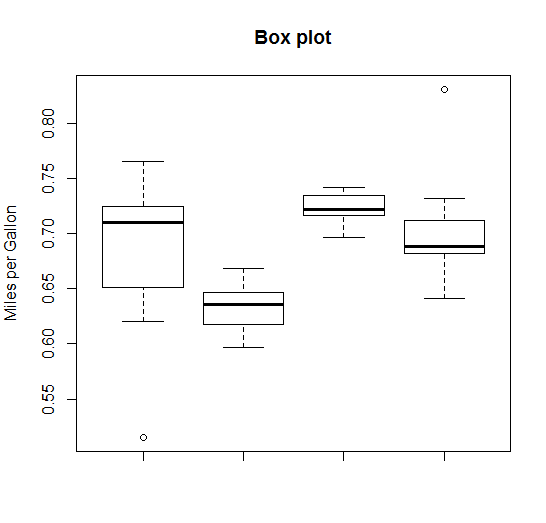
测试数据集(一批叶片的含水量)
D1,D2,F1,F2
0.679641425,0.616778578,0.701144926,0.672956514
0.642314436,0.5971385,0.737413255,0.641572101
0.709085818,0.60899459,0.705355777,0.687002982
0.657954033,0.611996585,0.7072,0.705341898
0.515342052,0.635512484,0.742316785,0.683508708
0.766070565,0.618644792,0.722236912,0.643619814
0.620027913,0.648732311,0.723470559,0.830927014
0.644486452,0.620531447,0.721645731,0.689307739
0.751831913,0.64511406,0.71731337,0.68235871
0.723698782,0.647748712,0.737846154,0.682436765
0.741531361,0.637055298,0.722557568,0.716312057
0.710610932,0.649346195,0.734561213,0.725098962
0.71503386,0.618976412,0.716650141,0.700668069
0.724870839,0.668632951,0.742448331,0.731794347
0.725080386,0.642141337,0.718728947,0.707714228
0.66234676,,0.724969843,0.68650108
,,0.696793849,
R语言代码
mtcars <- read.csv(file.choose())
boxplot(mtcars$D1,mtcars$D2,mtcars$F1,mtcars$F2,main="Box plot",ylab ="%")
运行结果

 浙公网安备 33010602011771号