
matplotlib画图工具/绘制散点图
绘制散点图
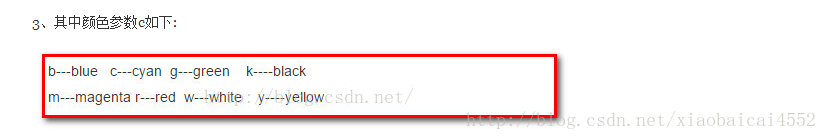
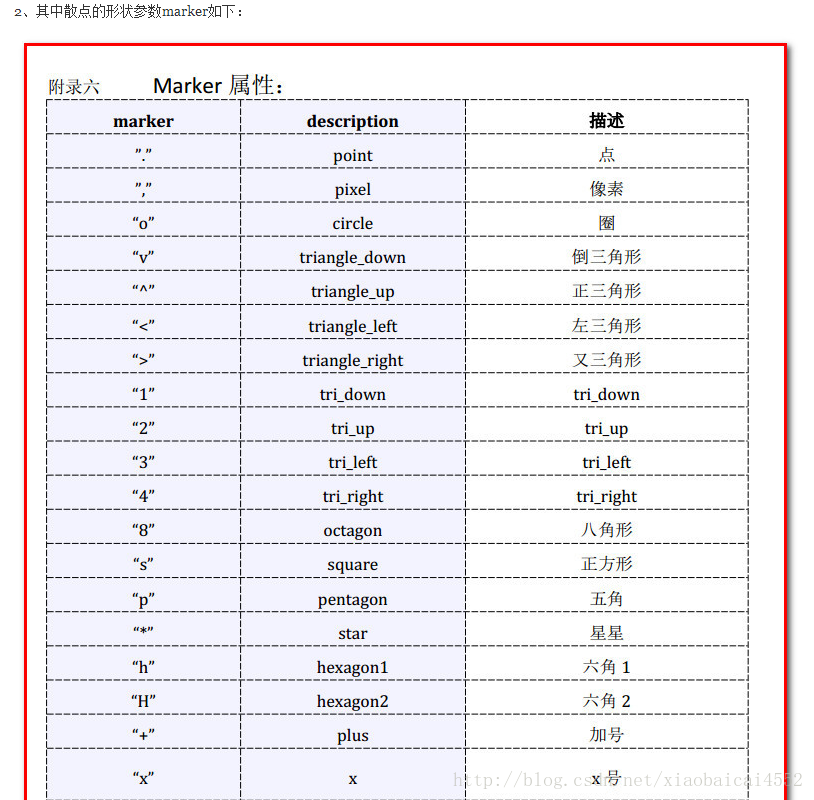
import matplotlib.pyplot as plt
fig=plt.figure()
ax = fig.add_subplot(111)
ax.scatter(x,y, s,c,marker)  #x,y 可以是可迭代对象
plt.show()


scatter:(x, y, s=None, c=None, marker=None, cmap=None, norm=None, vmin=None, vmax=None, alpha=None, linewidths=None, verts=None, edgecolors=None, hold=None, data=None, **kwargs)

根据x, y坐标,绘制散点;大小(s)、可更改点的颜色(c)、形状(marker)等,参数已列出

 浙公网安备 33010602011771号