

ggplot 中绘图设置 轴标签和标题与绘图区域的间距
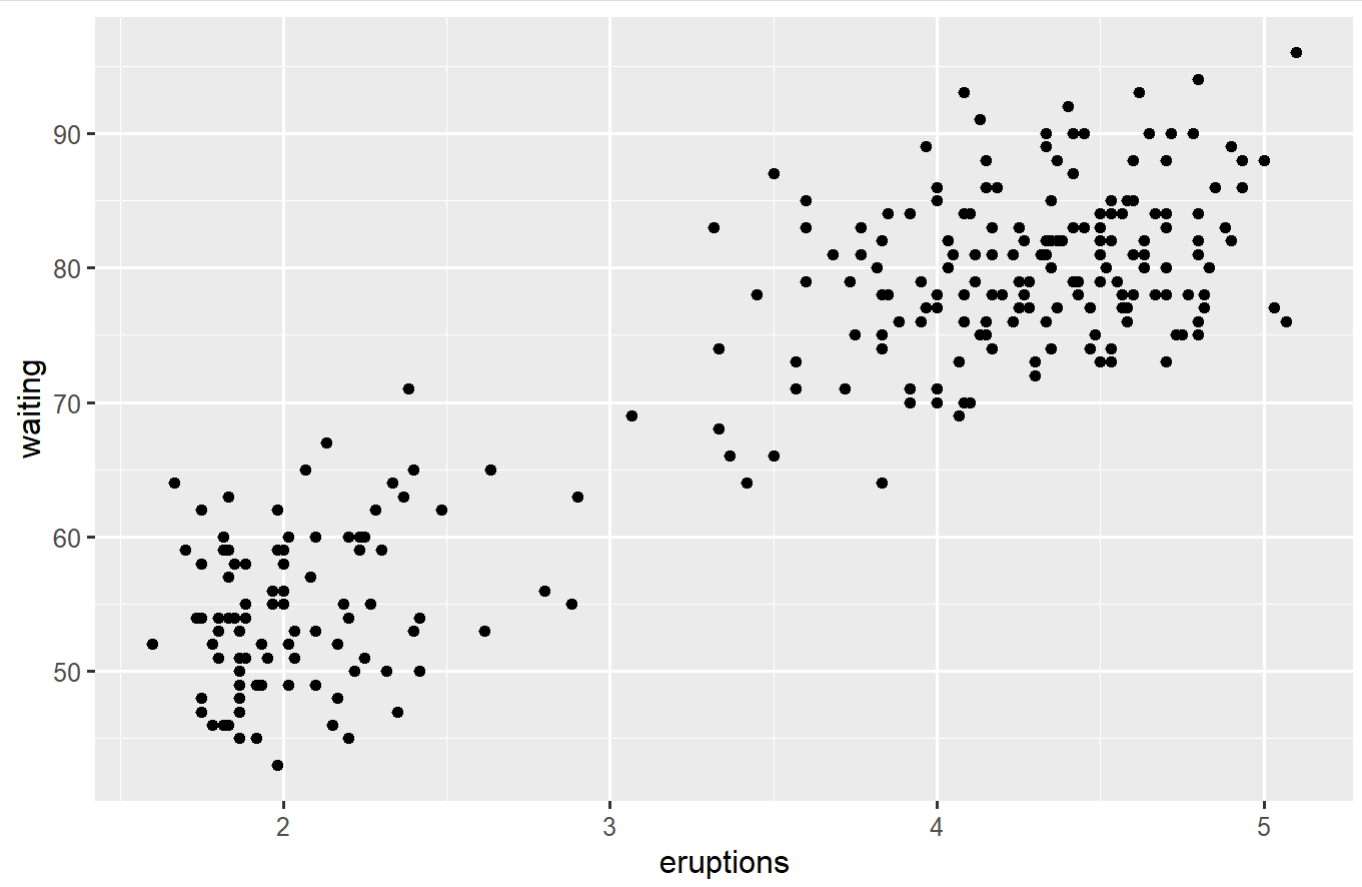
001、 基础绘图
library(ggplot2)
p <- ggplot(faithful, aes(x = eruptions, y = waiting)) +
  geom_point()
p
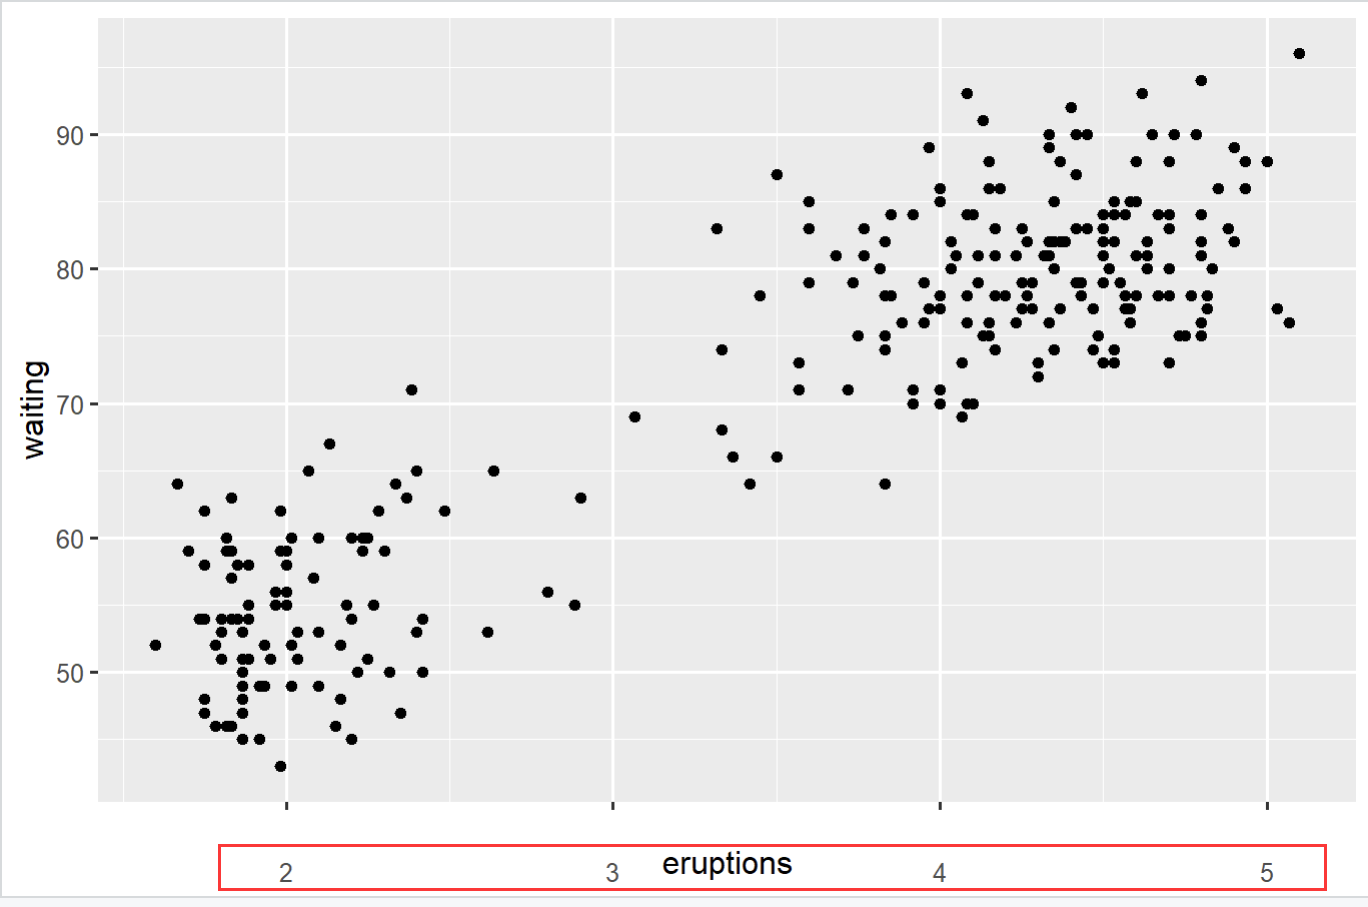
002、调整标签刻度到绘图区域的间距
p +
  theme(axis.text.x = element_text(vjust = -8))   ## 调整x标签刻度到绘图区域的间距
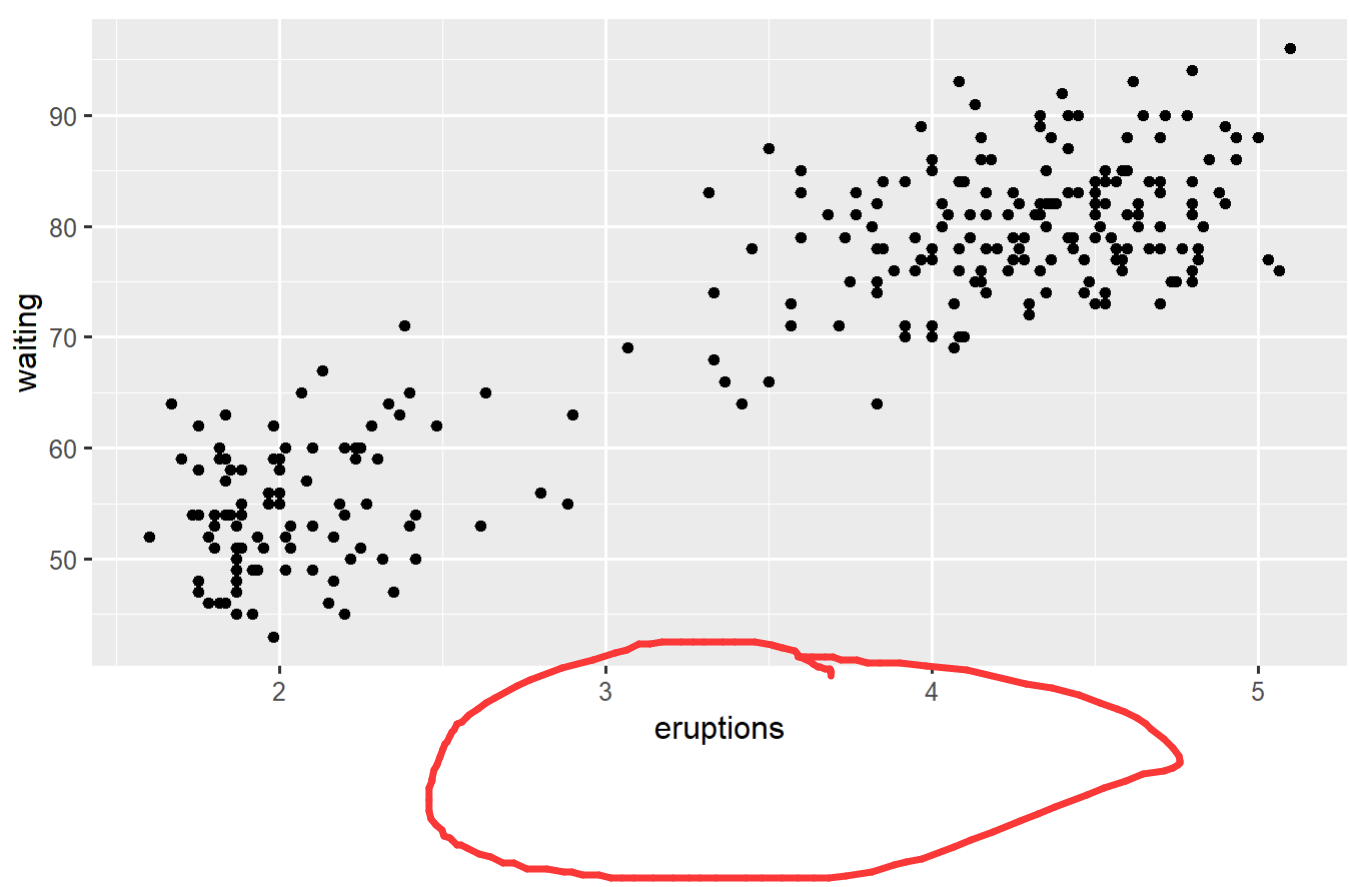
003、调整绘图区域到周边的距离
p +
  theme(plot.margin = margin(8,8,50,4))   ## 调整顺序依次为上、右、下、左
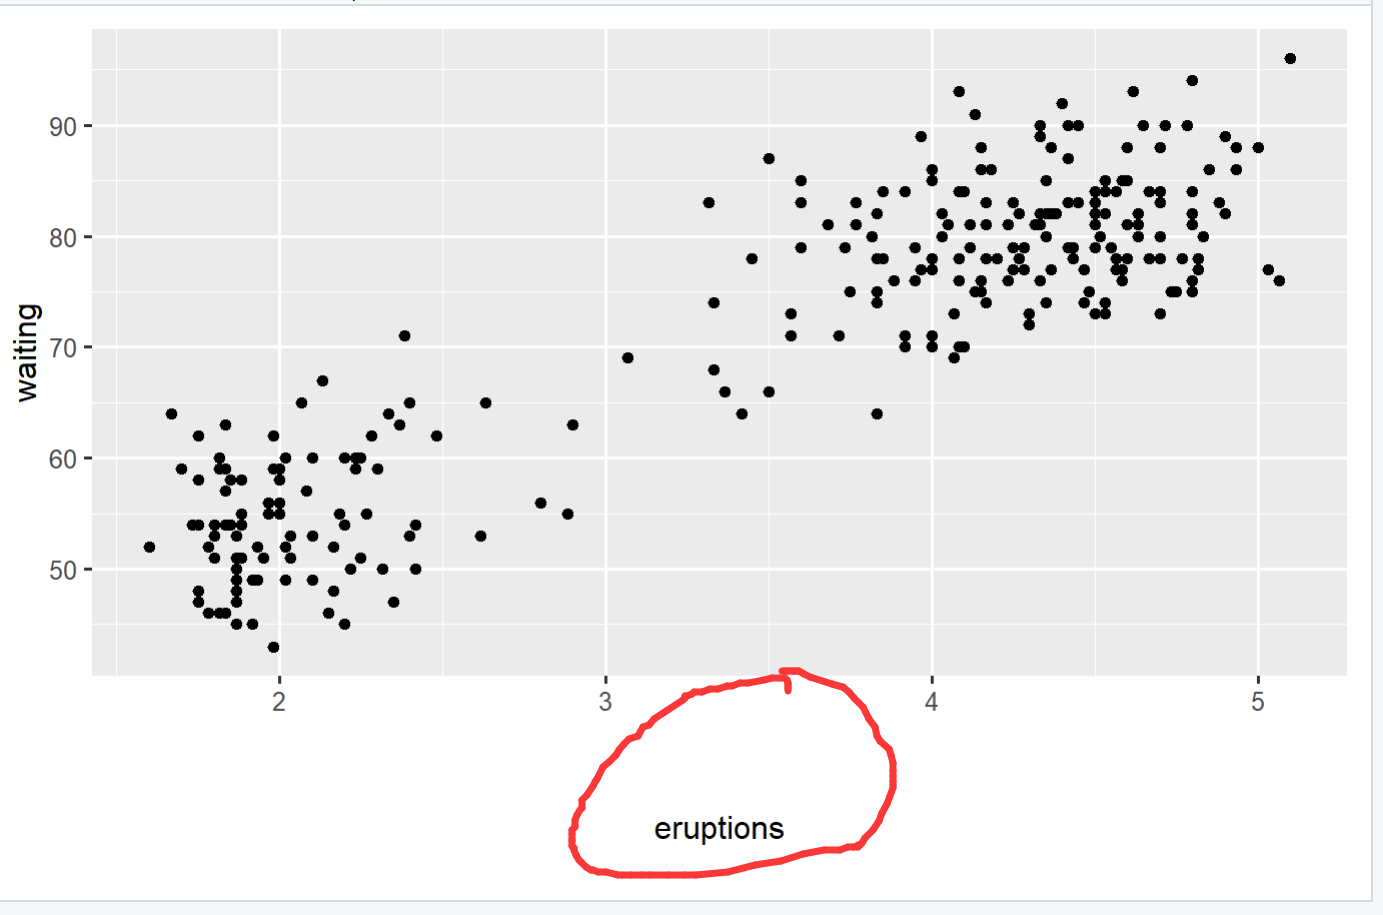
004、调整轴名称到绘图区域的间距
p +
  theme(plot.margin = margin(8,8,50,4),
        axis.title.x = element_text(vjust = -14))
。

 浙公网安备 33010602011771号