

influxdb+telegraf+grafana实现nginx监控
一、背景
公司业务某些页面加载很慢,简单通过日志并不能确认到底是哪些接口慢导致的,最近又在研究influxdb,于是计划通过influxdb+telegraf+grafana实现一套nginx监控,用来分析接口的耗时。
二、安装
我的开发机是centos7,以下安装命令都是在centos上的操作,其他操作系统请参考官方文档。
2.1、influxdb
wget https://dl.influxdata.com/influxdb/releases/influxdb-1.8.0.x86_64.rpm
sudo yum localinstall influxdb-1.8.0.x86_64.rpm
sudo systemctl start influxdb
这里因为我们只是测试验证,所以使用默认配置即可,如果现网环境,还是建议至少设置用户、密码等信息,默认influxdb的配置文件在/etc/influxdb/infludb.conf。
安装启动之后,可以直接在终端输入influx来尝试登陆下看看。
2.2、telegraf
wget https://dl.influxdata.com/telegraf/releases/telegraf-1.14.1-1.x86_64.rpm
sudo yum localinstall telegraf-1.14.1-1.x86_64.rpm
sudo systemctl start telegraf
这里telegraf也先使用默认的配置启动起来,后续配置在下一节详细讨论。
2.3、grafana
1 wget https://dl.grafana.com/oss/release/grafana-6.7.2-1.x86_64.rpm
2 sudo yum localinstall grafana-6.7.2-1.x86_64.rpm
3 sudo systemctl start grafana-server
grafana也是使用默认的配置,启动之后就可以通过http://your-ip:3000来访问grafana了。
三、配置
3.1、nginx log_format配置
本次监控的思路是通过telegraf抓取nginx的日志,并将信息导入到influxdb中,然后通过grafana将耗时数据展示出来,所以第一步我们需要先配置nginx的日志,以下是我使用的log_format:
log_format  main  '$remote_addr - $remote_user [$time_local] "$request" '
                      '$status $body_bytes_sent "$http_referer" '
                      '"$http_user_agent" $http_x_forwarded_for $host '
                      '"$upstream_addr" $upstream_status $request_time '
                      '$upstream_response_time "$cookie_uin" "$cookie_luin" "$cookie_username"';
虽然其中许多对于这里的监控不是必须的,但是由于要和现网保持一致,所以如果要跟随这篇文档来配置监控的话,建议也使用这个配置,因为这个日志的配置还会影响到telegraf日志解析的配置,这个地方有点麻烦,所以建议使用同样的配置,避免遇到奇葩的问题,待整个流程跑通了之后,可以再去熟悉telegraf日志解析的格式,进而根据需要调整自己的log_format。
3.2、telegraf input插件配置
这里使用了logparser插件来抓取日志,并使用grok格式来解析日志,一下是配置文件:
 1 # Stream and parse log file(s).
 2 [[inputs.logparser]]
 3   ## Log files to parse.
 4   ## These accept standard unix glob matching rules, but with the addition of
 5   ## ** as a "super asterisk". ie:
 6   ##   /var/log/**.log     -> recursively find all .log files in /var/log
 7   ##   /var/log/*/*.log    -> find all .log files with a parent dir in /var/log
 8   ##   /var/log/apache.log -> only tail the apache log file
 9   files = ["/var/log/nginx/access.log"]
10
11   ## Read files that currently exist from the beginning. Files that are created
12   ## while telegraf is running (and that match the "files" globs) will always
13   ## be read from the beginning.
14   from_beginning = false
15
16   ## Method used to watch for file updates.  Can be either "inotify" or "poll".
17   # watch_method = "inotify"
18
19   ## Parse logstash-style "grok" patterns:
20   [inputs.logparser.grok]
21     ## This is a list of patterns to check the given log file(s) for.
22     ## Note that adding patterns here increases processing time. The most
23     ## efficient configuration is to have one pattern per logparser.
24     ## Other common built-in patterns are:
25     ##   %{COMMON_LOG_FORMAT}   (plain apache & nginx access logs)
26     ##   %{COMBINED_LOG_FORMAT} (access logs + referrer & agent)
27     # patterns = ["%{COMMON_LOG_FORMAT}"]
28     patterns = ["%{NGINX_ACCESS_LOG}"]
29
30     ## Name of the outputted measurement name.
31     measurement = "nginx_access_log"
32
33     ## Full path(s) to custom pattern files.
34     custom_pattern_files = []
35
36     ## Custom patterns can also be defined here. Put one pattern per line.
37     custom_patterns = '''
38     NGINX_ACCESS_LOG %{IP:remote_addr} - (-|%{WORD:remote_user}) \[%{HTTPDATE:time_local}\] %{QS:request} %{NUMBER:status:int} %{NUMBER:body_bytes_sent:int} %{QS:referrer} %{QS:agent} %{IPORHOST:xforwardedfor} %{IPORHOST:host} %{QS:upstream_addr} (-|%{NUMBER:upstream_status:int}) %{BASE10NUM:request_time:float} (-|%{BASE10NUM:upstream_response_time:float}) %{QS:cookie_uin} %{QS:cookie_luin}
39     '''
40
41     ## Timezone allows you to provide an override for timestamps that
42     ## don't already include an offset
43     ## e.g. 04/06/2016 12:41:45 data one two 5.43µs
44     ##
45     ## Default: "" which renders UTC
46     ## Options are as follows:
47     ##   1. Local             -- interpret based on machine localtime
48     ##   2. "Canada/Eastern"  -- Unix TZ values like those found in https://en.wikipedia.org/wiki/List_of_tz_database_time_zones
49     ##   3. UTC               -- or blank/unspecified, will return timestamp in UTC
50     # timezone = "Canada/Eastern"
51
52     ## When set to "disable", timestamp will not incremented if there is a
53     ## duplicate.
54     # unique_timestamp = "auto"
其中最核心的地方是NGINX_ACCESS_LOG的配置,它决定了如何去解析nginx的日志,这里使用到了grok的语法,更多关于grok的信息见参考资料。
修改之后记得使用systemctl restart telegraf命令使改动生效。
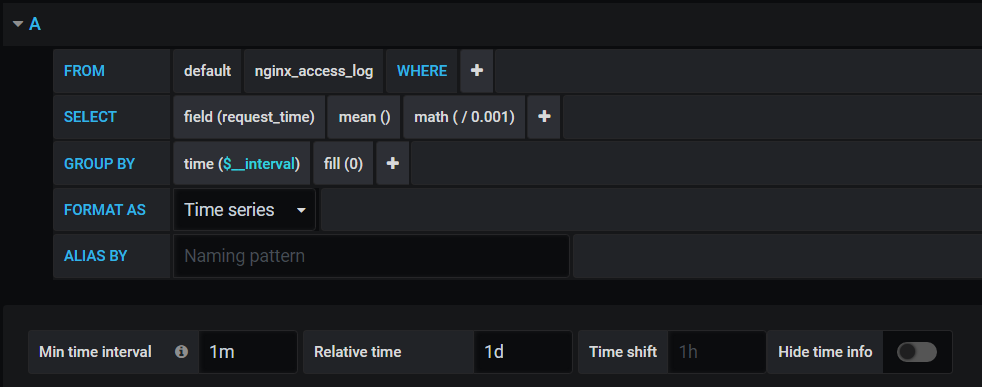
3.3、grafana的配置
grafana需要先配置influxdb数据源,具体操作可以看下grafana的文档,这里说一下如何配置从influxdb查询数据并将数据展示出来,这里主要用到了日志中解析出来的request_time。
四、效果
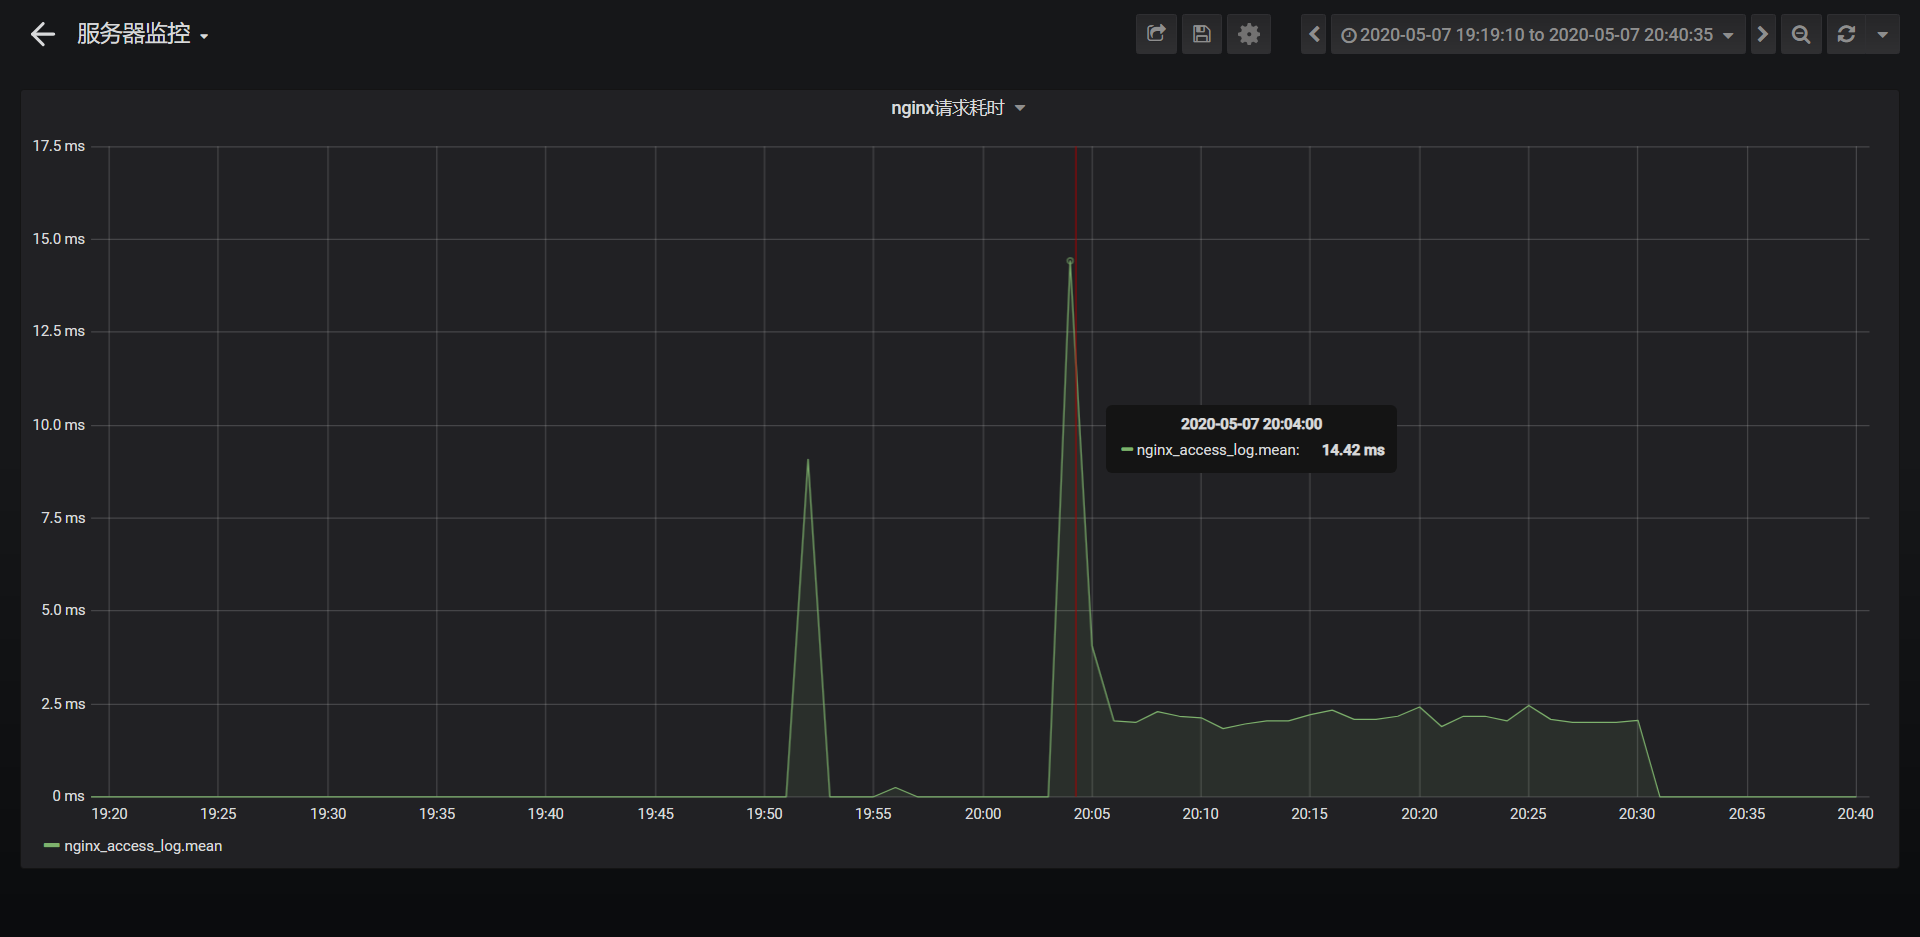
这里可以看到,很清晰明了的把nginx的调用耗时展示了出来,但是到这里并没有结束,因为并没有达到我们的目的:定位哪些接口查询较慢,目前仅仅实现了一个全局的视图,能够知道目前有没有接口很慢,但是不知道哪个接口慢(除非直接查influxdb),我思考了一下,这是因为其实grafana只是用来展示metric的,metric更多的是关注统计,而哪个接口慢更多的是需要关注个体,这里是grafana很难实现的(除非一个接口一个query,那配置起来就太麻烦了),所以要解决我们的问题其实是需要引入全链路追踪系统的,这个目前还在调研中,待部署上线了再写篇文章介绍一下全链路追踪。
五、参考资料
1、grok patterns:http://grokdebug.herokuapp.com/patterns#
2、grok debug:http://grokdebug.herokuapp.com/
3、telegraf文档:https://docs.influxdata.com/telegraf/v1.14/
4、grok input data format:https://docs.influxdata.com/telegraf/v1.14/data_formats/input/grok/

 浙公网安备 33010602011771号