
1、安装Python
安装 python -m pip install --user numpy scipy matplotlib ipython jupyter pandas sympy nose
pip install -U scikit-learn
效果图:

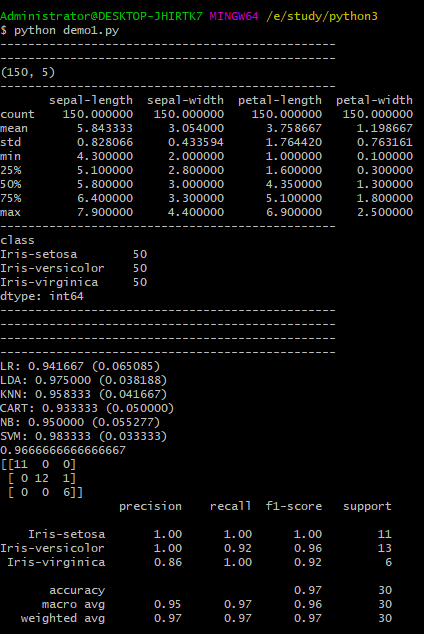
运行结果:
完整代码:
from pandas import read_csv
from pandas.plotting import scatter_matrix
from matplotlib import pyplot
from sklearn.model_selection import train_test_split
from sklearn.model_selection import cross_val_score
from sklearn.model_selection import StratifiedKFold
from sklearn.metrics import classification_report
from sklearn.metrics import confusion_matrix
from sklearn.metrics import accuracy_score
from sklearn.linear_model import LogisticRegression
from sklearn.tree import DecisionTreeClassifier
from sklearn.neighbors import KNeighborsClassifier
from sklearn.discriminant_analysis import LinearDiscriminantAnalysis
from sklearn.naive_bayes import GaussianNB
from sklearn.svm import SVC

print("------------------------------------------------")

# Load dataset
#url = "https://raw.githubusercontent.com/jbrownlee/Datasets/master/iris.csv"
names = ['sepal-length', 'sepal-width', 'petal-length', 'petal-width', 'class']
dataset = read_csv("C:\\Users\\Administrator\\Downloads\\iris.data", names=names)

# shape
print("------------------------------------------------")
print(dataset.shape)

#print(dataset.head(20))

# descriptions
print("------------------------------------------------")
print(dataset.describe())


# classdistribution
print("------------------------------------------------")
print(dataset.groupby('class').size())

# boxand whisker plots
print("------------------------------------------------")
#dataset.plot(kind='box', subplots=True, layout=(2,2), sharex=False, sharey=False)
#pyplot.show()

print("------------------------------------------------")
# histograms
#dataset.hist()
#pyplot.show()

print("------------------------------------------------")
# scatter plot matrix
#scatter_matrix(dataset)
#pyplot.show()

print("------------------------------------------------")
# Split-out validation dataset
array = dataset.values
X = array[:,0:4]
y = array[:,4]
X_train, X_validation, Y_train, Y_validation = train_test_split(X, y, test_size=0.20, random_state=1)


models = []
models.append(('LR', LogisticRegression(solver='liblinear', multi_class='ovr')))
models.append(('LDA', LinearDiscriminantAnalysis()))
models.append(('KNN', KNeighborsClassifier()))
models.append(('CART', DecisionTreeClassifier()))
models.append(('NB', GaussianNB()))
models.append(('SVM', SVC(gamma='auto')))
# evaluate each model in turn
results = []
names = []
for name, model in models:
	kfold = StratifiedKFold(n_splits=10, random_state=1, shuffle=True)
	cv_results = cross_val_score(model, X_train, Y_train, cv=kfold, scoring='accuracy')
	results.append(cv_results)
	names.append(name)
	print('%s: %f (%f)' % (name, cv_results.mean(), cv_results.std()))


# Compare Algorithms
pyplot.boxplot(results, labels=names)
pyplot.title('Algorithm Comparison')
pyplot.show()


# Make predictions on validation dataset
model = SVC(gamma='auto')
model.fit(X_train, Y_train)
predictions = model.predict(X_validation)

# Evaluate predictions
print(accuracy_score(Y_validation, predictions))
print(confusion_matrix(Y_validation, predictions))
print(classification_report(Y_validation, predictions))
参考:
英文:https://machinelearningmastery.com/machine-learning-in-python-step-by-step/
作者:Work Hard Work Smart
出处:http://www.cnblogs.com/linlf03/
欢迎任何形式的转载,未经作者同意,请保留此段声明!

 浙公网安备 33010602011771号