
Actuator是Spring Boot提供的对应用系统的自省和监控的集成功能,可以查看应用配置的详细信息,例如自动化配置信息、创建的Spring beans以及一些环境属性等。
1、创建Spring Boot工程,pom.xml的配置如下
    <parent>
        <groupId>org.springframework.boot</groupId>
        <artifactId>spring-boot-starter-parent</artifactId>
        <version>2.2.6.RELEASE</version>
        <relativePath/>
    </parent>

    <dependencies>
        <dependency>
            <groupId>javax.servlet</groupId>
            <artifactId>javax.servlet-api</artifactId>
            <version>3.1.0</version>
            <scope>provided</scope>
        </dependency>

        <dependency>
            <groupId>org.springframework.boot</groupId>
            <artifactId>spring-boot-starter-web</artifactId>
        </dependency>

        <dependency>
            <groupId>org.springframework.boot</groupId>
            <artifactId>spring-boot-starter</artifactId>
        </dependency>

        <dependency>
            <groupId>org.springframework.boot</groupId>
            <artifactId>spring-boot-starter-actuator</artifactId>
        </dependency>


    </dependencies>
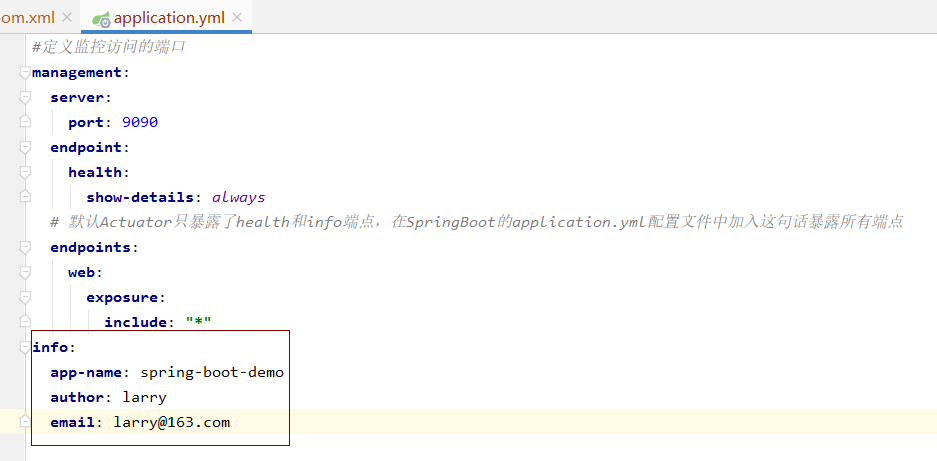
2、applicatoin.yml 配置如下
#定义监控访问的端口
management:
  server:
    port: 9090
  # 默认Actuator只暴露了health和info端点,在SpringBoot的application.yml配置文件中加入这句话暴露所有端点
  endpoints:
    web:
      exposure:
        include: "*"
激活指定的端点,如激活metrics,health
配置如下
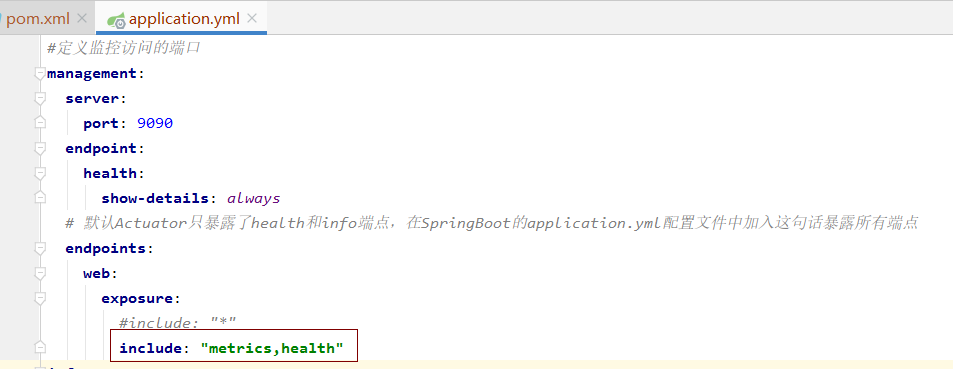
效果如下图所示
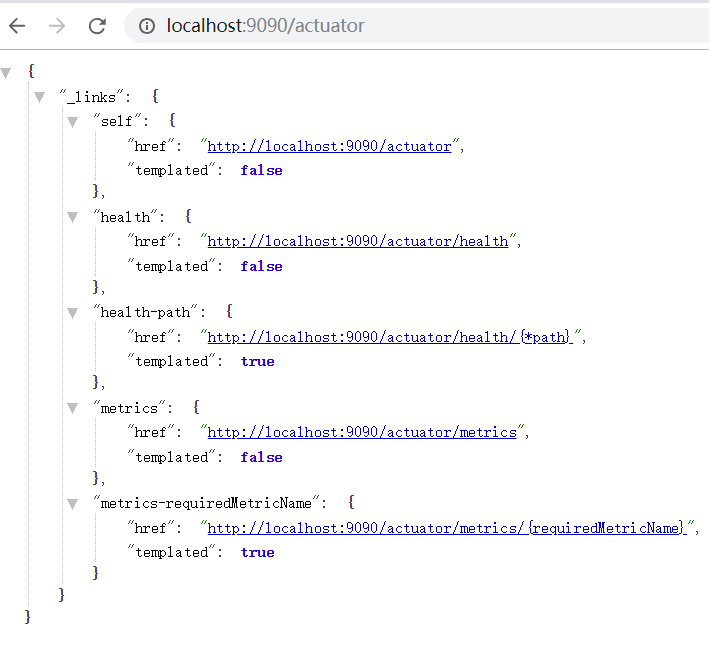
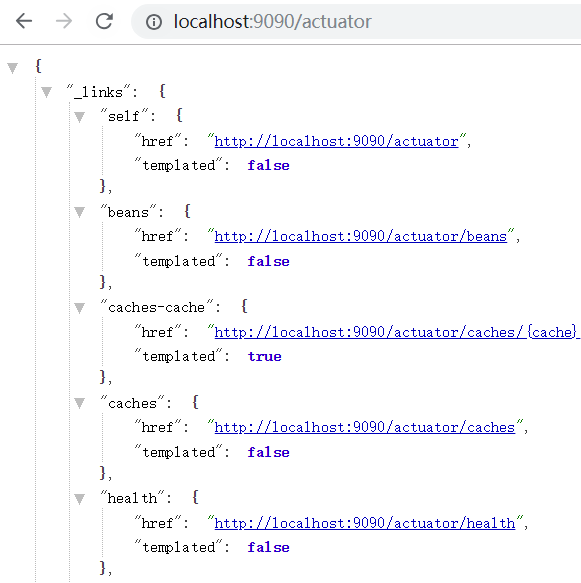
3、访问。
返回的是actuator返回提供的接口
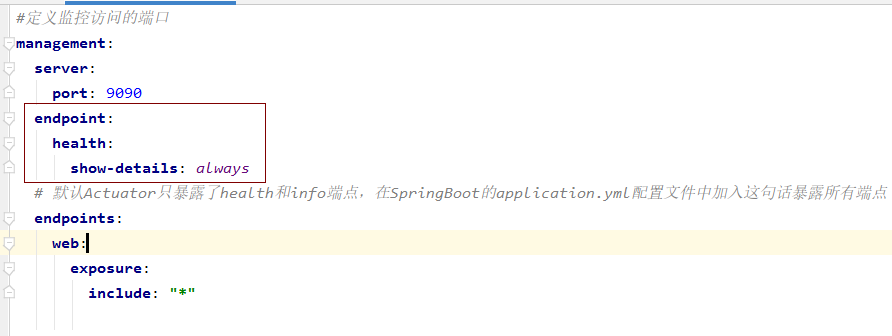
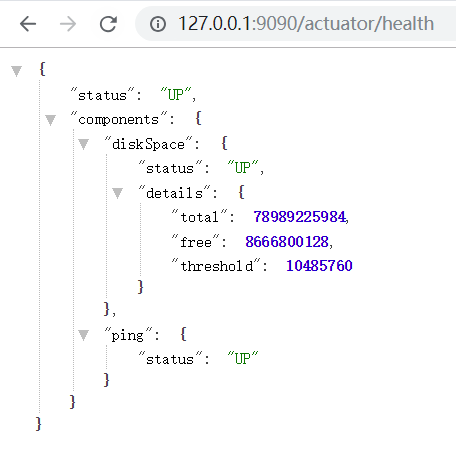
4、显示监控详细信息
配置显示详情 application.yml 配置如下
可以看到,free剩余在8G左右
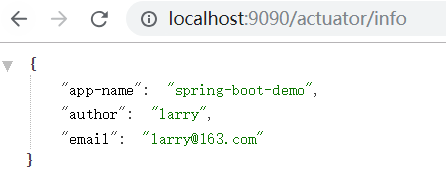
5、设置info信息
查看效果
http://localhost:9090/actuator/info
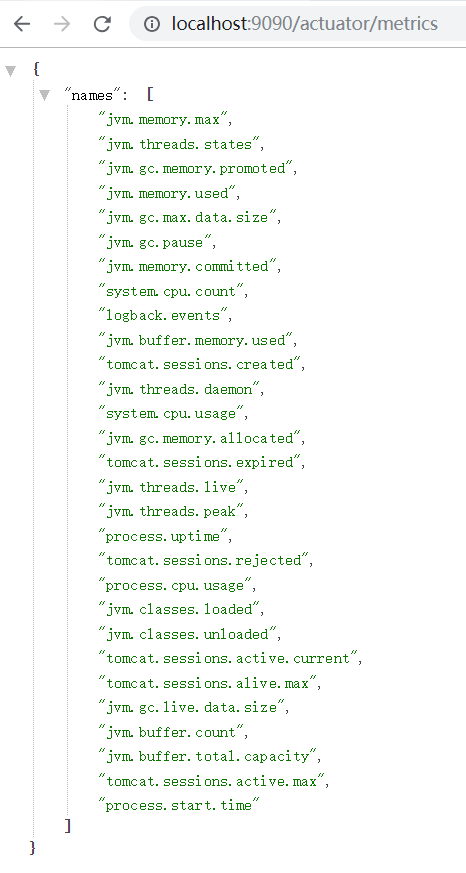
6、metrics使用
http://localhost:9090/actuator/metrics
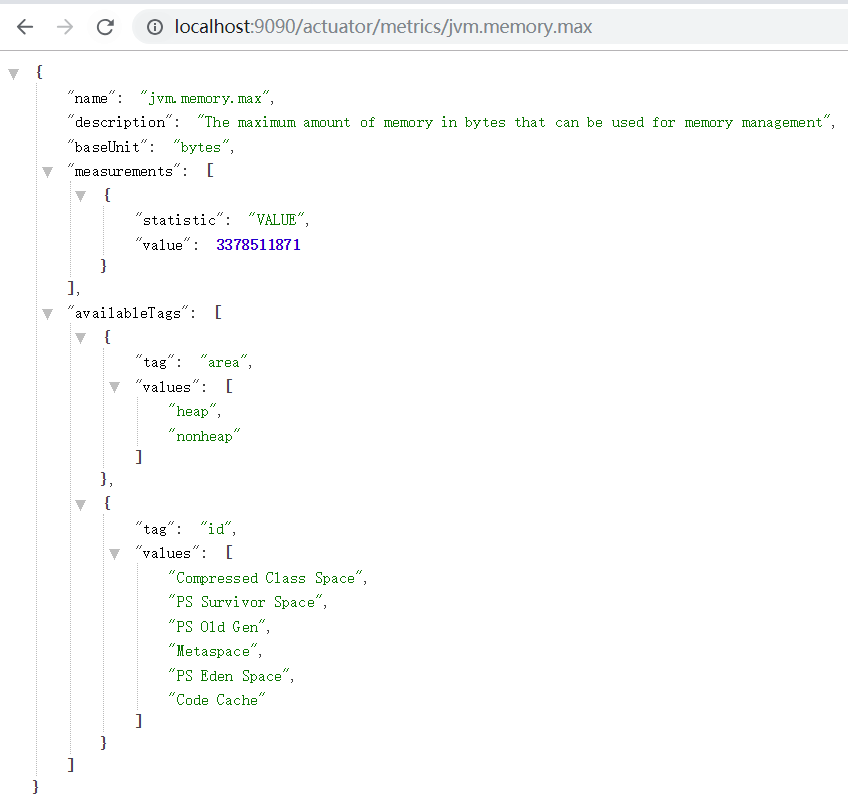
查看JVM最大内存
http://localhost:9090/actuator/metrics/jvm.memory.max
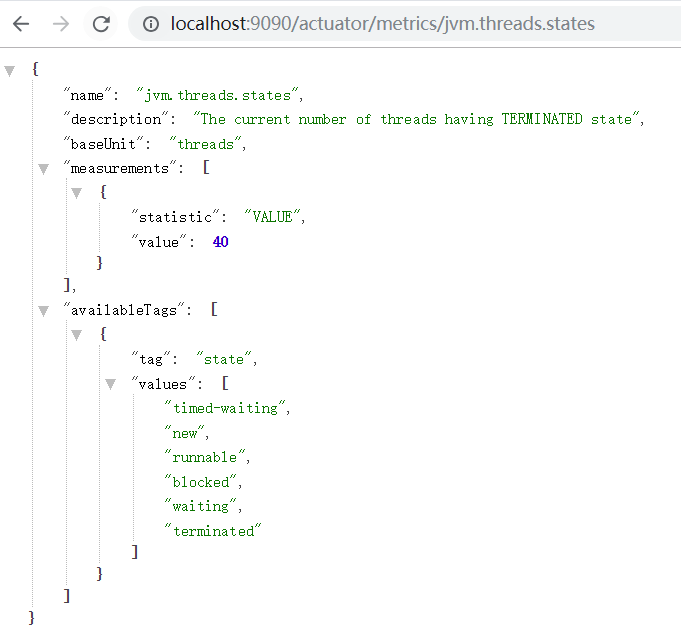
线程状态
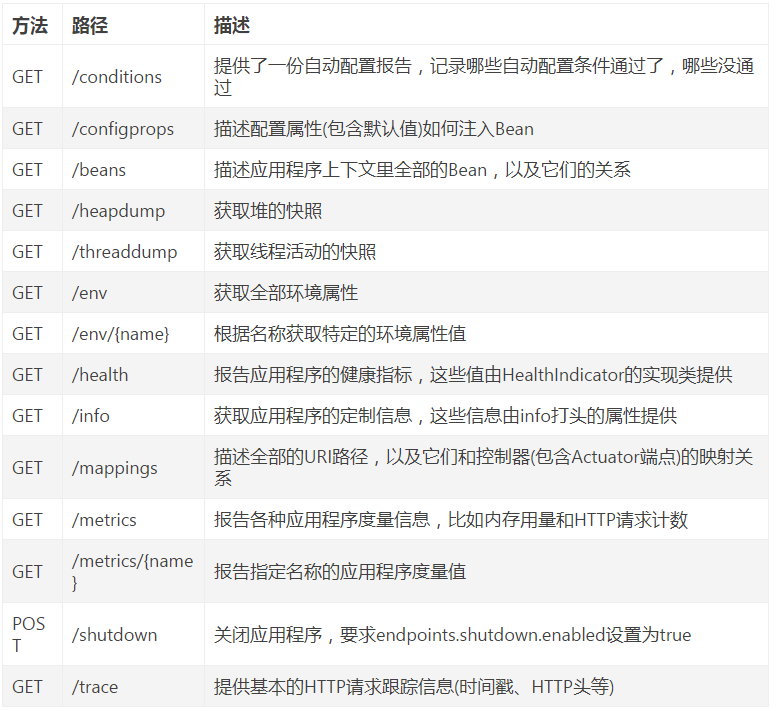
7、提供的接口介绍
作者:Work Hard Work Smart
出处:http://www.cnblogs.com/linlf03/
欢迎任何形式的转载,未经作者同意,请保留此段声明!

 浙公网安备 33010602011771号