
一、基于JVisualVM的可视化监控
1、打开C:\Program Files\Java\jdk1.8.0_131\bin下的jvisualvm.exe
2、打开后,会列出本机所有的Java进程
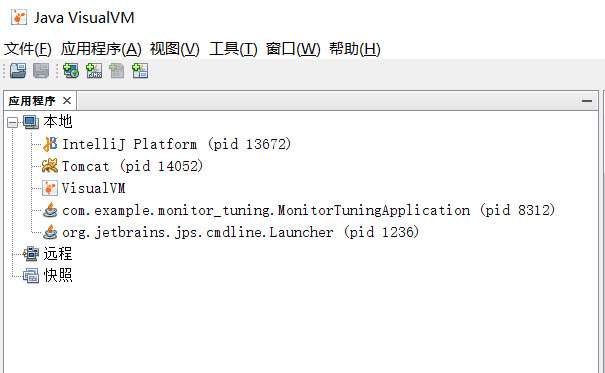
3、安装插件visualvm
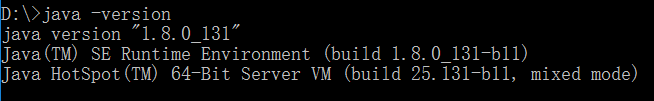
1)查看java的版本
2)打开https://visualvm.github.io/pluginscenters.html
选择131

3)打开工具-> 插件->设置
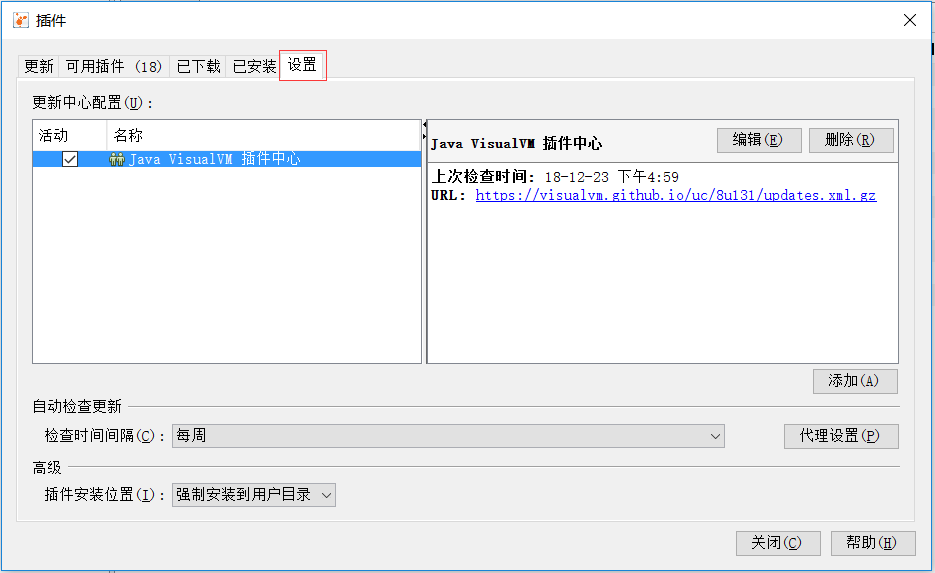
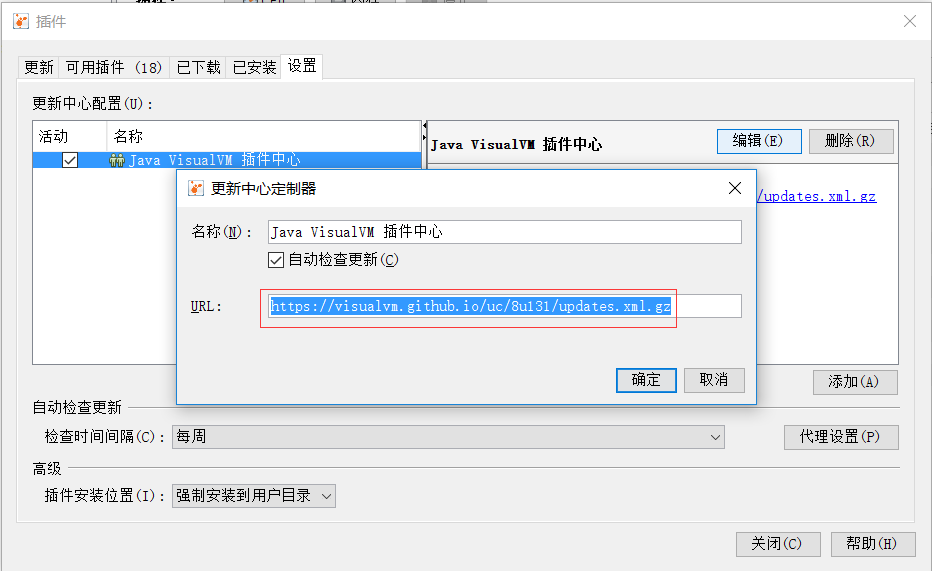
编辑, 设置为https://visualvm.github.io/uc/8u131/updates.xml.gz
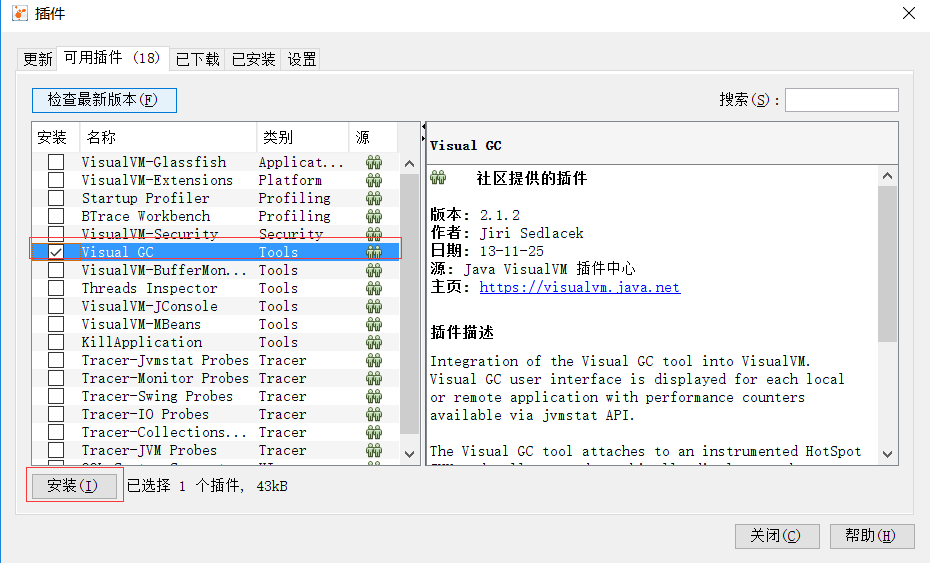
然后在可用插件中选择Visual GC,然后“安装”
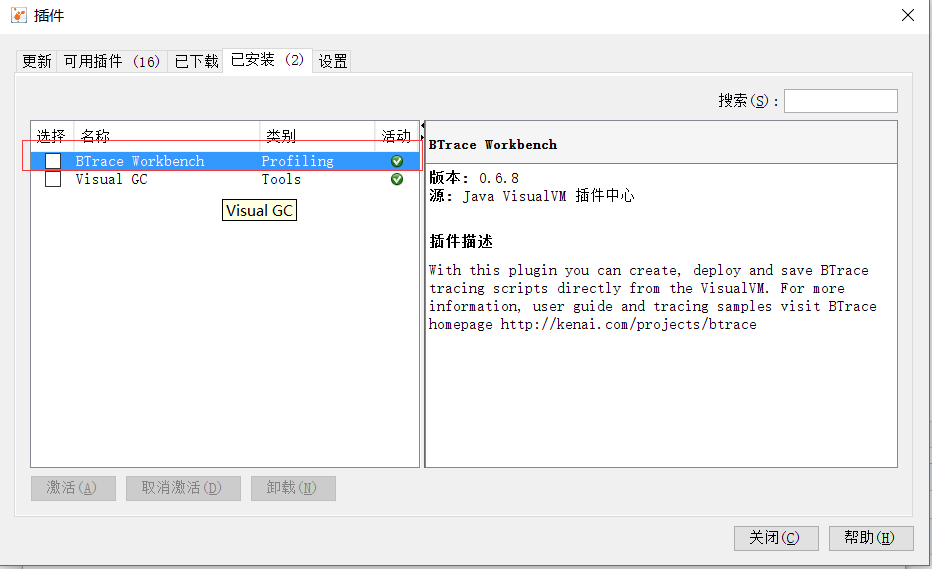
然后安装BTrace
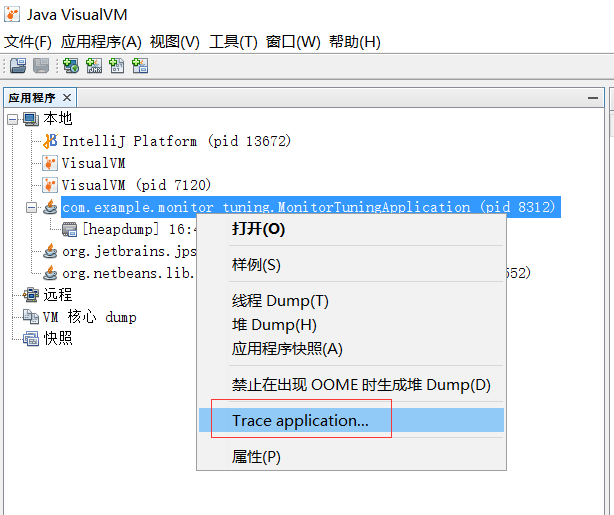
4、使用JVisualVM+BTrace 查看访问参数
前置条件: 接口测创建和BTrace脚本的创建,参考https://www.cnblogs.com/linlf03/p/10165881.html
BTrace打开位置为
然后将Btrace脚本复制进去
package com.example.monitor_tuning.chapter4;

import com.sun.btrace.AnyType;
import com.sun.btrace.BTraceUtils;
import com.sun.btrace.annotations.*;

/**
 * 此Btrace脚本和要跟踪的代码不是放在同一个工程里的。这里演示方便,放在一起。
 */
@BTrace
public class PrintArgSimple {

    /*要拦截哪个类,哪个方法,什么时候拦截*/
    @OnMethod(
            clazz = "com.example.monitor_tuning.chapter4.Ch4Controller",
            method="arg1",
            location = @Location(Kind.ENTRY)
    )
    /*ProbeClassName 方法类名; ProbeMethodName 方法名 ; AnyType[] 方法参数*/
    public static  void anyRead(@ProbeClassName String pcn, @ProbeMethodName String  pmn, AnyType[] args)
    {
        BTraceUtils.printArray(args);
        BTraceUtils.println(pcn + "," + pmn);
        BTraceUtils.println();
    }
}
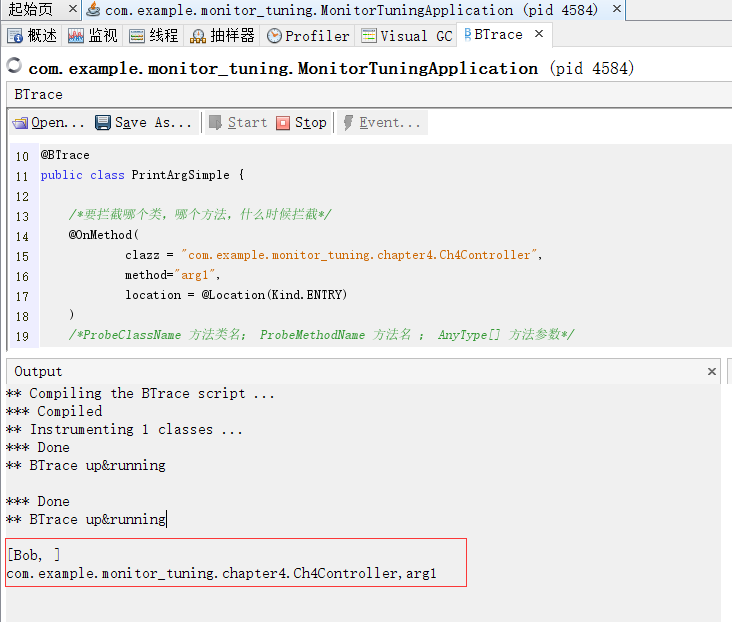
点击start,编译完成
访问http://localhost:8080/monitor_tuning/ch4/arg1?name=Bob
显示效果:
作者:Work Hard Work Smart
出处:http://www.cnblogs.com/linlf03/
欢迎任何形式的转载,未经作者同意,请保留此段声明!

 浙公网安备 33010602011771号