

linux网络流量查看命令
- 网卡流量
1、iftop命令
iftop可以用来监控网卡的实时流量(可以指定网段)、反向解析IP、显示端口信息、TCP/IP连接等
官网:http://www.ex-parrot.com/~pdw/iftop/
- 安装iftop:
[root@Super ~]# yum install flex byacc  libpcap ncurses ncurses-devel libpcap-devel -y
[root@Super ~]# wget http://www.ex-parrot.com/~pdw/iftop/download/iftop-0.17.tar.gz
[root@Super ~]#  tar -zxvf iftop-0.17.tar.gz
[root@Super ~]# cd iftop-0.17
[root@Super iftop-0.17]#    ./configure
[root@Super iftop-0.17]# make
[root@Super iftop-0.17]# make install
[root@Super iftop-0.17]# iftop --help
iftop: unknown option --
iftop: display bandwidth usage on an interface by host

Synopsis: iftop -h | [-npbBP] [-i interface] [-f filter code] [-N net/mask]

   -h                  display this message
   -n                  don't do hostname lookups
   -N                  don't convert port numbers to services
   -p                  run in promiscuous mode (show traffic between other
                       hosts on the same network segment)
   -b                  don't display a bar graph of traffic
   -B                  Display bandwidth in bytes
   -i interface        listen on named interface
   -f filter code      use filter code to select packets to count
                       (default: none, but only IP packets are counted)
   -F net/mask         show traffic flows in/out of network
   -P                  show ports as well as hosts
   -m limit            sets the upper limit for the bandwidth scale
   -c config file      specifies an alternative configuration file

iftop, version 0.17
copyright (c) 2002 Paul Warren <pdw@ex-parrot.com> and contributors
[root@Super iftop-0.17]#
或者安装好epel源后直接yum install iftop -y安装
[root@Super ~]# yum install iftop -y
iftop监控命令的例子:
iftop -N -n -i eth0
- 运行iftop
直接运行后效果图如下
[root@Super soft]# iftop
interface: ens32
IP address is: 192.168.100.127
MAC address is: 00:50:56:a9:1c:49
[root@Super soft]# 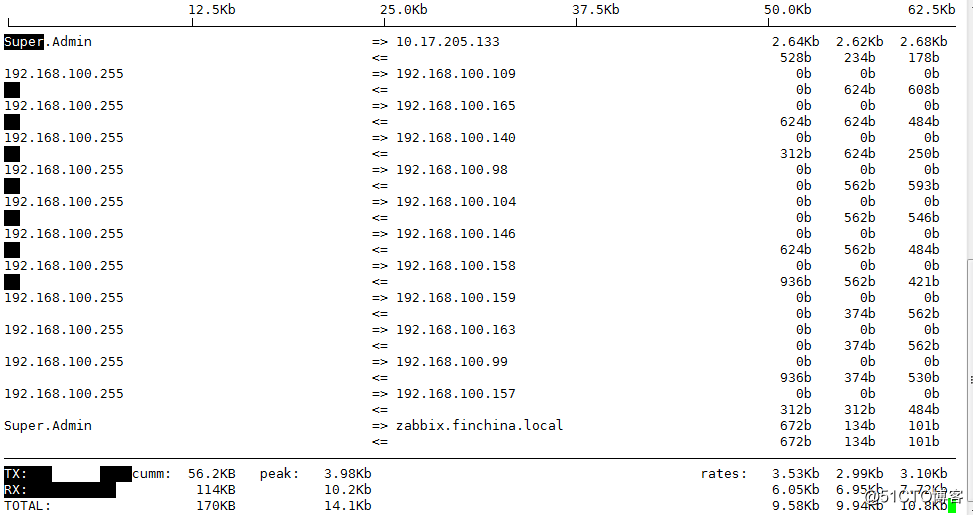
<= 、=> 左右箭头,表示流量的方向;
右边3列,表示的是该访问ip连接到本机2秒,10秒和40秒的平均流量
TX:发送流量
RX:接收流量
TOTAL:总流量
Cumm:运行iftop到目前时间的总流量
peak:流量峰值
rates:分别表示过去 2s 10s 40s 的平均流量
- iftop常用的参数
-i:设定监测的网卡,如:# iftop -i eth1
-B:以bytes为单位显示流量(默认是bits),如:# iftop -B
-n:使host信息默认直接都显示IP,如:# iftop -n
-N:使端口信息默认直接都显示端口号,如: # iftop -N
-F:显示特定网段的进出流量,如# iftop -F 10.10.1.0/24或# iftop -F 10.10.1.0/255.255.255.0
-h:(display this message),帮助,显示参数信息
-p:使用这个参数后,中间的列表显示的本地主机信息,出现了本机以外的IP信息;
-b:使流量图形条默认就显示;
-f:过滤计算包;
-P:使host信息及端口信息默认就都显示;
-m:设置界面最上边的刻度的最大值,刻度分五个大段显示,例:# iftop -m 100M
- iftop界面常用命令(区分大小写)
h:切换是否显示帮助;
n:切换显示本机的IP或主机名;
s:切换是否显示本机的host信息;
d:切换是否显示远端目标主机的host信息;
t:来往的数据合并成一行,切换显示格式为2行/1行/只显示发送流量/只显示接收流量;
N:切换显示端口号或端口服务名称;
S:切换是否显示本机的端口信息;
D:切换是否显示远端目标主机的端口信息;
p:切换是否显示端口信息;
P:切换暂停/继续显示;
b:切换是否显示平均流量图形条;
B:切换计算2秒或10秒或40秒内的平均流量;
T:切换是否显示每个连接的总流量;
l:打开屏幕过滤功能,输入要过滤的字符,比如ip,按回车后,屏幕就只显示这个IP相关的流量信息;
L:切换显示画面上边的刻度;刻度不同,流量图形条会有变化;
j或k:可以向上或向下滚动屏幕显示的连接记录;
1或2或3:可以根据右侧显示的三列流量数据进行排序;
<:根据左边的本机名或IP排序;
“>:”根据远端目标主机的主机名或IP排序
o:切换是否固定只显示当前的连接;
f:可以编辑过滤代码,这是翻译过来的说法,我还没用过这个!
!:可以使用shell命令,这个没用过!没搞明白啥命令在这好用呢!
q:退出监控。
2、iptraf命令
iptraf是一款交互式、色彩鲜艳的IP局域网监控工具。它可以显示每个连接以及主机之间传输的数据量。以生成各种网络统计数据,包括TCP信息、UDP统计、ICMP和OSPF信息、以太网负载信息、节点统计、IP校验和错误和其它一些信息。
[root@localhost ~]# yum install -y epel-release
[root@localhost ~]# yum install iptraf-ng -y
-i iface 网络接口:立即在指定网络接口上开启IP流量监视,iface为all指监视所有的网络接口,iface指相应的interface
-g 立即开始生成网络接口的概要状态信息
-d iface 网络接口:在指定网络接口上立即开始监视明细的网络流量信息,iface指相应的interface
-s iface 网络接口:在指定网络接口上立即开始监视TCP和UDP网络流量信息,iface指相应的interface
-z iface 网络接口:在指定网络接口上显示包计数,iface指相应的interface
-l iface 网络接口:在指定网络接口上立即开始监视局域网工作站信息,iface指相应的interface
-t timeout 时间:指定iptraf指令监视的时间,timeout指监视时间的minute数
-B 将标注输出重新定向到“/dev/null”,关闭标注输入,将程序作为后台进程运行
-L logfile 指定一个文件用于记录所有命令行的log,默认文件是地址:/var/log/iptraf
-I interval 指定记录log的时间间隔(单位是minute),不包括IP traffic monitor
-u 允许使用不支持的接口作为以太网设备
-f 清空所有计数器
-h 显示帮助信息
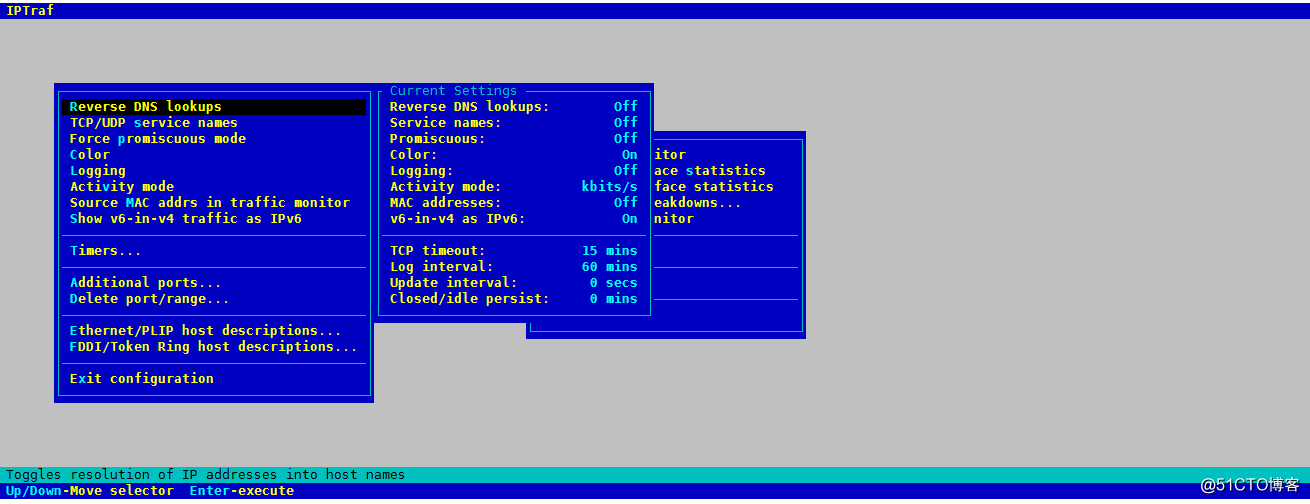
- Configure
在总菜单命令中点击“Configure” menu,即进入如上命令菜单,进行适当的配置可以让统计的结果更直观,信息更丰富。
1)Reverse DNS lookups:查看连接的ip所对应的域名,在IP traffic monitor的pkt captured对话框中就可以看到域名结果,这个不是很直观,开启后会有点点影响抓包性能。
2)TCP/UDP service names:在有端口的地方都会把端口号换成相应的服务名,非常有用,很直观。
3)Activity mode:显示流量是按Kbits/s还是Kbytes/s,建议改成后面的更符合习惯。
4)Additional ports:按端口号监控所额外需要监控的端口,默认只监控小于1024的。
- Filters
这个默认就行了,除非有特殊需要。
- IP traffic monitor
根据连接查看网络流量,这个最好让他跑一段时间看统计总量的结构,如果单个连接占用大量带宽,就很容易看出来。同时根据IP还可以很容易分辨是和内网还是外网服务器进行交互。pkt captured可以看到mac地址。
3、sar命令
-
sar(System Activity Reporter系统活动情况报告)是目前 Linux 上最为全面的系统性能分析工具之一,可以从多方面对系统的活动进行报告,包括:文件的读写情况、系统调用的使用情况、磁盘I/O、CPU效率、内存使用状况、进程活动及IPC有关的活动等。
- sar命令包含在sysstat工具包中,提供系统的众多统计数据。其在不同的系统上命令有些差异,某些系统提供的sar支持基于网络接口的数据统计,也可以查看设备上每秒收发包的个数和流量。
[root@Super soft]# which sar
/usr/bin/which: no sar in (/usr/local/sbin:/usr/local/bin:/sbin:/bin:/usr/sbin:/usr/bin:/opt/soft/node-v6.10.2-linux-x64/bin/node:/root/bin)
[root@Super soft]# yum -y install sysstat
[root@Super soft]# which sar
/bin/sar
[root@Super soft]# sar -n DEV 1 2
Linux 3.10.0-693.21.1.el7.x86_64 (Super.Admin)  08/11/2018  _x86_64_    (16 CPU)

04:54:14 PM     IFACE   rxpck/s   txpck/s    rxkB/s    txkB/s   rxcmp/s   txcmp/s  rxmcst/s
04:54:15 PM     ens32     18.00      2.00      1.45      0.12      0.00      0.00      0.00
04:54:15 PM        lo      0.00      0.00      0.00      0.00      0.00      0.00      0.00
04:54:15 PM   docker0      0.00      0.00      0.00      0.00      0.00      0.00      0.00

04:54:15 PM     IFACE   rxpck/s   txpck/s    rxkB/s    txkB/s   rxcmp/s   txcmp/s  rxmcst/s
04:54:16 PM     ens32     15.00      3.00      1.44      0.60      0.00      0.00      0.00
04:54:16 PM        lo      0.00      0.00      0.00      0.00      0.00      0.00      0.00
04:54:16 PM   docker0      0.00      0.00      0.00      0.00      0.00      0.00      0.00

Average:        IFACE   rxpck/s   txpck/s    rxkB/s    txkB/s   rxcmp/s   txcmp/s  rxmcst/s
Average:        ens32     16.50      2.50      1.45      0.36      0.00      0.00      0.00
Average:           lo      0.00      0.00      0.00      0.00      0.00      0.00      0.00
Average:      docker0      0.00      0.00      0.00      0.00      0.00      0.00      0.00
[root@Super soft]#
1 2 表示:间隔时间(秒)、次数,即每一秒钟取1次值,取2次。
-n参数有6个开关:
DEV:显示网络接口信息。
EDEV:显示关于网络错误的统计数据。
NFS:统计活动的NFS客户端的信息。
NFSD:统计NFS服务器的信息
SOCK:显示套接字信息
ALL:显示所有5个开关
IFACE:LAN接口
rxpck/s:每秒钟接收的数据包
txpck/s:每秒钟发送的数据包
rxbyt/s:每秒钟接收的字节数
txbyt/s:每秒钟发送的字节数
rxcmp/s:每秒钟接收的压缩数据包
txcmp/s:每秒钟发送的压缩数据包
rxmcst/s:每秒钟接收的多播数据包
rxerr/s:每秒钟接收的坏数据包
txerr/s:每秒钟发送的坏数据包
coll/s:每秒冲突数
rxdrop/s:因为缓冲充满,每秒钟丢弃的已接收数据包数
txdrop/s:因为缓冲充满,每秒钟丢弃的已发送数据包数
txcarr/s:发送数据包时,每秒载波错误数
rxfram/s:每秒接收数据包的帧对齐错误数
rxfifo/s:接收的数据包每秒FIFO过速的错误数
txfifo/s:发送的数据包每秒FIFO过速的错误数
- 实时监控脚本
[root@Super soft]# cat net.sh
#!/bin/bash
export LANG="en_US.UTF-8"
#export LANG="zh_CN.UTF8"
source /etc/rc.d/init.d/functions
[ -f /etc/profile ] && . /etc/profile
[ -f ~/.bash_profile ] && . ~/.bash_profile
ethn=$1
while true
do
 RX_pre=$(cat /proc/net/dev | grep $ethn | sed 's/:/ /g' | awk '{print $2}')
 TX_pre=$(cat /proc/net/dev | grep $ethn | sed 's/:/ /g' | awk '{print $10}')
 sleep 1
 RX_next=$(cat /proc/net/dev | grep $ethn | sed 's/:/ /g' | awk '{print $2}')
 TX_next=$(cat /proc/net/dev | grep $ethn | sed 's/:/ /g' | awk '{print $10}')

 clear
 echo -e "time \tInterface\t RX   \t   TX"

 RX=$((${RX_next}-${RX_pre}))
 TX=$((${TX_next}-${TX_pre}))

 if [[ $RX -lt 1024 ]];then
 RX="${RX}B/s"
 elif [[ $RX -gt 1048576 ]];then
 RX=$(echo $RX | awk '{print $1/1048576 "MB/s"}')
 else
 RX=$(echo $RX | awk '{print $1/1024 "KB/s"}')
 fi

 if [[ $TX -lt 1024 ]];then
 TX="${TX}B/s"
 elif [[ $TX -gt 1048576 ]];then
 TX=$(echo $TX | awk '{print $1/1048576 "MB/s"}')
 else
 TX=$(echo $TX | awk '{print $1/1024 "KB/s"}')
 fi

 echo -e "`date +%k:%M:%S` $ethn\t\t$RX $TX"
done
[root@Super soft]# ./net.sh ens32
time              Interface            RX                TX
17:16:29           ens32         1.1543KB/s     254B/s
time               Interface           RX                TX
17:16:30           ens32         1.03711KB/s     0B/s
脚本是通过读取运行时文件系统/proc/net/dev中的网络实时数据,并通过简单计算得到的。
Linux 内核提供了一种通过 /proc 文件系统,在运行时访问内核内部数据结构、改变内核设置的机制。proc文件系统是一个伪文件系统,它只存在内存当中,而不占用外存空间。它以文件系统的方式为访问系统内核数据的操作提供接口。用户和应用程序可以通过proc得到系统的信息,并可以改变内核的某些参数。由于系统的信息,如进程,是动态改变的,所以用户或应用程序读取proc文件时,proc文件系统是动态从系统内核读出所需信息并提交的。/proc文件系统中包含了很多目录,其中/proc/net/dev 保存了网络适配器及统计信息。
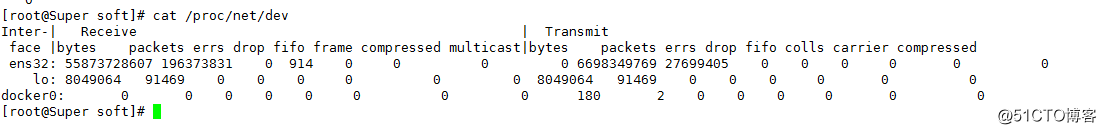
Receive表示收包,
Transmit表示发送包
bytes表示收发的字节数;
packets表示收发正确的包量;
errs表示收发错误的包量;
drop表示收发丢弃的包量;
4、nload命令
查看总带宽使用情况,可以分开来监控入站流量和出站流量。它还可以绘制图表以显示入站流量和出站流量,视图比例可以调整。用起来很简单,不支持许多选项。
CentOS需要从Epel软件库获得nload。
[root@localhost ~]# yum install -y epel-release
[root@localhost ~]# yum install nload -y
[root@localhost ~]# nload -h

nload version 0.7.4
Copyright (C) 2001 - 2012 by Roland Riegel <feedback@roland-riegel.de>
nload comes with ABSOLUTELY NO WARRANTY. This is free software, and you are
welcome to redistribute it under certain conditions. For more details see the
GNU General Public License Version 2 (http://www.gnu.org/copyleft/gpl.html).

Command line syntax:
nload [options] [devices]
nload --help|-h

Options:
-a period       Sets the length in seconds of the time window for average
                calculation.
                Default is 300.    #平均计算时间长度
-i max_scaling  Specifies the 100% mark in kBit/s of the graph indicating the
                incoming bandwidth usage. Ignored if max_scaling is 0 or the
                switch -m is given.
                Default is 10240.    #指定入口流量最大值 单位是kBit/s
-m              Show multiple devices at a time; no traffic graphs.   #同时显示多个设备统计信息
-o max_scaling  Same as -i but for the graph indicating the outgoing bandwidth
                usage.
                Default is 10240.   #和-i相同,但是是出口流量
-t interval     Determines the refresh interval of the display in milliseconds.
                Default is 500.    #刷新间隔,单位是毫秒,
-u h|b|k|m|g    Sets the type of unit used for the display of traffic numbers.
   H|B|K|M|G    h: auto, b: Bit/s, k: kBit/s, m: MBit/s etc.
                H: auto, B: Byte/s, K: kByte/s, M: MByte/s etc.
                Default is h.    #设置右边Curr、Avg、Min、Max的数据单位,默认是自动变的.注意大小写单位不同!
-U h|b|k|m|g    Same as -u, but for a total amount of data (without "/s").
   H|B|K|M|G    Default is H.    #和-u相同,但是为总流量
devices         Network devices to use.
                Default is to use all auto-detected devices.    # 指定网卡,默认是全部监控的,使用左右键切换。
--help
-h              Print this help.

example: nload -t 200 -i 1024 -o 128 -U M

The options above can also be changed at run time by pressing the 'F2' key.     #运行时使用F2可以查看此页

[root@localhost ~]#
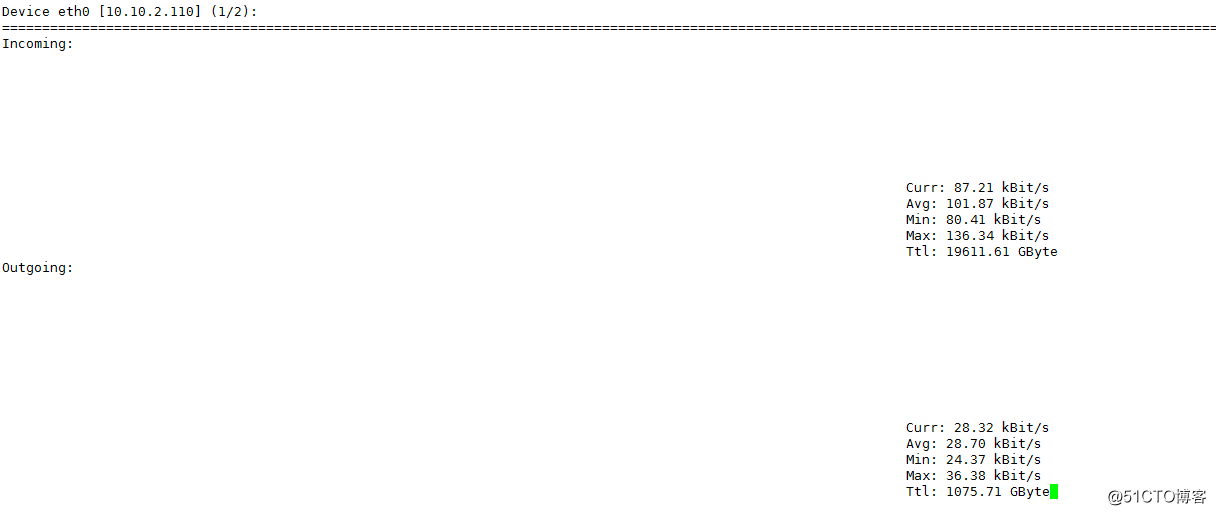
当前流量(Curr),平均流量(Avg),最小流量(Min),最大流量(Max),总和流量(Ttl)
进程的流量
1、nethogs命令
nethogs用来按进程或程序实时统计网络带宽使用率,不依赖内核中的模块。可以显示每个进程所使用的带宽,并对列表排序,将耗用带宽最多的进程排在最上面。yum安装NetHogs需要配置EPEL源,或者https://sourceforge.net/projects/nethogs/ 下载
[root@Super ~]# yum install -y epel-release
[root@Super ~]# yum install libpcap nethogs -y
[root@Super ~]# nethogs --help
nethogs: invalid option -- '-'
usage: nethogs [-V] [-h] [-b] [-d seconds] [-v mode] [-c count] [-t] [-p] [-s] [device [device [device ...]]]
        -V : prints version.
        -h : prints this help.
        -b : bughunt mode - implies tracemode.
        -d : delay for update refresh rate in seconds. default is 1.    #刷新时间,单位秒,默认1秒
        -v : view mode (0 = KB/s, 1 = total KB, 2 = total B, 3 = total MB). default is 0.
        -c : number of updates. default is 0 (unlimited).
        -t : tracemode.       #跟踪模式
        -p : sniff in promiscious mode (not recommended).
        -s : sort output by sent column.
   -a : monitor all devices, even loopback/stopped ones.
        device : device(s) to monitor. default is all interfaces up and running excluding loopback    #监听的设备,默认是eth0,也就是网卡设备名称

When nethogs is running, press:
 q: quit
 s: sort by SENT traffic     #按send进行排序
 r: sort by RECEIVE traffic   #按received进行排序
 m: switch between total (KB, B, MB) and KB/s mode   #按 m 键,切换单位或显示进程占用速度或已统计使用的流量。切换顺序是KB/sec->KB->B->MB
[root@Super ~]#
源码方式安装:
yum install gcc-c++ libpcap-devel.x86_64 libpcap.x86_64 ncurses*
git clone https://github.com/raboof/nethogs
cd nethogs/
make
make install
- 直接运行nethogs 就可以查看当前占用带宽的进程
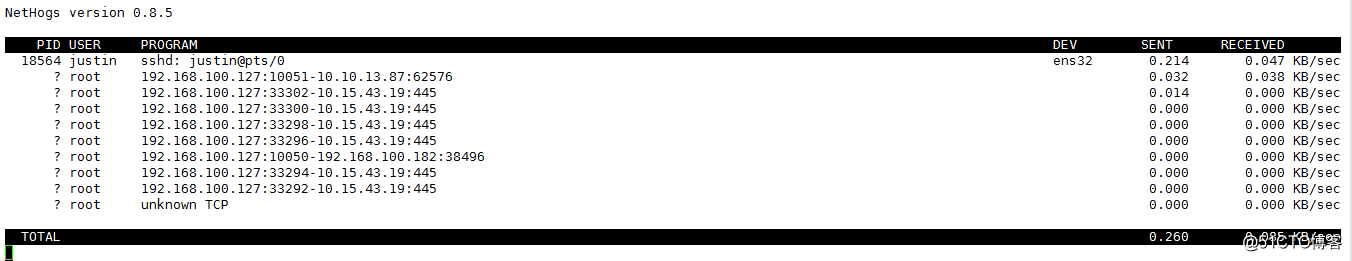
PID(进程ID),运行该进程的用户,命令行或程序,流量将要去往网络接口,发送的字节数,接收的字节数
知道PID和端口后,通过 lsof -i:port 或 ps aux|grep PID就可以知道是哪个进程。
- 监视设备(eth0)的网络带宽
[root@Super ~]# nethogs eth0
- 同时监视eth0和eth1接口
[root@Super ~]# nethogs eth0 eth1

 浙公网安备 33010602011771号