Prometheus环境搭建
一、prometheus基本认识
1、什么是prometheus
Prometheus是最初在SoundCloud上构建的开源系统监视和警报工具包 。
2、特征
普罗米修斯的主要特点是:
- 一个多维数据模型,其中包含通过度量标准名称和键/值对标识的时间序列数据
- PromQL,一种灵活的查询语言 ,可利用此维度
- 不依赖分布式存储;单服务器节点是自治的
- 时间序列收集通过HTTP上的拉模型进行
- 通过中间网关支持推送时间序列
- 通过服务发现或静态配置发现目标
- 多种图形和仪表板支持模式
3、组件
Prometheus生态系统包含多个组件,其中许多是可选的:
- Prometheus主服务器,它会刮取并存储时间序列数据
- 客户端库,用于检测应用程序代码
- 一个支持短期工作的推送网关
- 诸如HAProxy,StatsD,Graphite等服务的专用出口商
- 一个alertmanager处理警报
- 各种支持工具
下图说明了Prometheus的体系结构及其某些生态系统组件:
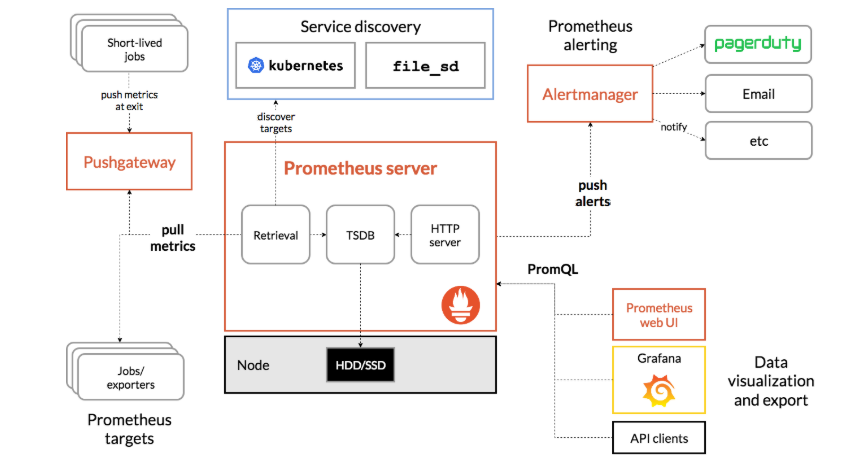
Prometheus直接或通过中间推送网关从已检测的作业中删除指标,以处理短暂的作业。它在本地存储所有报废的样本,并对这些数据运行规则,以汇总和记录现有数据中的新时间序列,或生成警报。Grafana或其他API使用者可以用来可视化收集的数据。
以上摘自官网:https://prometheus.io/docs/introduction/overview/
二、安装prometheus
1、安装包下载:https://github.com/prometheus/prometheus/releases/download/v2.6.1/prometheus-2.6.1.linux-amd64.tar.gz
2、解压安装
# tar zxf prometheus-2.6.1.linux-amd64.tar.gz  -C /usr/local/
# cd /usr/local/prometheus-2.6.1.linux-amd64/
# cat prometheus.yml #修改prometheus.yml配置文件
# my global config
global:
  scrape_interval:     15s # Set the scrape interval to every 15 seconds. Default is every 1 minute.
  evaluation_interval: 15s # Evaluate rules every 15 seconds. The default is every 1 minute.
  # scrape_timeout is set to the global default (10s).

# Alertmanager configuration
alerting:
  alertmanagers:
  - static_configs:
   # - targets: ["localhost:9093"]
      # - alertmanager:9093

# Load rules once and periodically evaluate them according to the global 'evaluation_interval'.
rule_files:
  # - "rules/*.yml"
  # - "first_rules.yml"
  # - "second_rules.yml"

# A scrape configuration containing exactly one endpoint to scrape:
# Here it's Prometheus itself.
scrape_configs:
  # The job name is added as a label `job=<job_name>` to any timeseries scraped from this config.
  - job_name: 'prometheus'

    # metrics_path defaults to '/metrics'
    # scheme defaults to 'http'.

    static_configs:
    - targets: ['172.16.68.169:9090']      #修改prometheus监听的IP和端口,默认9090
- job_name: 'centos7-machine1'
scrape_interval: 10s
static_configs:
- targets: ['172.16.68.169:9100']
labels:
instance: node1
# ./prometheus --version            #查看prometheus版本号
prometheus, version 2.6.1 (branch: HEAD, revision: b639fe140c1f71b2cbad3fc322b17efe60839e7e)
build user: root@4c0e286fe2b3
build date: 20190115-19:12:04
go version: go1.11.4
修改完成,可直接启动
./prometheus --config.file=prometheus.yml
3、设置开机启动
# useradd  prometheus -s /sbin/nologin prometheus  #创建prometheus用户
# chown -R prometheus:prometheus /usr/local/prometheus-2.6.1.linux-amd64
# vim /usr/lib/systemd/system/prometheus.service

[Unit]
Description=Prometheus
Documentation=https://prometheus.io/
After=network.target

[Service]
# Type设置为notify时,服务会不断重启
Type=simple
User=prometheus
ExecStart=/usr/local/prometheus-2.6.1.linux-amd64/prometheus --config.file=/usr/local/prometheus-2.6.1.linux-amd64/prometheus.yml
Restart=on-failure

[Install]
WantedBy=multi-user.target
# chown prometheus:prometheus /usr/lib/systemd/system/prometheus.service
# systemctl start prometheus
# systemctl enable prometheus

三、页面验证
1、web页面:http://IP:9090/
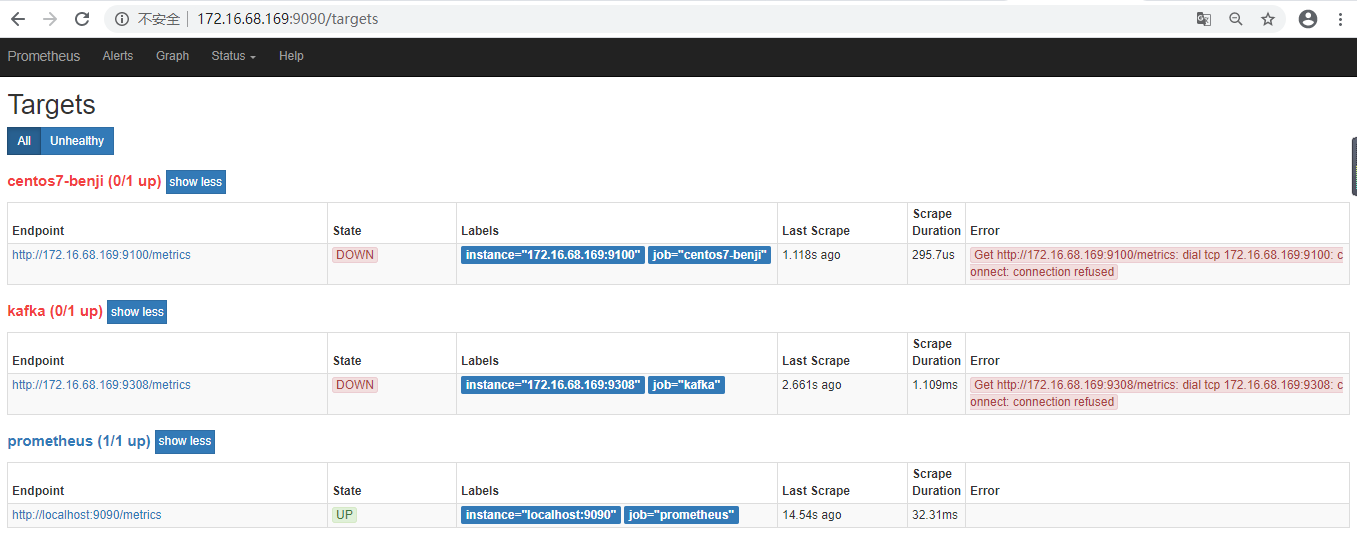
现在还都是down的状态,需要在监控服务器上装exporter
四、安装exporter
1、安装node_exporter
下载包:https://github.com/prometheus/node_exporter/releases/download/v0.18.0/node_exporter-0.18.0.linux-amd64.tar.gz
# tar zxf node_exporter-0.18.0.linux-amd64.tar.gz -C /usr/local/
# /usr/local/node_exporter/node_exporter &

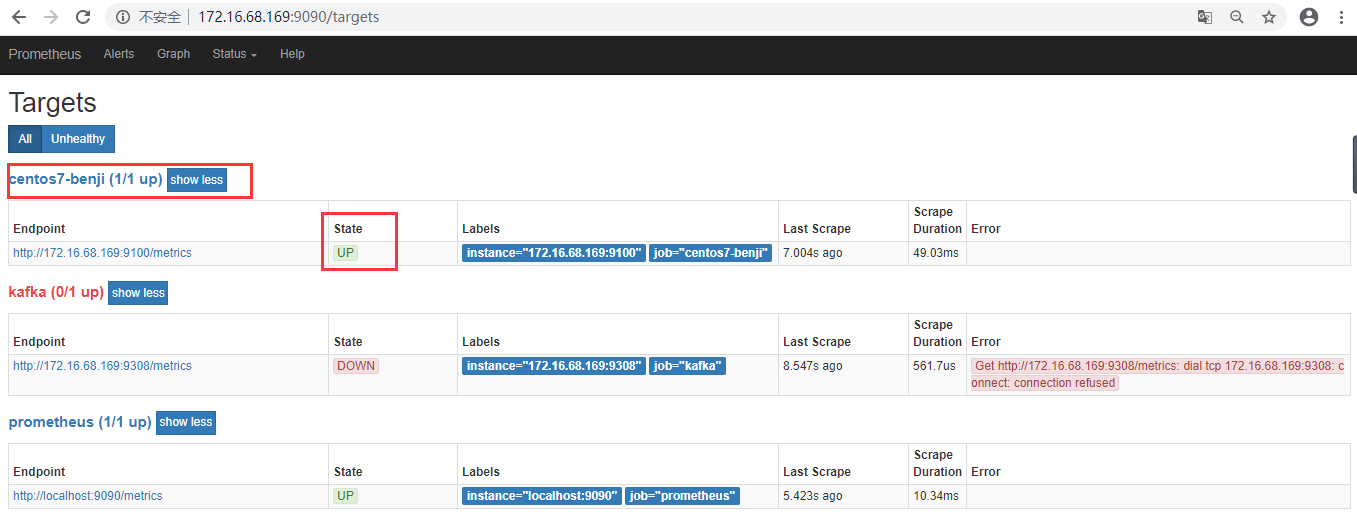
prometeus页面centos7-benji监控状态已经UP,通过http://IP:9100抓取指标。
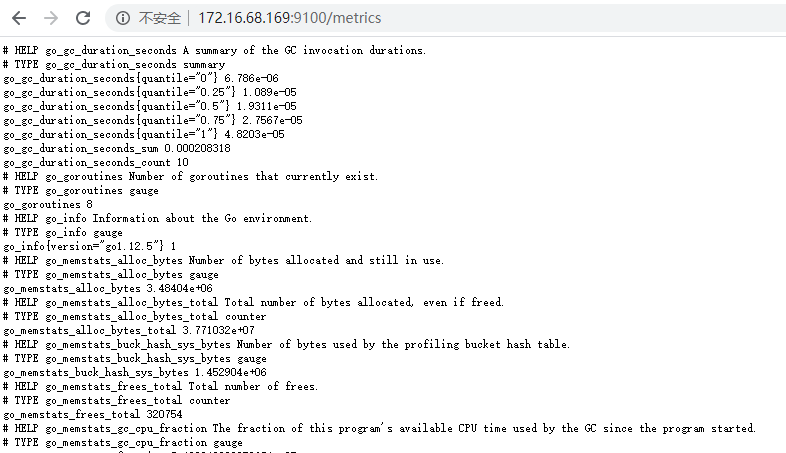
可以通过对/metrics端点进行URL验证来验证是否正在导出指标:

 浙公网安备 33010602011771号