

记录python+pyside+qml+qtcharts 使用,防踩坑
使用QML-qtquick 进行开发时,有个使用chart图表的需求,看了一大圈,网上都是qmake或是cmake来构建QTchart,用python开发也只搜到QtWidgets模块进行图表绘制。然而我对qtwidgets不是很了解,想要的是QML开发,在使用ChartView{}时一直闪退,没有效果。经历了苦苦搜寻,终于在 https://stackoverflow.com/questions/57536401/how-to-add-qml-scatterseries-to-existing-qml-defined-chartview/57541374#57541374 这个文章下搜寻到我想要的了。
python文件
import sys
from PySide6 import  QtWidgets, QtQml


if __name__ == "__main__":
    #一定要使用QtWidgets
    #app = QGuiApplication().instance()
    app = QtWidgets.QApplication(sys.argv)
    engine = QtQml.QQmlApplicationEngine()
    engine.load("main.qml")
    if not engine.rootObjects():
        sys.exit(-1)

    sys.exit(app.exec())
main.qml
import QtQuick
import QtQuick.Controls
import QtCharts

ApplicationWindow {
    visible: true
    width: 640
    height: 480
    Rectangle{
        width:640
        height:80
        anchors.top:parent.top
        color:"pink"
        Text{
            anchors.centerIn:parent
            text:'折线图'
        }
    }
    Rectangle {
        width:640
        height:400
        anchors.bottom:parent.bottom
        ChartView {
            title: "Line Chart"
            anchors.fill: parent
            antialiasing: true

            LineSeries {
                name: "Line"
                XYPoint { x: 0; y: 0 }
                XYPoint { x: 1.1; y: 2.1 }
                XYPoint { x: 1.9; y: 3.3 }
                XYPoint { x: 2.1; y: 2.1 }
                XYPoint { x: 2.9; y: 4.9 }
                XYPoint { x: 3.4; y: 3.0 }
                XYPoint { x: 4.1; y: 3.3 }
            }
        }
    }
}
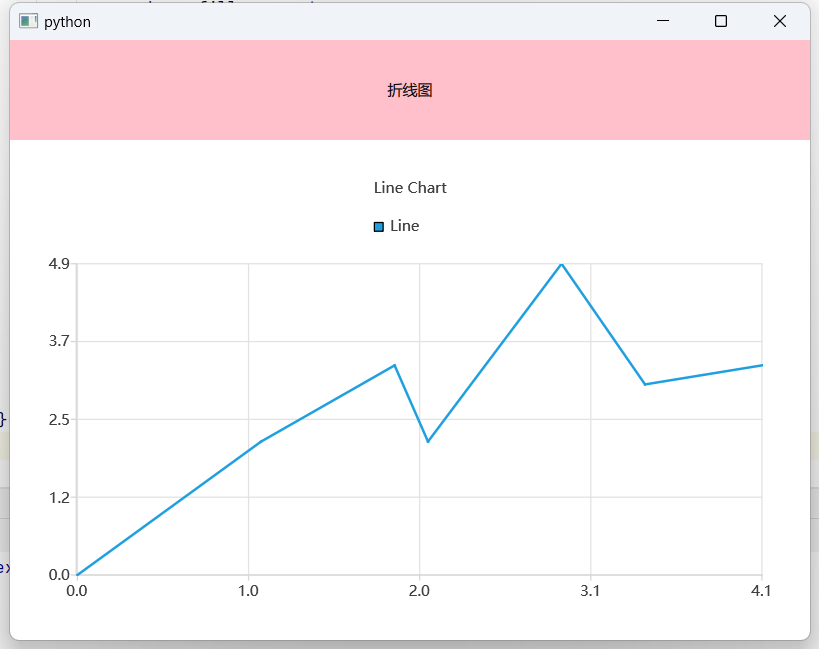
这样就能愉快的使ChartView{}绘制图表了
官网例子:https://doc.qt.io/qt-6/qtcharts-qmlchartsgallery-example.html
下面是图表与python数据交互
折线图
python
import sys
import random
from PySide6 import QtCore,QtWidgets, QtQml, QtCharts

class DataModel(QtCore.QObject):
    @QtCore.Slot(QtCharts.QAbstractSeries)
    def fill_serie(self, serie):
        for x in range(10):  # 10 个数据点
            y = random.randint(0, 100)  # 随机 y 值
            serie.append(x, y)  # 添加数据点

if __name__ == "__main__":
    app = QtWidgets.QApplication(sys.argv)
    engine = QtQml.QQmlApplicationEngine()
    data_model = DataModel()
    engine.rootContext().setContextProperty("dataModel", data_model)
    engine.load("main.qml")
    if not engine.rootObjects():
        sys.exit(-1)
    sys.exit(app.exec())
main.qml
import QtQuick
import QtQuick.Controls
import QtCharts

ApplicationWindow {
    visible: true
    width: 640
    height: 480
    Rectangle{
        width:640
        height:80
        anchors.top:parent.top
        color:"pink"
        Text{
            anchors.centerIn:parent
            text:'折线图'
        }
    }
    Rectangle {
        width:640
        height:400
        anchors.bottom:parent.bottom
        ChartView {
            anchors.fill: parent
            id: chartView

            // 定义 X 轴和 Y 轴
            ValueAxis {
                id: xAxis
                min: 0
                max: 10
            }

            ValueAxis {
                id: yAxis
                min: 0
                max: 100
            }

            Component.onCompleted: {
                // 创建折线图系列
                var serie = chartView.createSeries(ChartView.SeriesTypeLine, "line series", xAxis, yAxis);
                // 填充数据
                dataModel.fill_serie(serie);
            }
        }
    }
}
持续刷新可以加个定时器。Timer

 浙公网安备 33010602011771号