
Android开源图表之树状图和饼状图的官方示例的整理
最近由于工作需要,所以就在github上搜了下关于chart的三方框架
官方地址https://github.com/PhilJay/MPAndroidChart
由于工作需要我这里整理了一份Eclipse版本的类库.(有需要要的留下邮箱)
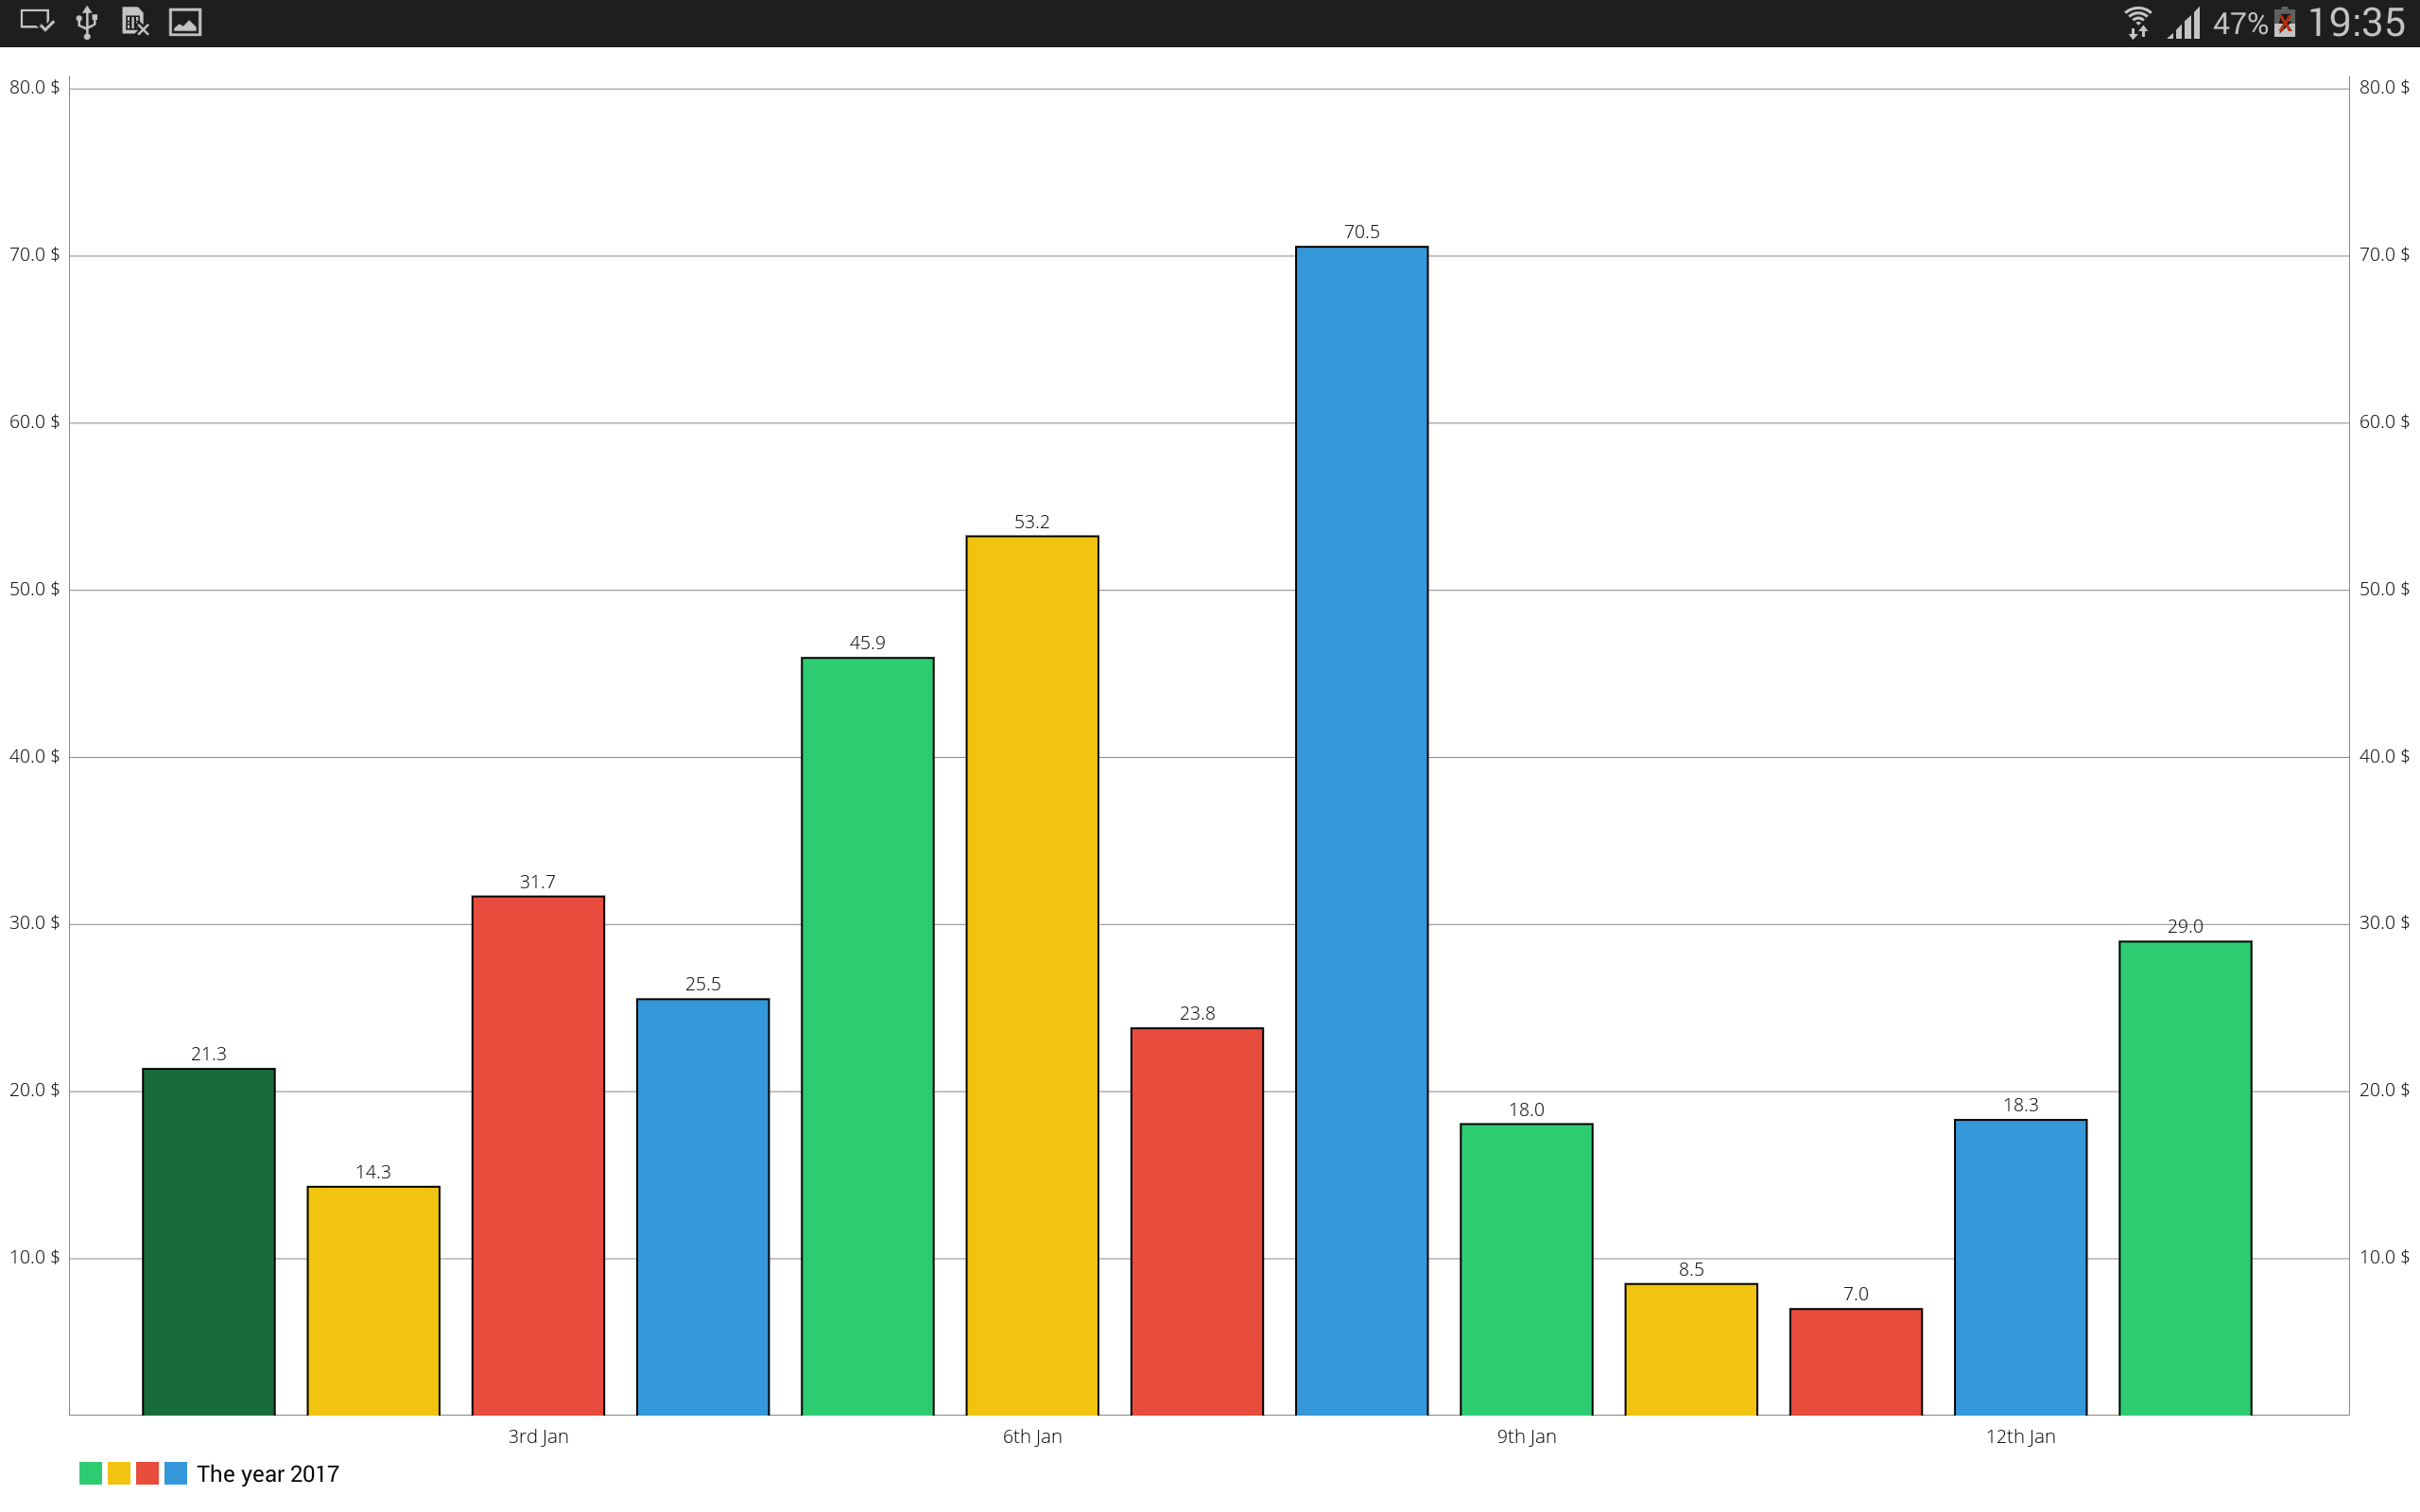
这就是Code中的效果(树状图)
  1 public class BarChartActivity extends Activity implements OnChartValueSelectedListener{
  2
  3     private BarChart mChart;
  4     private Typeface mTfLight;
  5
  6     @Override
  7     protected void onCreate(Bundle savedInstanceState) {
  8         // TODO Auto-generated method stub
  9         super.onCreate(savedInstanceState);
 10         setContentView(R.layout.activity_barchart);
 11
 12         mTfLight = Typeface.createFromAsset(getAssets(), "OpenSans-Light.ttf");
 13
 14         mChart = (BarChart) findViewById(R.id.chart1);
 15         mChart.setOnChartValueSelectedListener(this);
 16
 17         mChart.setDrawBarShadow(false);//--绘制当前展示的内容顶部阴影
 18         mChart.setDrawValueAboveBar(true);//--绘制的图形都在bar顶部
 19
 20         mChart.setDescription("");
 21
 22         // if more than 60 entries are displayed in the chart, no values will be
 23         // drawn
 24         mChart.setMaxVisibleValueCount(80); //Y方向的最大值.
 25
 26         // scaling can now only be done on x- and y-axis separately
 27         mChart.setPinchZoom(false);  //--双指缩放.
 28
 29         mChart.setDrawGridBackground(false);//--绘制中心内容区域背景色.
 30         // mChart.setDrawYLabels(false);
 31
 32         XAxis xAxis = mChart.getXAxis();
 33         xAxis.setPosition(XAxisPosition.BOTTOM);
 34         xAxis.setTypeface(mTfLight);
 35         xAxis.setDrawGridLines(false);//--是否绘制竖直分割线.
 36         xAxis.setGranularity(1f); // only intervals of 1 day  底部label的分割间隙
 37         xAxis.setLabelCount(5);  //--对应的当前绘制在底部的label数
 38         xAxis.setValueFormatter(new DayAxisValueFormatter(mChart));
 39
 40         AxisValueFormatter custom = new MyAxisValueFormatter();
 41
 42         YAxis leftAxis = mChart.getAxisLeft();
 43         leftAxis.setTypeface(mTfLight);
 44         leftAxis.setDrawGridLines(false); //-绘制水平分割线,按照当前Y方向的label点为起始点
 45         leftAxis.setLabelCount(8, false); //--绘制Y方向(应该)被显示的数量,第二个参数表示label是否是精准变化,还是近似变化
 46         leftAxis.setValueFormatter(custom);
 47         leftAxis.setPosition(YAxisLabelPosition.OUTSIDE_CHART);//Y方向文字的位置,在线外侧.(默认在外侧)
 48         leftAxis.setSpaceTop(15f);  //分割线的间距百分比.
 49         leftAxis.setAxisMinValue(0f); // this replaces setStartAtZero(true)  Y方向的起始值.
 50
 51         YAxis rightAxis = mChart.getAxisRight();
 52         rightAxis.setDrawGridLines(true); //-绘制水平分割线,按照当前Y方向的label点为起始点
 53         rightAxis.setTypeface(mTfLight);
 54         rightAxis.setLabelCount(8, false);
 55         rightAxis.setValueFormatter(custom);
 56         rightAxis.setSpaceTop(15f);
 57         rightAxis.setAxisMinValue(0f); // this replaces setStartAtZero(true)
 58
 59         Legend l = mChart.getLegend();
 60         l.setForm(LegendForm.SQUARE); //--设置legend的形状.
 61         l.setPosition(LegendPosition.BELOW_CHART_LEFT); //--设置legend的位置.
 62         l.setFormSize(12f);            //--设置legend的大小
 63         l.setTextSize(12f);               //--设置legend上的文字大小
 64 //        l.setXEntrySpace(100f);
 65         l.setYOffset(30f);
 66         // l.setExtra(ColorTemplate.VORDIPLOM_COLORS, new String[] { "abc",
 67         // "def", "ghj", "ikl", "mno" });
 68         // l.setCustom(ColorTemplate.VORDIPLOM_COLORS, new String[] { "abc",
 69         // "def", "ghj", "ikl", "mno" });
 70         mChart.animateY(3000);
 71         mChart.setPinchZoom(true);
 72         setData(12, 80);
 73     }
 74
 75     private void setData(int count, float range) {
 76
 77         float start = 0f;
 78
 79         mChart.getXAxis().setAxisMinValue(start);
 80         mChart.getXAxis().setAxisMaxValue(start + count + 2);
 81
 82         ArrayList<BarEntry> yVals1 = new ArrayList<BarEntry>();
 83
 84         for (int i = (int) start; i < start + count + 1; i++) {
 85             float mult = (range + 1);
 86             float val = (float) (Math.random() * mult);
 87             BarEntry barEntry = new BarEntry(i + 1f, val);
 88
 89             yVals1.add(barEntry);
 90         }
 91
 92         BarDataSet set1;
 93
 94         if (mChart.getData() != null &&
 95                 mChart.getData().getDataSetCount() > 0) {
 96             set1 = (BarDataSet) mChart.getData().getDataSetByIndex(0);
 97             set1.setValues(yVals1);
 98             mChart.getData().notifyDataChanged();
 99             mChart.notifyDataSetChanged();
100         } else {
101             set1 = new BarDataSet(yVals1, "The year 2017");
102             set1.setBarBorderWidth(1);
103             set1.setColors(ColorTemplate.MATERIAL_COLORS);
104
105             ArrayList<IBarDataSet> dataSets = new ArrayList<IBarDataSet>();
106             dataSets.add(set1);
107
108             BarData data = new BarData(dataSets);
109             data.setValueTextSize(10f);
110             data.setValueTypeface(mTfLight);
111
112             data.setBarWidth(0.8f);//--设置bar的宽度 ,取值(0-1).
113
114             mChart.setData(data);
115         }
116     }
117
118     protected RectF mOnValueSelectedRectF = new RectF();
119
120     @Override
121     public void onValueSelected(Entry e, Highlight h) {
122         // TODO Auto-generated method stub
123          if (e == null)
124                 return;
125
126             RectF bounds = mOnValueSelectedRectF;
127             mChart.getBarBounds((BarEntry) e, bounds);
128             MPPointF position = mChart.getPosition(e, AxisDependency.LEFT);
129
130             Log.i("bounds", bounds.toString());
131             Log.i("position", position.toString());
132
133             Log.i("x-index",
134                     "low: " + mChart.getLowestVisibleX() + ", high: "
135                             + mChart.getHighestVisibleX());
136
137             MPPointF.recycleInstance(position);
138     }
139
140     @Override
141     public void onNothingSelected() {
142         // TODO Auto-generated method stub
143
144     }
145
146     @Override
147     public boolean onCreateOptionsMenu(Menu menu) {
148         getMenuInflater().inflate(R.menu.bar, menu);
149         return true;
150     }
151
152     @Override
153     public boolean onOptionsItemSelected(MenuItem item) {
154
155         switch (item.getItemId()) {
156             case R.id.actionToggleValues: {
157                 for (IDataSet set : mChart.getData().getDataSets())
158                     set.setDrawValues(!set.isDrawValuesEnabled());
159
160                 mChart.invalidate();
161                 break;
162             }
163             case R.id.actionToggleHighlight: {
164                 if (mChart.getData() != null) {
165                     mChart.getData().setHighlightEnabled(!mChart.getData().isHighlightEnabled());
166                     mChart.invalidate();
167                 }
168                 break;
169             }
170             case R.id.actionTogglePinch: {
171                 if (mChart.isPinchZoomEnabled())
172                     mChart.setPinchZoom(false);
173                 else
174                     mChart.setPinchZoom(true);
175
176                 mChart.invalidate();
177                 break;
178             }
179             case R.id.actionToggleAutoScaleMinMax: {
180                 mChart.setAutoScaleMinMaxEnabled(!mChart.isAutoScaleMinMaxEnabled());
181                 mChart.notifyDataSetChanged();
182                 break;
183             }
184             case R.id.actionToggleBarBorders: {
185                 for (IBarDataSet set : mChart.getData().getDataSets())
186                     ((BarDataSet) set).setBarBorderWidth(set.getBarBorderWidth() == 1.f ? 0.f : 1.f);
187
188                 mChart.invalidate();
189                 break;
190             }
191             case R.id.animateX: {
192                 mChart.animateX(3000);
193                 break;
194             }
195             case R.id.animateY: {
196                 mChart.animateY(3000);
197                 break;
198             }
199             case R.id.animateXY: {
200
201                 mChart.animateXY(3000, 3000);
202                 break;
203             }
204             case R.id.actionSave: {
205                 if (mChart.saveToGallery("title" + System.currentTimeMillis(), 50)) {
206                     Toast.makeText(getApplicationContext(), "Saving SUCCESSFUL!",
207                             Toast.LENGTH_SHORT).show();
208                 } else
209                     Toast.makeText(getApplicationContext(), "Saving FAILED!", Toast.LENGTH_SHORT)
210                             .show();
211                 break;
212             }
213         }
214         return true;
215     }
上述代码中关键点已经加入注释,纯属自己个个人研究理解,那里理解不对的地方,回应告知
说完树状图紧接着就是饼状图我这里分别实现了两种,不过基本code都是一样的
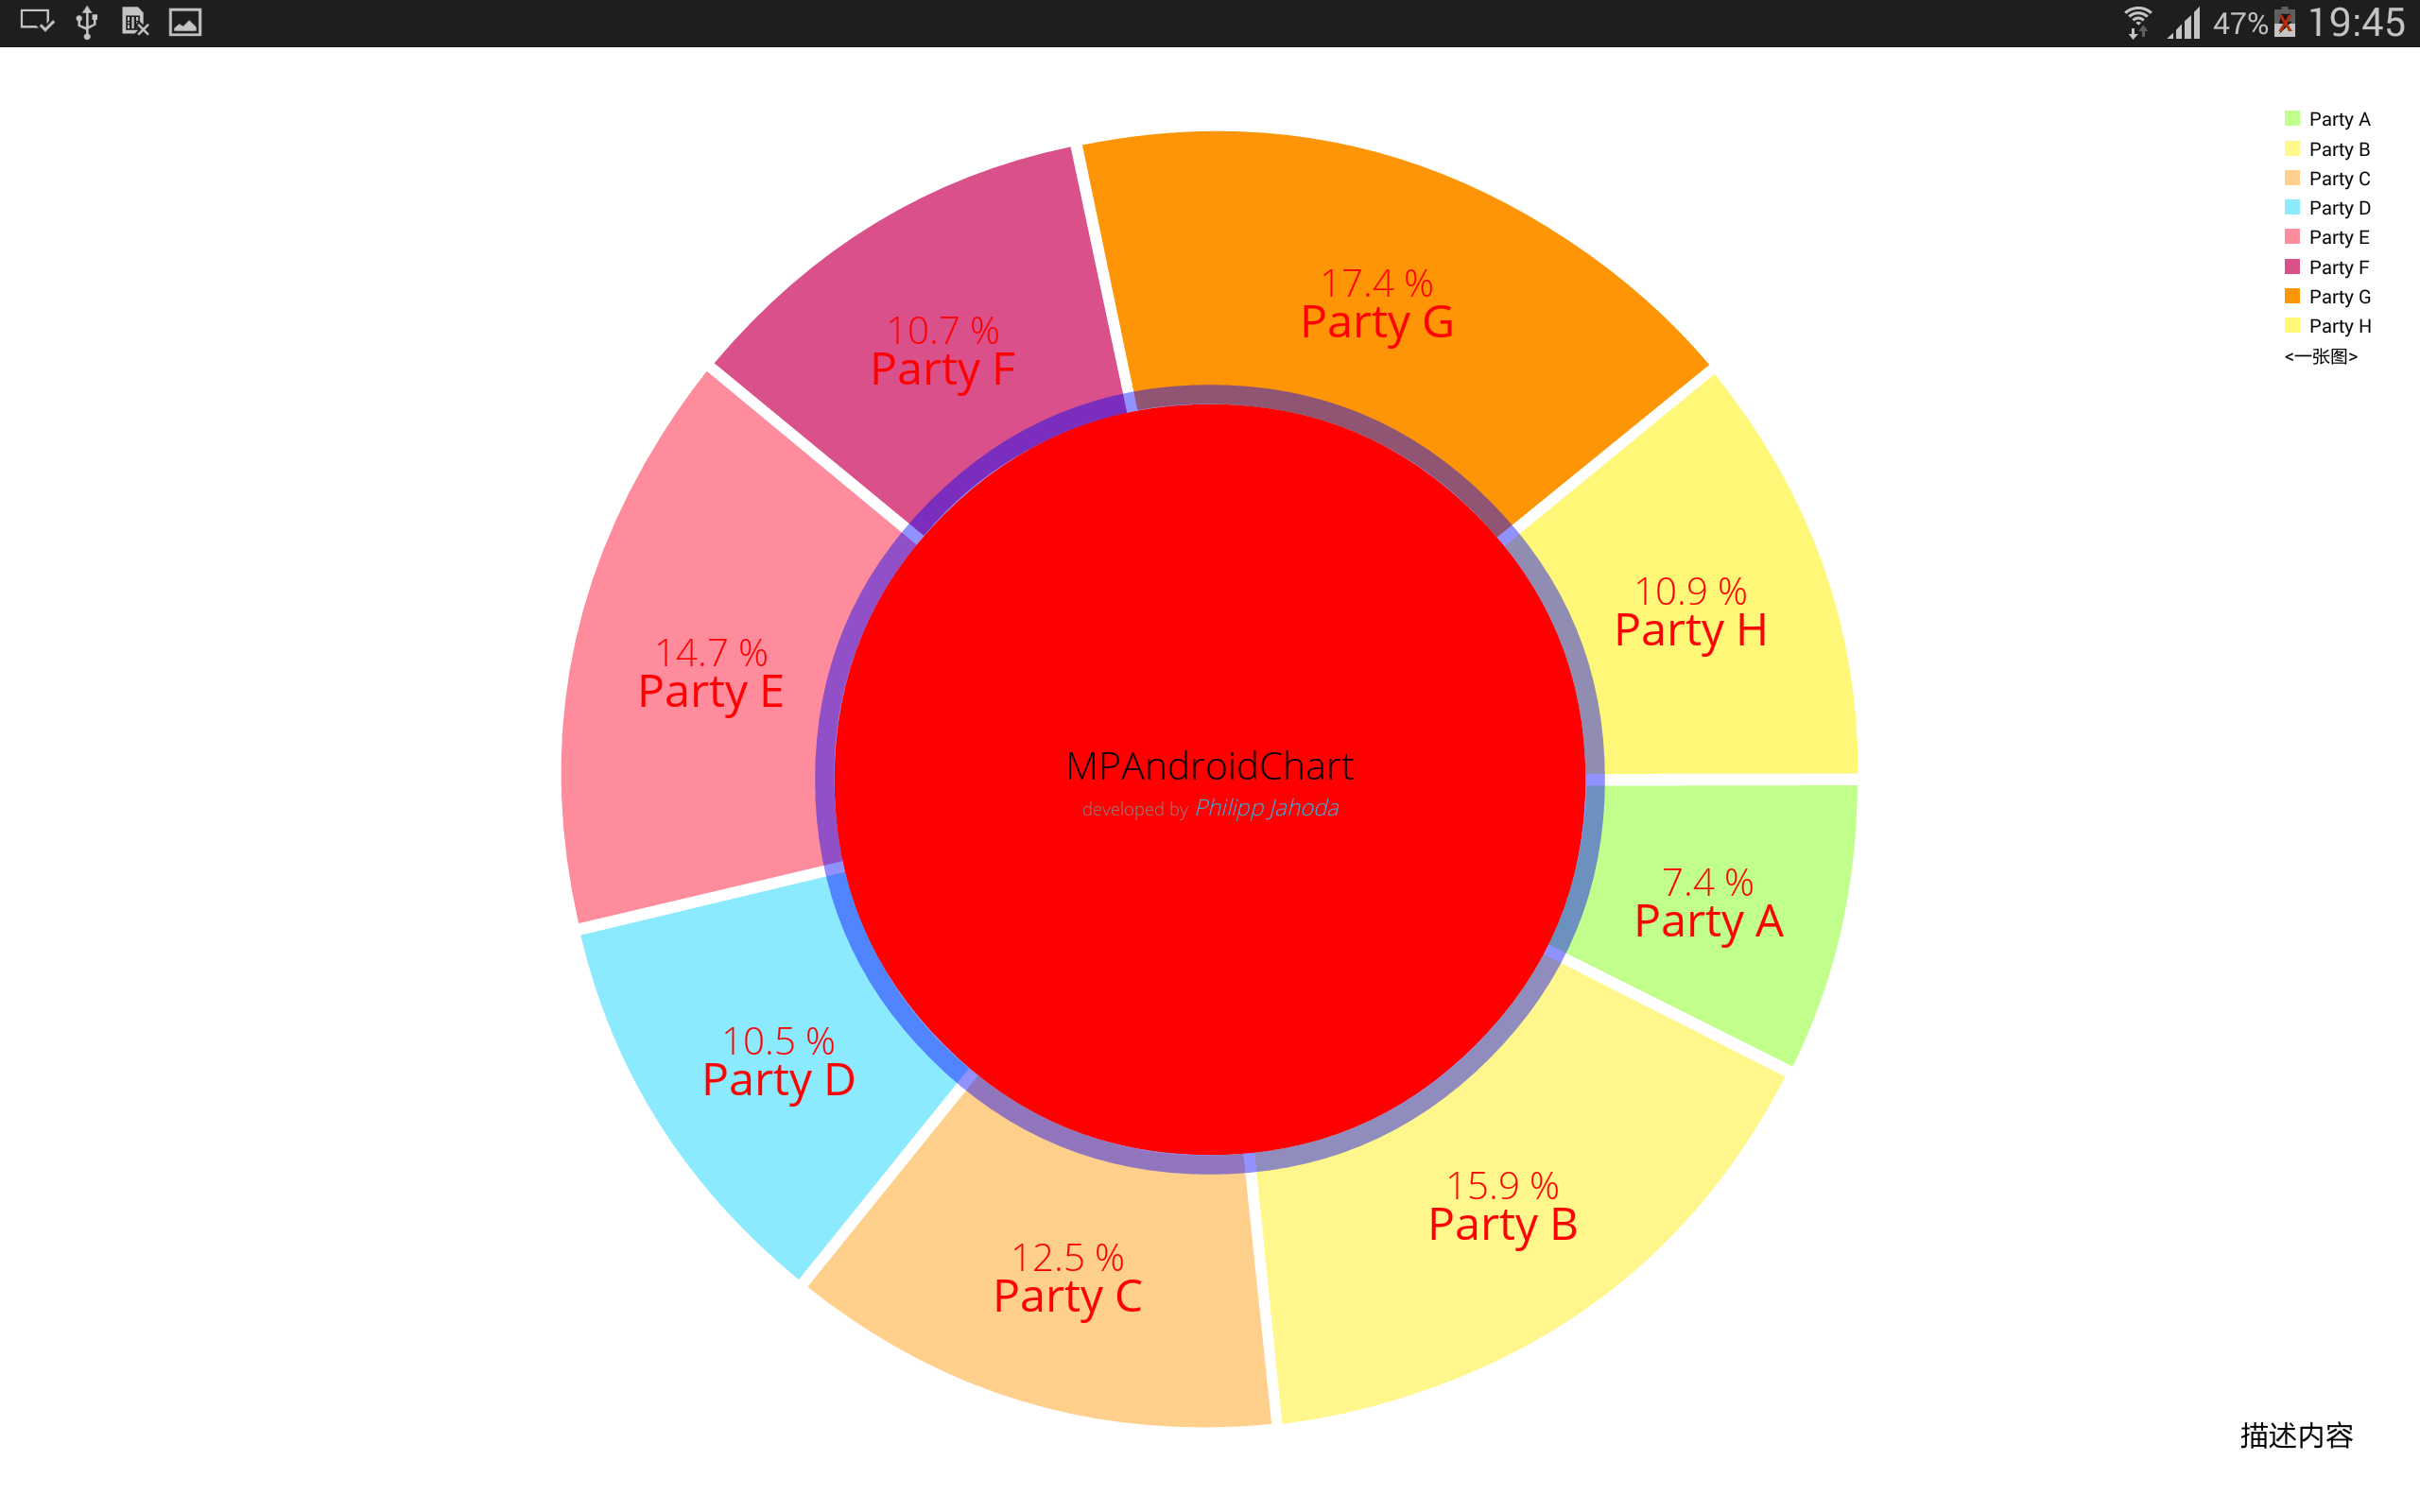
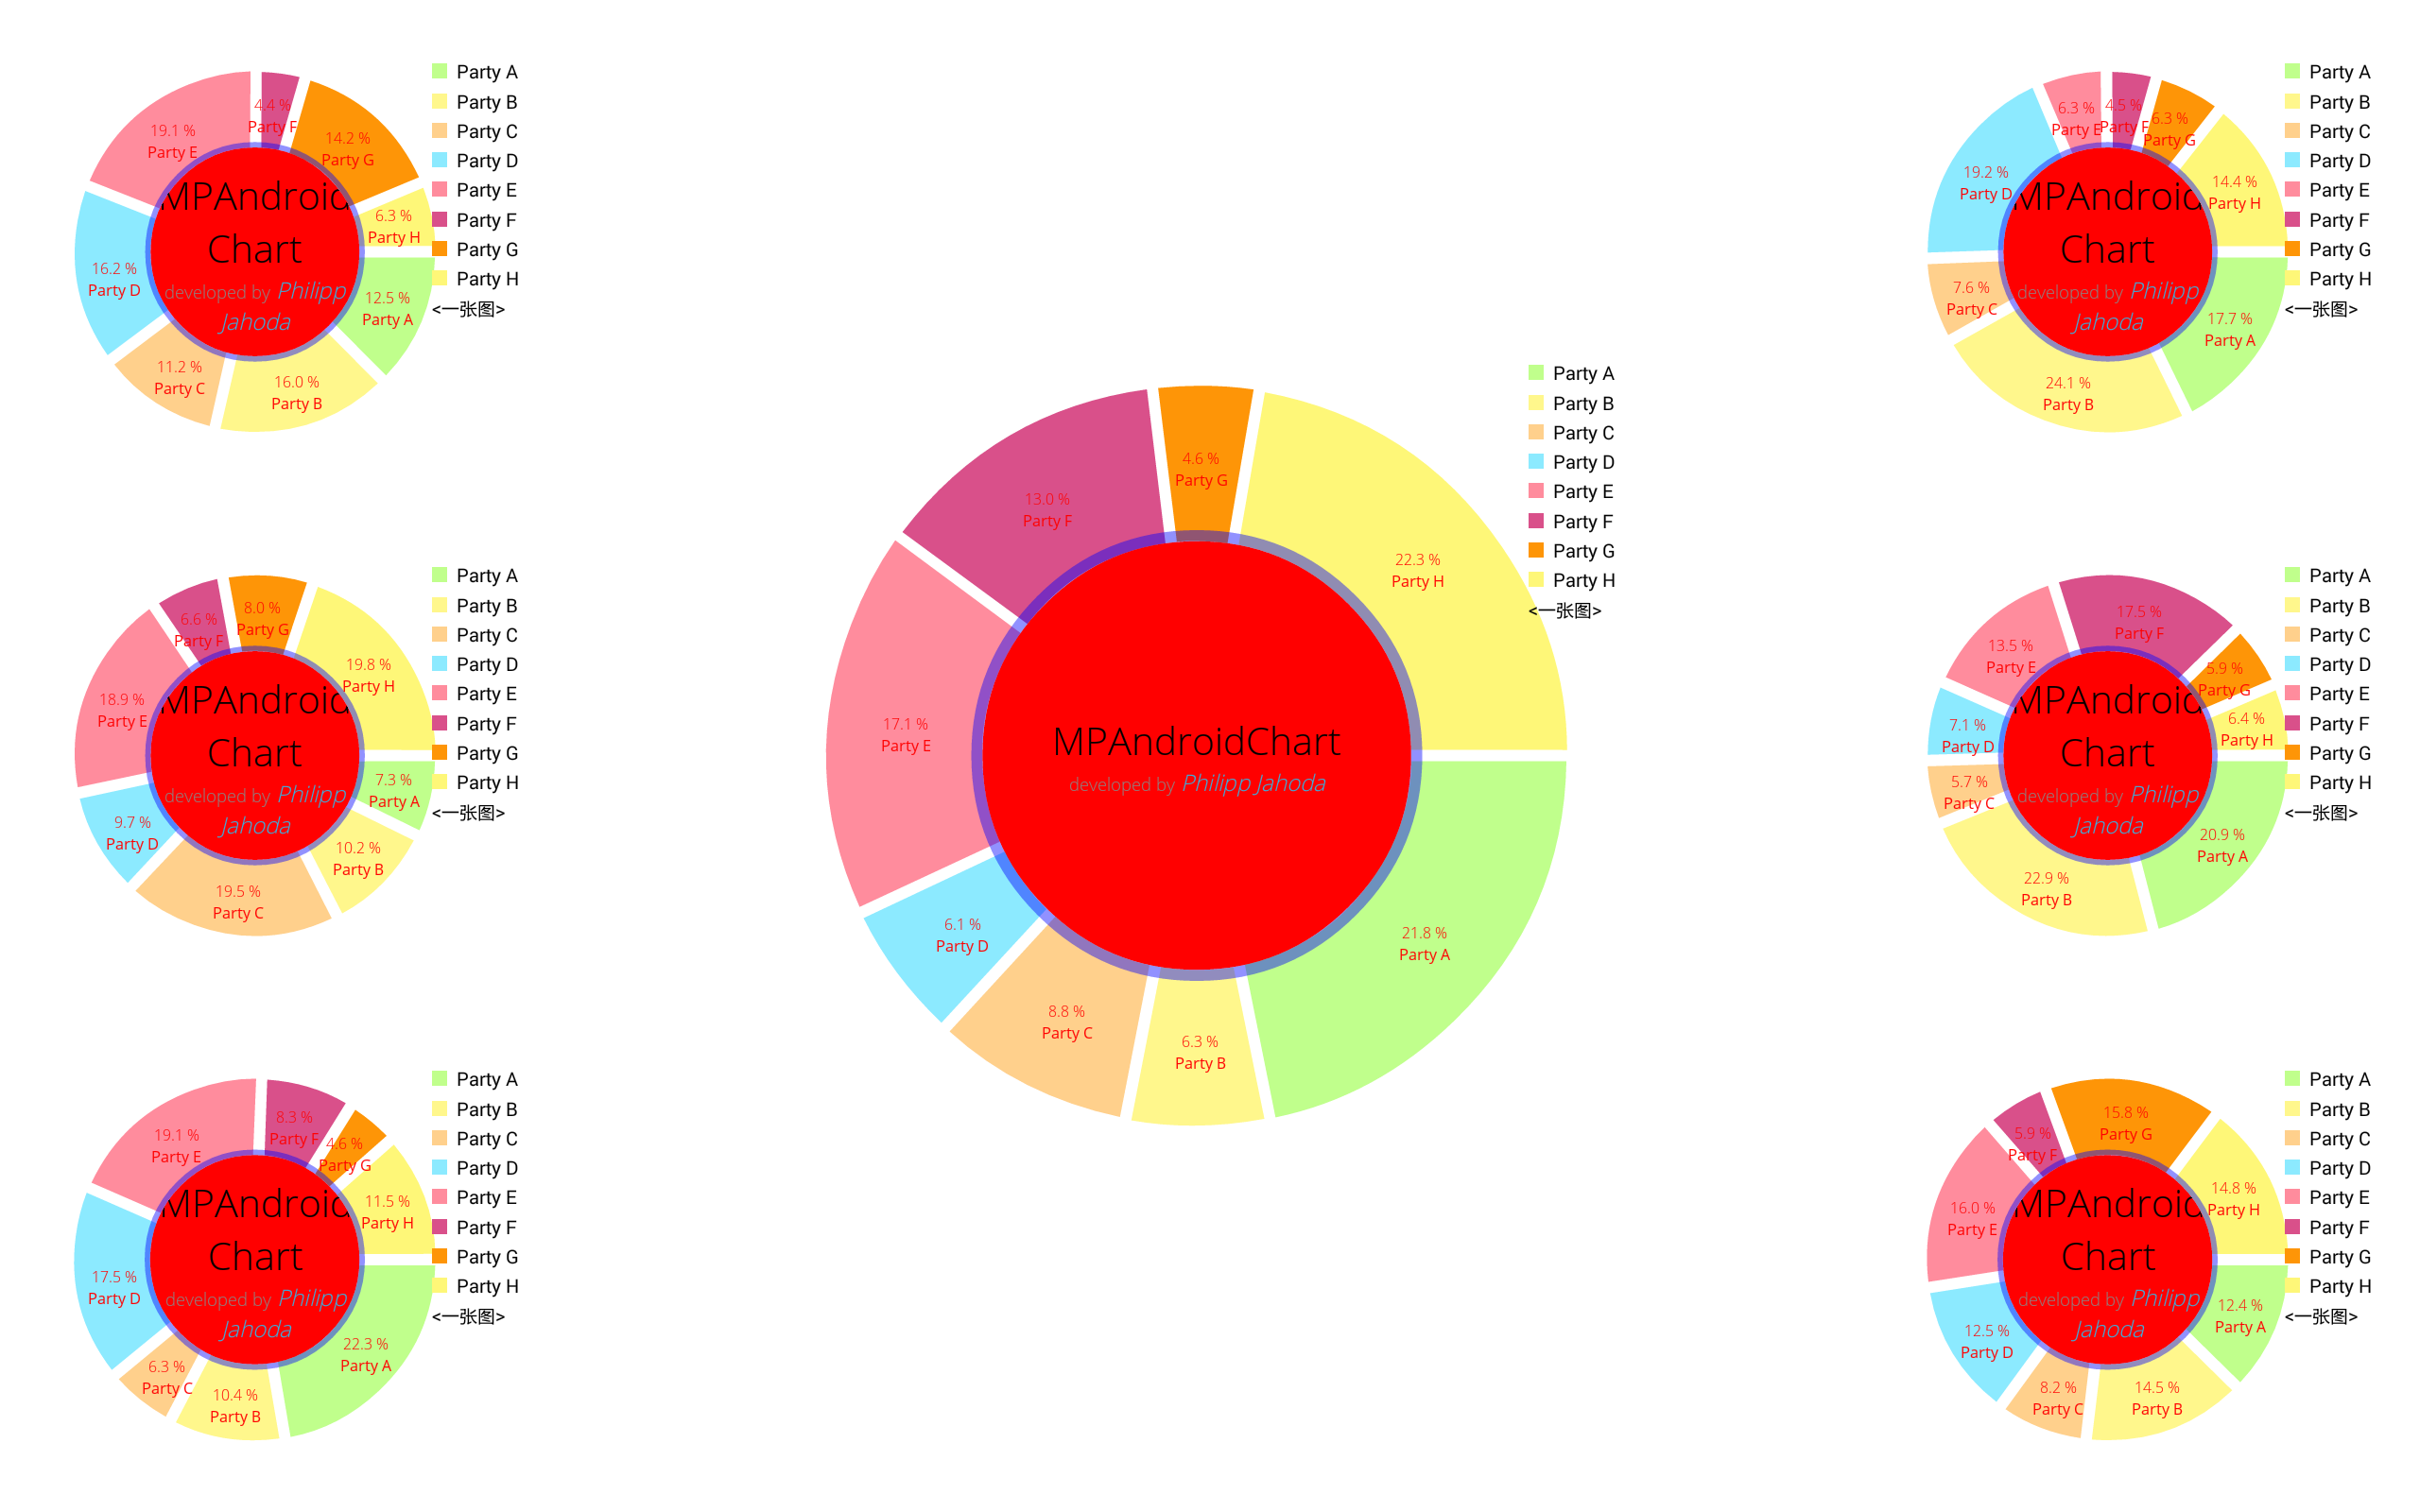
不多说直接上代码:
  1 public class PieChartActivity extends Activity implements OnChartValueSelectedListener {
  2
  3     private PieChart mChart;
  4     private Typeface mTfRegular;
  5     private Typeface mTfLight;
  6
  7     protected String[] mMonths = new String[] {
  8                 "Jan", "Feb", "Mar", "Apr", "May", "Jun", "Jul", "Aug", "Sep", "Okt", "Nov", "Dec"
  9     };
 10
 11     protected String[] mParties = new String[] {
 12             "Party A", "Party B", "Party C", "Party D", "Party E", "Party F", "Party G", "Party H",
 13             "Party I", "Party J", "Party K", "Party L", "Party M", "Party N", "Party O", "Party P",
 14             "Party Q", "Party R", "Party S", "Party T", "Party U", "Party V", "Party W", "Party X",
 15             "Party Y", "Party Z"
 16     };
 17
 18     @Override
 19     protected void onCreate(Bundle savedInstanceState) {
 20         super.onCreate(savedInstanceState);
 21         setContentView(R.layout.activity_main);
 22
 23         mTfRegular = Typeface.createFromAsset(getAssets(), "OpenSans-Regular.ttf");
 24         mTfLight = Typeface.createFromAsset(getAssets(), "OpenSans-Light.ttf");
 25
 26         mChart = (PieChart) findViewById(R.id.chart1);
 27         mChart.setUsePercentValues(true);
 28         mChart.setDescription("描述内容");
 29         mChart.setDescriptionTextSize(20);
 30
 31         mChart.setExtraOffsets(5, 5, 5, 5);
 32
 33         mChart.setDragDecelerationFrictionCoef(0.95f);
 34
 35         mChart.setCenterTextTypeface(mTfLight);
 36         mChart.setCenterText(generateCenterSpannableText());//--设置中心点文字
 37
 38         mChart.setDrawHoleEnabled(true);
 39         mChart.setHoleColor(Color.RED);
 40
 41         mChart.setTransparentCircleColor(Color.BLUE);//--内圆边框色
 42         mChart.setTransparentCircleAlpha(110);       //--内圆边框透明度
 43
 44         mChart.setHoleRadius(58f); //--内院半径
 45         mChart.setTransparentCircleRadius(61f); //--内圆边框大小半径
 46
 47         mChart.setDrawCenterText(true);
 48
 49         mChart.setRotationAngle(0); //--绘制的开始位置
 50         // enable rotation of the chart by touch
 51         mChart.setRotationEnabled(true);     //--允许旋转
 52         mChart.setHighlightPerTapEnabled(true); //---允许点击其中某个扇形区域.
 53
 54         // add a selection listener
 55         mChart.setOnChartValueSelectedListener(this);
 56
 57         setData(8, 100);
 58
 59         mChart.animateY(1400, Easing.EasingOption.EaseInOutQuad);
 60
 61         Legend l = mChart.getLegend();
 62         l.setPosition(LegendPosition.RIGHT_OF_CHART);
 63         l.setXEntrySpace(100f);
 64         l.setYEntrySpace(0f);
 65         l.setYOffset(0f);
 66
 67         // entry label styling
 68         mChart.setEntryLabelColor(Color.RED); //--设置饼状图其中各个块上的文字颜色
 69         mChart.setEntryLabelTypeface(mTfRegular);//---设置字体
 70         mChart.setEntryLabelTextSize(24f);    //--设置字体大小
 71     }
 72
 73      private void setData(int count, float range) {
 74
 75             float mult = range;
 76
 77             ArrayList<PieEntry> entries = new ArrayList<PieEntry>();
 78
 79             // NOTE: The order of the entries when being added to the entries array determines their position around the center of
 80             // the chart.
 81             for (int i = 0; i < count ; i++) {
 82                 entries.add(new PieEntry((float) ((Math.random() * mult) + mult / 5), mParties[i % mParties.length]));
 83             }
 84
 85 //            PieEntry --参数说明:第一个参数代表半分比,第二个参数表示名字。
 86
 87             PieDataSet dataSet = new PieDataSet(entries, "<一张图>");
 88             dataSet.setSliceSpace(6f);//--饼状图
 89             dataSet.setSelectionShift(15f);//--选中饼状图时,向外扩张的大小.
 90
 91             // add a lot of colors
 92
 93             ArrayList<Integer> colors = new ArrayList<Integer>();
 94
 95             for (int c : ColorTemplate.VORDIPLOM_COLORS)
 96                 colors.add(c);
 97
 98             for (int c : ColorTemplate.JOYFUL_COLORS)
 99                 colors.add(c);
100
101             for (int c : ColorTemplate.COLORFUL_COLORS)
102                 colors.add(c);
103
104             for (int c : ColorTemplate.LIBERTY_COLORS)
105                 colors.add(c);
106
107             for (int c : ColorTemplate.PASTEL_COLORS)
108                 colors.add(c);
109
110             colors.add(ColorTemplate.getHoloBlue());
111
112             dataSet.setColors(colors);
113
114             PieData data = new PieData(dataSet);
115             data.setValueFormatter(new PercentFormatter());
116             data.setValueTextSize(20f);       //--设置字体大小
117             data.setValueTextColor(Color.RED);//--设置饼状图其中各个块上的百分比颜色
118             data.setValueTypeface(mTfLight);  //--设置字体
119             mChart.setData(data);
120
121             // undo all highlights
122             mChart.highlightValues(null);
123
124             mChart.invalidate();
125         }
126
127
128     private SpannableString generateCenterSpannableText() {
129
130         SpannableString s = new SpannableString("MPAndroidChart\ndeveloped by Philipp Jahoda");
131         s.setSpan(new RelativeSizeSpan(1.7f), 0, 14, 0);
132         s.setSpan(new StyleSpan(Typeface.NORMAL), 14, s.length() - 15, 0);
133         s.setSpan(new ForegroundColorSpan(Color.GRAY), 14, s.length() - 15, 0);
134         s.setSpan(new RelativeSizeSpan(.8f), 14, s.length() - 15, 0);
135         s.setSpan(new StyleSpan(Typeface.ITALIC), s.length() - 14, s.length(), 0);
136         s.setSpan(new ForegroundColorSpan(ColorTemplate.getHoloBlue()), s.length() - 14, s.length(), 0);
137         return s;
138     }
139
140     @Override
141     public boolean onCreateOptionsMenu(Menu menu) {
142         getMenuInflater().inflate(R.menu.pie, menu);
143         return true;
144     }
145
146     @Override
147     public boolean onOptionsItemSelected(MenuItem item) {
148
149         switch (item.getItemId()) {
150             case R.id.actionToggleValues: {
151                 for (IDataSet<?> set : mChart.getData().getDataSets())
152                     set.setDrawValues(!set.isDrawValuesEnabled());
153
154                 mChart.invalidate();
155                 break;
156             }
157             case R.id.actionToggleHole: {
158                 if (mChart.isDrawHoleEnabled())
159                     mChart.setDrawHoleEnabled(false);
160                 else
161                     mChart.setDrawHoleEnabled(true);
162                 mChart.invalidate();
163                 break;
164             }
165             case R.id.actionDrawCenter: {
166                 if (mChart.isDrawCenterTextEnabled())
167                     mChart.setDrawCenterText(false);
168                 else
169                     mChart.setDrawCenterText(true);
170                 mChart.invalidate();
171                 break;
172             }
173             case R.id.actionToggleXVals: {
174
175                 mChart.setDrawEntryLabels(!mChart.isDrawEntryLabelsEnabled());
176                 mChart.invalidate();
177                 break;
178             }
179             case R.id.actionSave: {
180                 // mChart.saveToGallery("title"+System.currentTimeMillis());
181                 mChart.saveToPath("title" + System.currentTimeMillis(), "");
182                 break;
183             }
184             case R.id.actionTogglePercent:
185                 mChart.setUsePercentValues(!mChart.isUsePercentValuesEnabled());
186                 mChart.invalidate();
187                 break;
188             case R.id.animateX: {
189                 mChart.animateX(1400);
190                 break;
191             }
192             case R.id.animateY: {
193                 mChart.animateY(1400);
194                 break;
195             }
196             case R.id.animateXY: {
197                 mChart.animateXY(1400, 1400);
198                 break;
199             }
200             case R.id.actionToggleSpin: {
201                 mChart.spin(1000, mChart.getRotationAngle(), mChart.getRotationAngle() + 360, Easing.EasingOption
202                         .EaseInCubic);
203                 break;
204             }
205         }
206         return true;
207     }
208
209
210
211     @Override
212     public void onValueSelected(Entry e, Highlight h) {
213         // TODO Auto-generated method stub
214          if (e == null)
215                 return;
216             Log.i("VAL SELECTED",
217                     "Value: " + e.getY() + ", index: " + h.getX()
218                             + ", DataSet index: " + h.getDataSetIndex());
219
220     }
221
222
223     @Override
224     public void onNothingSelected() {
225         // TODO Auto-generated method stub
226         Log.i("PieChart", "nothing selected");
227     }
228
229 }
你得有足够的实力,你的原则和底线才会被人尊重。

 浙公网安备 33010602011771号