CentOS8.2安装配置Prometheus和node_exporter详解
Prometheus是一个开源的监视,查询和警报工具。该功能丰富的工具最初由Soundcloud于2012年构建,已被多家公司采用,以监控其IT基础架构并确保所有系统运行顺畅。Prometheus允许您查询和提取时间序列指标,例如通过HTTP协议的CPU和内存利用率,并在实时图形上将其可视化。您还可以将Prometheus配置为在节点或服务停机时发出警报,并将其与其他第三方监视工具(例如Grafana)集成以增强数据可视化。在本指南中,我们将介绍在CentOS 8 / RHEL 8系统上Prometheus的安装。
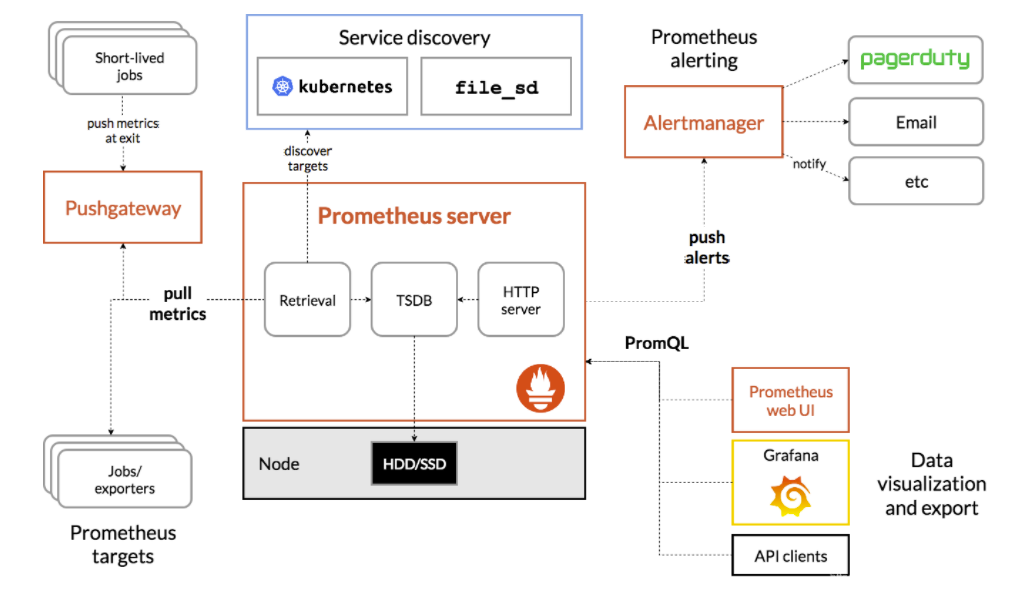
Prometheus架构
测试环境
| prometheus主机 | prometheus 客户端 | |
|---|---|---|
| 主机名 | prometheusserver | prometheusclient |
| IP信息 | 192.168.6.140 | 192.168.6.160 |
步骤1:创建一个Prometheus用户和组
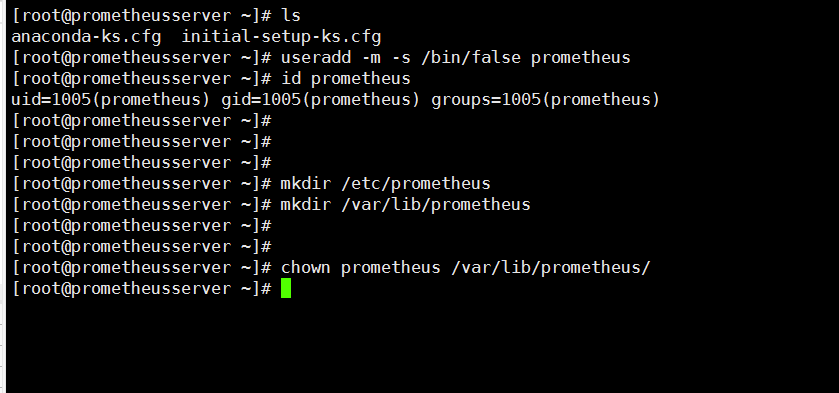
首先,我们将为Prometheus创建一个系统用户。执行以下命令以实现此目的。
[root@prometheusserver ~]# useradd -m -s /bin/false prometheus
[root@prometheusserver ~]# id prometheus
uid=1005(prometheus) gid=1005(prometheus) groups=1005(prometheus)
[root@prometheusserver ~]#
您可能已经注意到,系统用户没有/ bin / false选项中指定的登录权限。
步骤2:Prometheus创建配置目录
创建Prometheus用户之后,我们将在/ etc和/ var目录中创建配置目录,这些目录将存储Prometheus配置文件和数据。因此,运行以下命令:
[root@prometheusserver ~]# mkdir /etc/prometheus
[root@prometheusserver ~]# mkdir /var/lib/prometheus
在/ var / lib / prometheus上设置所有权
[root@prometheusserver ~]# chown prometheus /var/lib/prometheus/
步骤3:下载Prometheus tar文件
有了目录后,我们现在可以下载Prometheus。要获取最新版本,请转到“下载”页面以获取适用于您的环境的最新版本。在撰写本文时,最新版本为v 2.23.0。或者,只需运行以下命令
[root@prometheusserver ~]# dnf install wget -y
[root@prometheusserver ~]# wget https://github.com/prometheus/prometheus/releases/download/v2.23.0/prometheus-2.23.0.linux-amd64.tar.gz
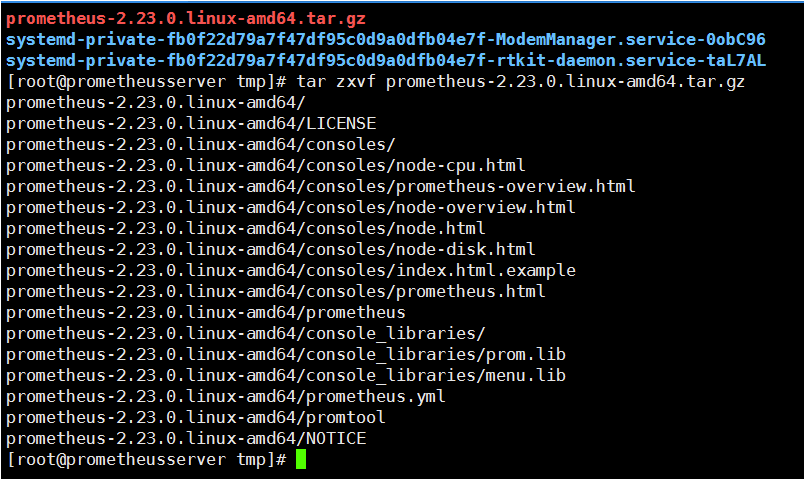
下载完成后,解压缩tarball文件,如下所示
[root@prometheusserver tmp]# tar zxvf prometheus-2.23.0.linux-amd64.tar.gz
这将为您提供一个名为prometheus-2.14.0.linux-amd64的目录
使用tree命令查看目录结构,
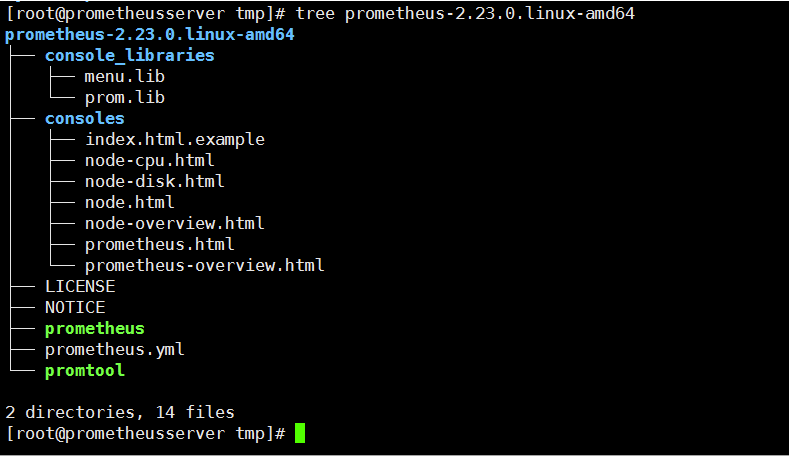
提取的目录包含2个二进制文件prometheus和promtool,我们需要将其复制到/usr/local/bin路径。
因此,导航到提取的目录并使用以下命令将其复制:
[root@prometheusserver tmp]# cd  prometheus-2.23.0.linux-amd64
[root@prometheusserver prometheus-2.23.0.linux-amd64]# cp prometheus  /usr/local/bin
对其他二进制文件也一样
[root@prometheusserver prometheus-2.23.0.linux-amd64]# cp promtool /usr/local/bin
步骤4:Prometheus创建配置文件
首先从配置开始,创建文件/etc/prometheus/prometheus.ym l并将配置粘贴到文件中
[root@prometheus ~]# vi /etc/prometheus/prometheus.yml
# Global config
global:
  scrape_interval:15s        #设置间隔为每15秒。默认值为每1分钟。
  Evaluation_interval:15s    #每15秒评估一次规则。默认值为每1分钟。
  scrape_timeout:15s         #scrape_timeout设置为全局默认值(10s)。
#包含仅一个要刮擦的端点的刮擦配置: #这里是Prometheus本身。
scrape_configs:
#作业名称作为标签“ job = <job_name>”添加到从此配置中刮取的任何时间序列。
  - job_name: 'prometheus'
    # metrics_path defaults to '/metrics'
    # scheme defaults to 'http'.
    static_configs:
    - targets: ['localhost:9090']
这将仅监视您的本地系统(Prometheus Server)。
接下来,如下调整防火墙,以允许通过端口9090到服务器的外部连接
[root@prometheusserver /]# firewall-cmd --add-port=9090/tcp --permanent
success
[root@prometheusserver /]#firewall-cmd --reload
success
步骤5:Prometheus Server创建Systemd服务文件
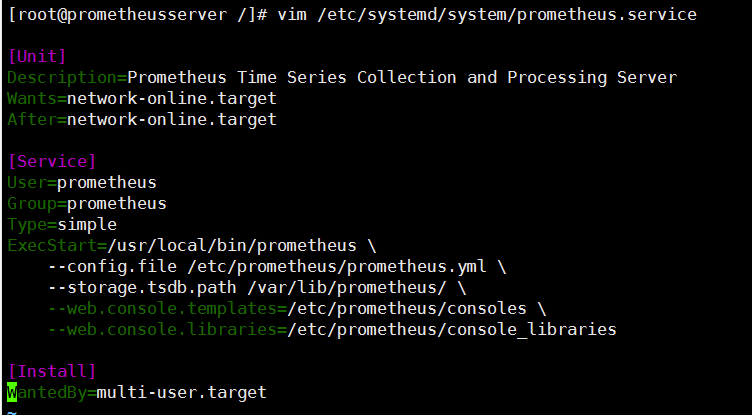
为了使我们能够使用systemd将Prometheus作为服务进行管理,我们需要为其创建系统文件。因此,如图所示创建文件并粘贴内容,
[root@prometheusserver /]# vi /etc/systemd/system/prometheus.service
[Unit]
Description=Prometheus Time Series Collection and Processing Server
Wants=network-online.target
After=network-online.target

[Service]
User=prometheus
Group=prometheus
Type=simple
ExecStart=/usr/local/bin/prometheus \
    --config.file /etc/prometheus/prometheus.yml \
    --storage.tsdb.path /var/lib/prometheus/ \
    --web.console.templates=/etc/prometheus/consoles \
    --web.console.libraries=/etc/prometheus/console_libraries

[Install]
WantedBy=multi-user.target
为了使更改生效,请重新加载systemctl,
[root@prometheusserver /]# systemctl daemon-reload
现在启动并启用Prometheus在启动时运行
[root@prometheusserver /]# systemctl start prometheus
[root@prometheusserver /]# systemctl enable prometheus
为了确定Prometheus正在运行,请运行以下命令:
[root@prometheusserver /]# systemctl status prometheus
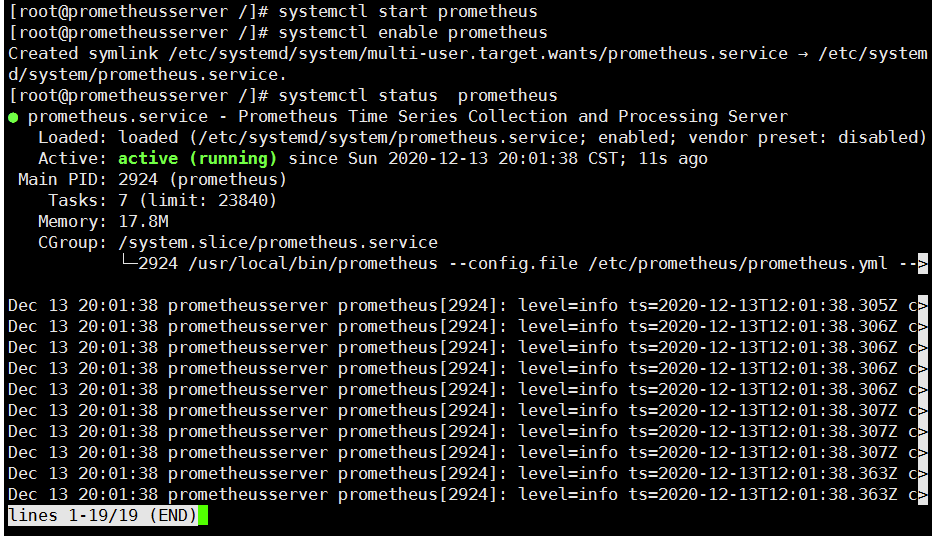
从显示的输出中,我们可以清楚地看到Prometheus正常运行,没有错误。另外,您可以使用netstat实用工具检查服务是否正在侦听端口9090。
[root@prometheusserver /]# netstat -tunlp
或者
[root@prometheusserver /]# ss -antpl
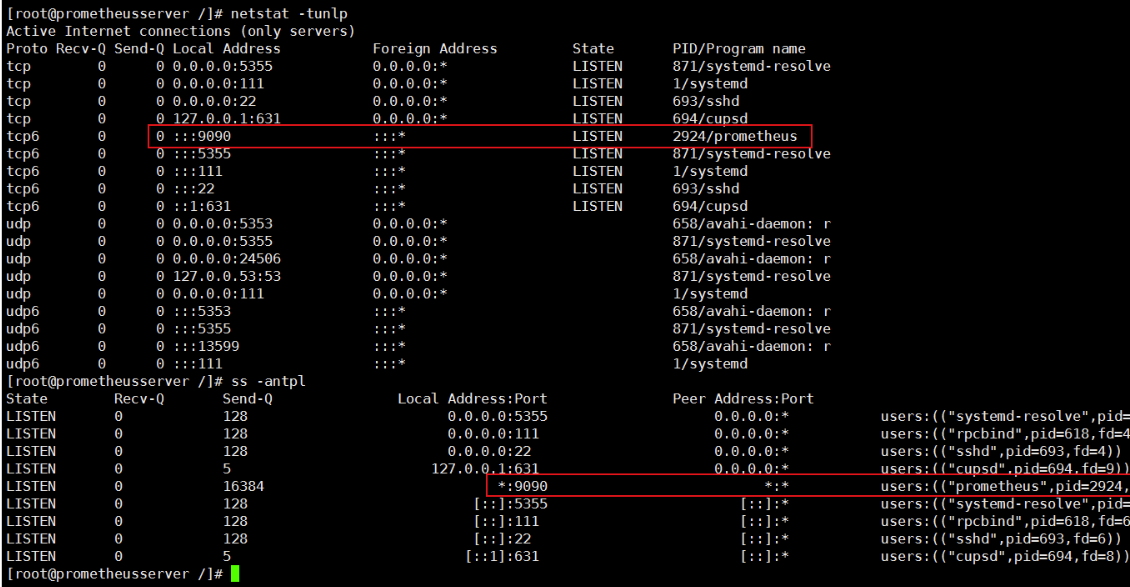
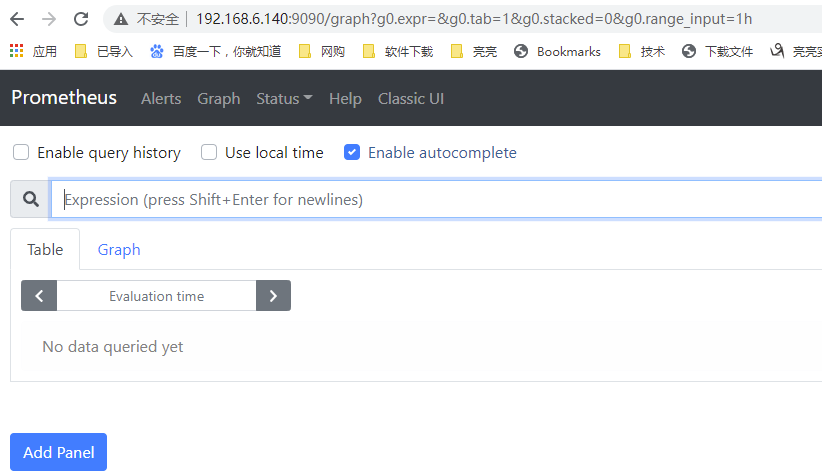
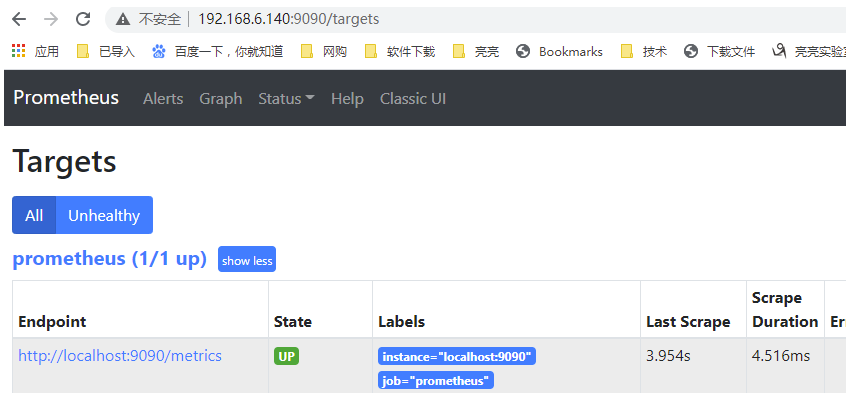
Prometheus按预期在端口9090上运行。现在转到浏览器,浏览服务器的IP,如下所示
http://服务器-ip:9090
点击“状态”标签,然后点击“目标”
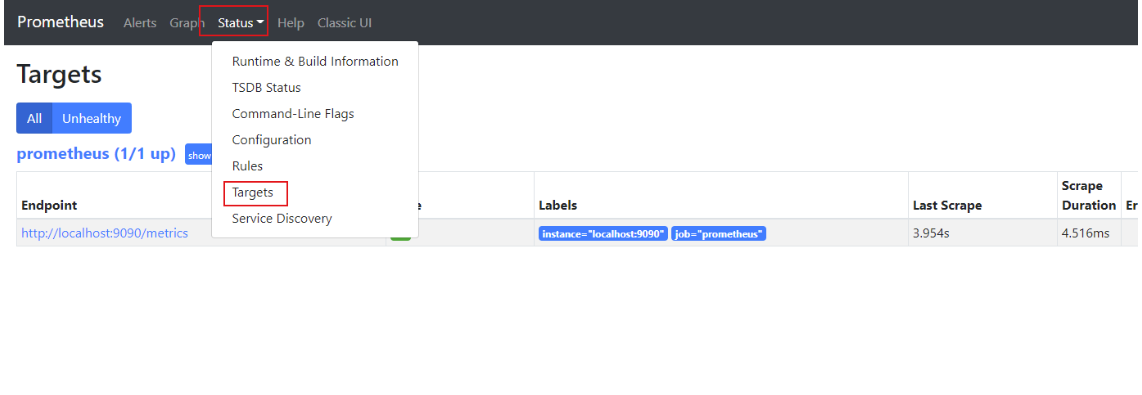
您的系统将显示如下
步骤6:安装并配置node_exporter
node_exporter是一种实用程序,可收集和大量Linux系统指标,例如CPU,内存使用率,文件系统和网络统计信息。在本节中,我们将在Prometheus服务器和远程CentOS 8 Linux主机上安装node_exporter,并监视这两个主机上的系统指标。
【1】在Prometheus节点上,我们将为node_exporter创建一个系统用户。
[root@prometheusserver tmp]# useradd -m -s /bin/false node_exporter
【2】接下来,前往Prometheus的下载页面,然后下载node_exporter tarball或使用下面的wget命令从命令行下载下来,
[root@prometheusserver tmp]# wget https://github.com/prometheus/node_exporter/releases/download/v1.0.1/node_exporter-1.0.1.linux-amd64.tar.gz
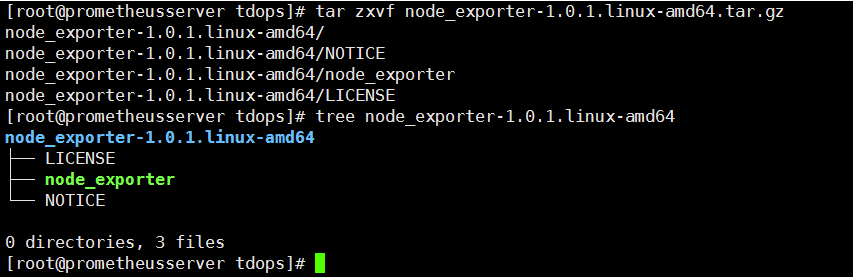
【3】下载node_exporter文件后,继续进行提取,如下所示
[root@prometheusserver tdops]# tar zxvf node_exporter-1.0.1.linux-amd64.tar.gz
【4】可以使用tree命令检查提取的文件夹的内容,如下所示
[root@prometheusserver tdops]# tree node_exporter-1.0.1.linux-amd64
node_exporter-1.0.1.linux-amd64
├── LICENSE
├── node_exporter
└── NOTICE

0 directories, 3 files
【5】将node_exporter的二进制文件复制到 /usr/local/bin路径
[root@prometheusserver tdops]# cp node_exporter-1.0.1.linux-amd64/node_exporter /usr/local/bin
【6】设置已复制的node_exporter文件的文件许可权,如下所示
[root@prometheusserver tmp]# chown node_exporter:node_exporter /usr/local/bin/node_exporter
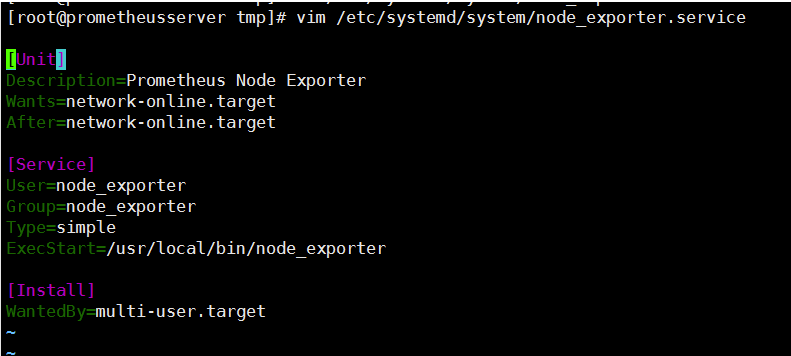
【7】我们需要配置node_exporter以作为服务运行。因此,继续操作并创建一个systemd服务文件,如下所示
[root@prometheusserver tmp]# vi /etc/systemd/system/node_exporter.service
【8】粘贴如下所示的配置并保存文件
[Unit]
Description=Prometheus Node Exporter
Wants=network-online.target
After=network-online.target

[Service]
User=node_exporter
Group=node_exporter
Type=simple
ExecStart=/usr/local/bin/node_exporter

[Install]
WantedBy=multi-user.target
【9】为了使更改生效,请使用以下命令重新加载systemd Manager:
[root@prometheusserver tmp]# systemctl daemon-reload
【10】启动并启用node_exporter服务
[root@prometheusserver tdops]# systemctl start node_exporter
[root@prometheusserver tdops]# systemctl enable node_exporter
或者
# 启动并使节点导出器在系统引导时运行。
[root@prometheusserver tdops]# systemctl enable --now node_exporter.service
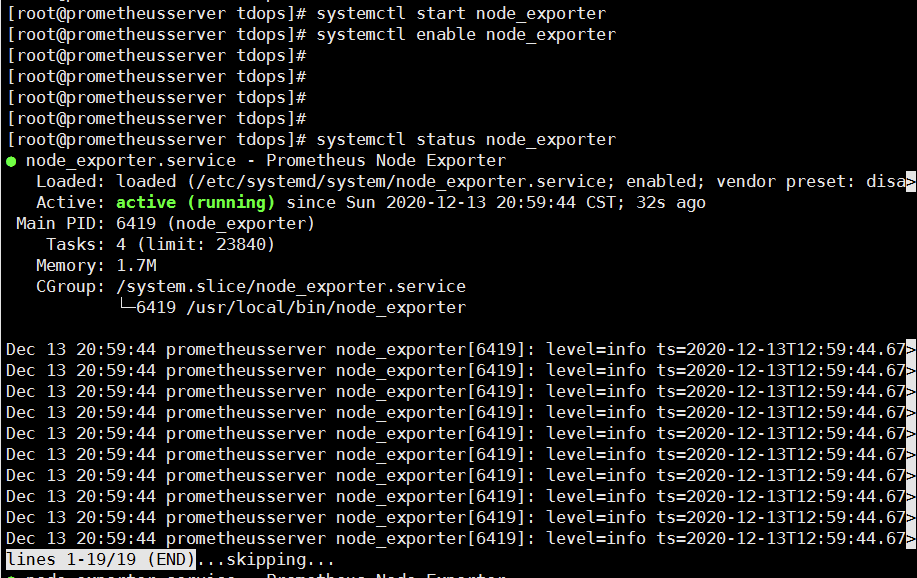
【11】为了确保该服务正在运行,请执行:
[root@prometheusserver tdops]# systemctl status node_exporter
● node_exporter.service - Prometheus Node Exporter
   Loaded: loaded (/etc/systemd/system/node_exporter.service; enabled; vendor preset: disa>
   Active: active (running) since Sun 2020-12-13 20:59:44 CST; 32s ago
 Main PID: 6419 (node_exporter)
    Tasks: 4 (limit: 23840)
   Memory: 1.7M
   CGroup: /system.slice/node_exporter.service
           └─6419 /usr/local/bin/node_exporter
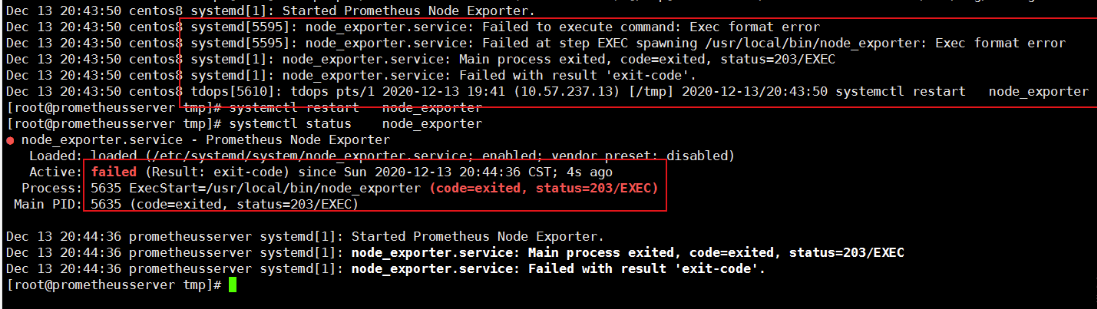
【12】遇到一个小插曲,启动时遇到错误
Dec 13 20:43:50 centos8 systemd[1]: Started Prometheus Node Exporter.
Dec 13 20:43:50 centos8 systemd[5595]: node_exporter.service: Failed to execute command: Exec format error
Dec 13 20:43:50 centos8 systemd[5595]: node_exporter.service: Failed at step EXEC spawning /usr/local/bin/node_exporter: Exec format error
Dec 13 20:43:50 centos8 systemd[1]: node_exporter.service: Main process exited, code=exited, status=203/EXEC
Dec 13 20:43:50 centos8 systemd[1]: node_exporter.service: Failed with result 'exit-code'.
Dec 13 20:43:50 centos8 tdops[5610]: tdops pts/1 2020-12-13 19:41 (10.57.237.13) [/tmp] 2020-12-13/20:43:50 systemctl restart   node_exporter

[root@prometheusserver tmp]# systemctl status    node_exporter
● node_exporter.service - Prometheus Node Exporter
   Loaded: loaded (/etc/systemd/system/node_exporter.service; enabled; vendor preset: disabled)
   Active: failed (Result: exit-code) since Sun 2020-12-13 20:44:36 CST; 4s ago
  Process: 5635 ExecStart=/usr/local/bin/node_exporter (code=exited, status=203/EXEC)
 Main PID: 5635 (code=exited, status=203/EXEC)

Dec 13 20:44:36 prometheusserver systemd[1]: Started Prometheus Node Exporter.
Dec 13 20:44:36 prometheusserver systemd[1]: node_exporter.service: Main process exited, code=exited, status=203/EXEC
Dec 13 20:44:36 prometheusserver systemd[1]: node_exporter.service: Failed with result 'exit-code'.
[root@prometheusserver tmp]#
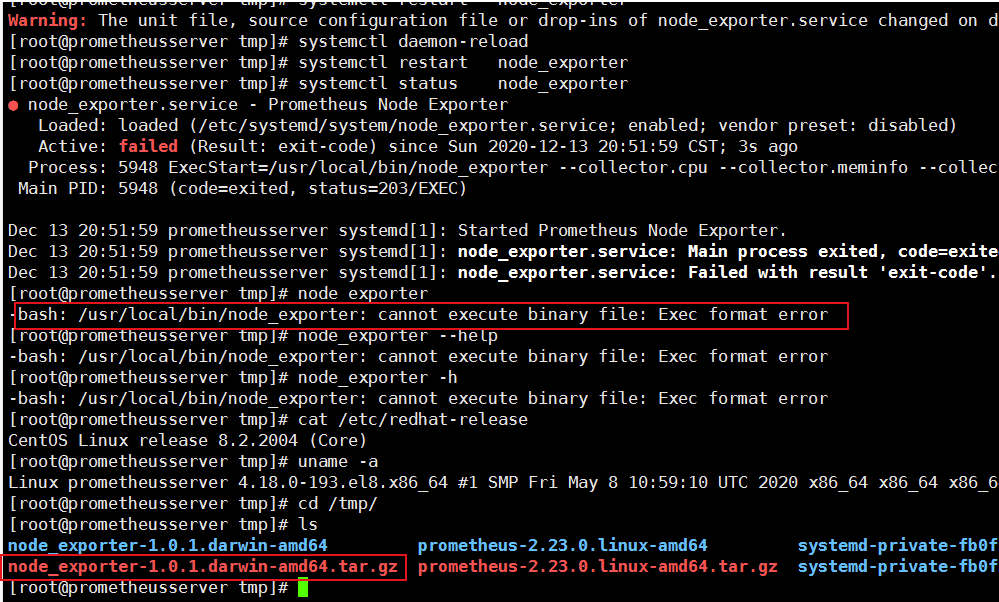
【13】排查了一下发现,下载的软件包与系统不匹配,node_exporter-1.0.1.darwin-amd64.tar.gz 更换为node_exporter-1.0.1.linux-amd64.tar.gz
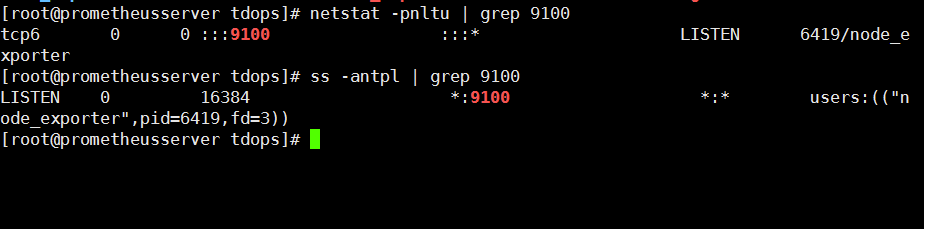
【14】确保该服务正在运行,请使用netstat实用程序检查它是否正在按默认预期在端口9100上侦听。
[root@prometheusserver tdops]# netstat -pnltu | grep 9100
tcp6       0      0 :::9100                 :::*                    LISTEN      6419/node_exporter
[root@prometheusserver tdops]# ss -antpl | grep 9100
LISTEN    0         16384                    *:9100
Node_exporter服务正在按预期运行。
【15】如图所示在防火墙中打开端口9100
[root@prometheusserver tdops]# firewall-cmd --add-port=9100/tcp  --permanent
success

[root@prometheusserver tdops]# firewall-cmd --reload
success
同样,对远程CentOS 8 Linux系统也重复上述步骤。
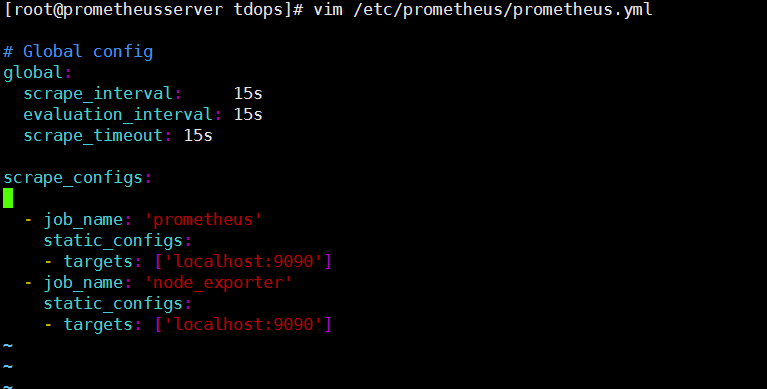
【16】您需要将node_exporter目标添加到prometheus.yml文件。附加以下几行以为Prometheus服务器定义node_exporter
[root@prometheusserver tdops]# cat /etc/prometheus/prometheus.yml
# Global config
global:
  scrape_interval:     15s
  evaluation_interval: 15s
  scrape_timeout: 15s

scrape_configs:

  - job_name: 'prometheus'
    static_configs:
    - targets: ['localhost:9090']
  - job_name: 'node_exporter'
    static_configs:
    - targets: ['localhost:9090']
【17】重新启动Prometheus服务
[root@prometheusserver tdops]# systemctl restart prometheus
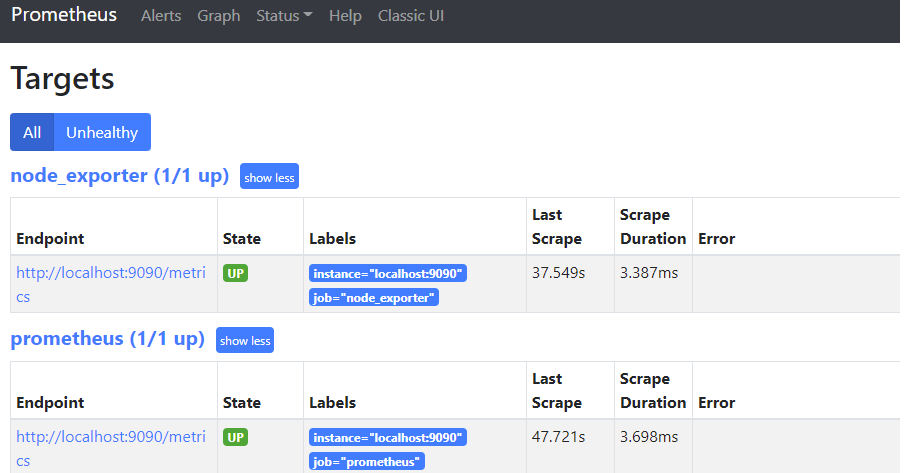
【18】再次转到浏览器,单击“状态”标签,然后单击“目标”
确保 在Prometheus服务器的浏览器上观察到名为node_exporter的新端点
步骤7:远程主机上安装node_exporter
【1】创建node_exporter 用户
[root@prometheusclient tmp]# useradd -m -s /bin/false node_exporter
【2】Prometheus的下载页面,然后下载node_exporter 或使用下面的wget命令从命令行下载下来,
[root@prometheusclient tmp]# wget https://github.com/prometheus/node_exporter/releases/download/v1.0.1/node_exporter-1.0.1.linux-amd64.tar.gz
【3】下载node_exporter文件后,继续进行提取.
[root@prometheusclient tmp]# tar zxvf node_exporter-1.0.1.linux-amd64.tar.gz
【4】您可以使用tree命令检查提取的文件夹的内容,如下所示
[root@prometheusclient tmp]# tree node_exporter-1.0.1.linux-amd64
node_exporter-1.0.1.linux-amd64
├── LICENSE
├── node_exporter
└── NOTICE

0 directories, 3 files
[root@prometheusclient tmp]#

【5】将node_exporter的二进制文件复制到 /usr/local/bin路径
[root@prometheusclient tmp]# cp node_exporter-1.0.1.linux-amd64/node_exporter /usr/local/bin
【6】设置已复制的node_exporter文件的文件许可权,如下所示
[root@prometheusclient tmp]# chown node_exporter:node_exporter /usr/local/bin/node_exporter
【7】需要配置node_exporter以作为服务运行。因此,继续操作并创建一个systemd服务文件,如下所示
[root@prometheusserver tmp]# vi /etc/systemd/system/node_exporter.service
然后粘贴如下所示的配置并保存文件
[Unit]
Description=Prometheus Node Exporter
Wants=network-online.target
After=network-online.target

[Service]
User=node_exporter
Group=node_exporter
Type=simple
ExecStart=/usr/local/bin/node_exporter

[Install]
WantedBy=multi-user.target
【8】为了使更改生效,请使用以下命令重新加载systemd Manager:
[root@prometheusclient tmp]# systemctl daemon-reload
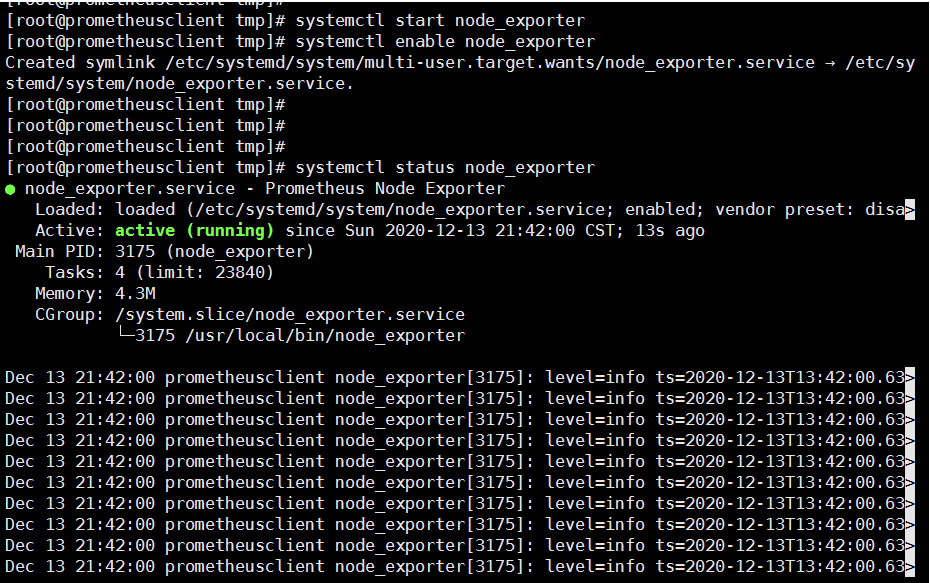
【9】启动并启用node_exporter服务
[root@prometheusserver tdops]# systemctl start node_exporter
[root@prometheusserver tdops]# systemctl enable node_exporter
或者
# 启动并使节点导出器在系统引导时运行。
[root@prometheusserver tdops]# systemctl enable --now node_exporter.service
【10】确保该服务正在运行,查看服务状态信息:
[root@prometheusserver tdops]# systemctl status node_exporter
● node_exporter.service - Prometheus Node Exporter
   Loaded: loaded (/etc/systemd/system/node_exporter.service; enabled; vendor preset: disa>
   Active: active (running) since Sun 2020-12-13 20:59:44 CST; 32s ago
 Main PID: 6419 (node_exporter)
    Tasks: 4 (limit: 23840)
   Memory: 1.7M
   CGroup: /system.slice/node_exporter.service
           └─6419 /usr/local/bin/node_exporter
步骤8: Prometheus服务器端添加配置
【1】远程Linux系统 prometheusclient添加端点,请回到prometheus.yml文件并在下面添加以下行
–目标:['192.168.6.160:9100']
现在,node_exporter部分应如下所示
  - job_name: 'node_exporter'
    static_configs:
    - targets: ['localhost:9090']
    - targets: ['192.168.6.160:9100']
【2】保存更改并重新启动Prometheus服务
[root@prometheusserver tdops]# systemctl restart prometheus
【3】刷新浏览器并注意为远程CentOS Linux系统添加的第二个端点

【4】显示Prometheus服务器的度量,请运行:
[root@prometheusclient tmp]# curl http://localhost:9100/metrics
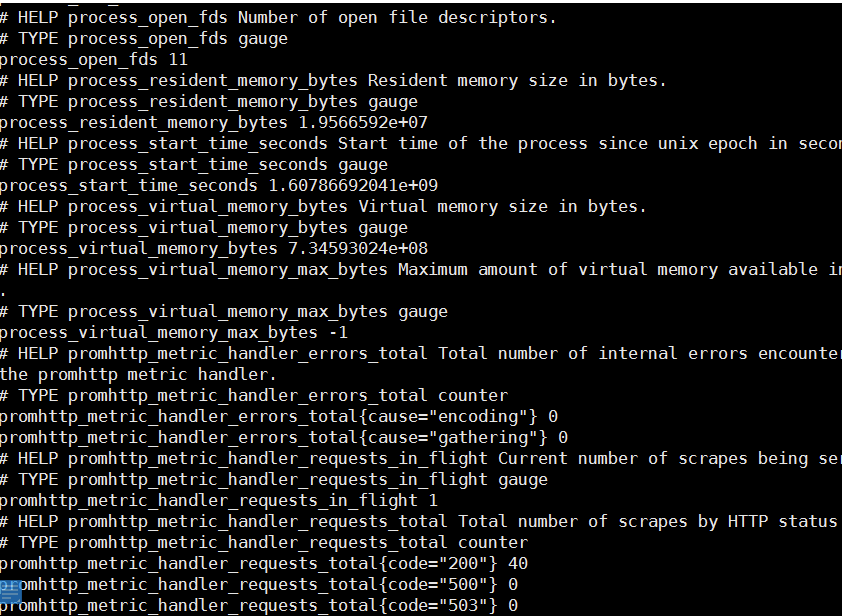
【5】远程CentOS 8主机,我执行了以下命令:
curl http://192.168.6.160:9100/metrics
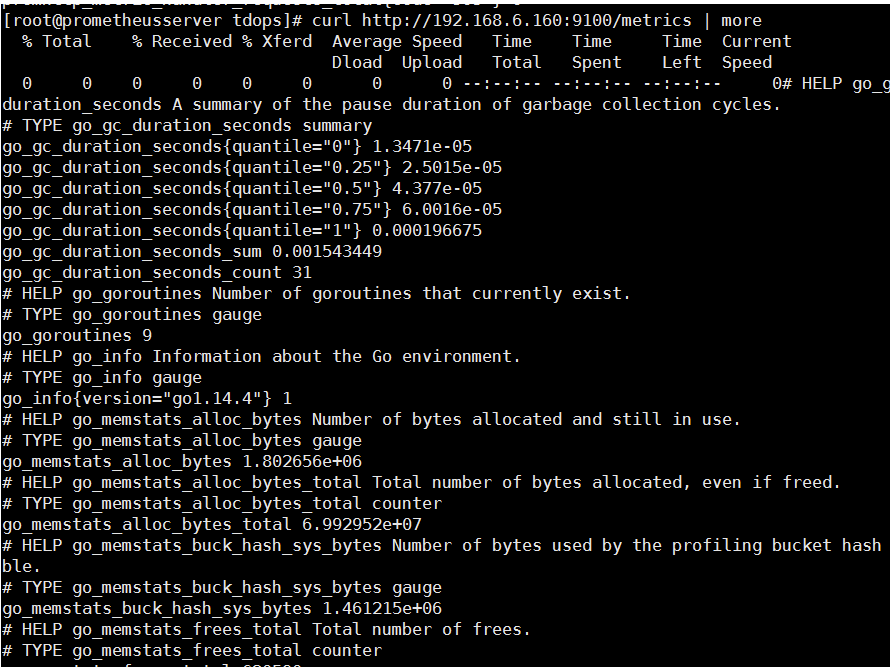
【6】也可以通过打开浏览器并浏览URL来实现
http://192.168.10.90:9100/metrics

【7】选择要绘制图形的指标

【8】单击“执行”按钮,然后单击下面的“图形”选项卡以显示图形
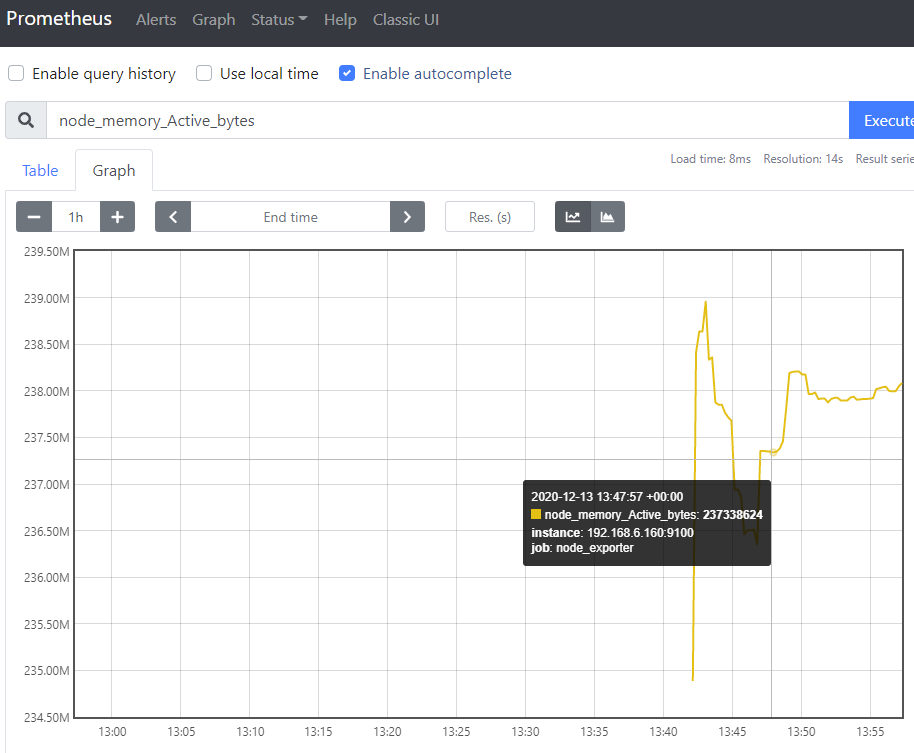
这是我们本文章的结尾。您已成功安装并配置了Prometheus,以监视服务器和远程主机上的系统指标。
广告时间:
- 关于我 :全国7*24高效代维服务
- 微信:lianglab
- QQ:867266199
- 淘宝店:全国7*24高效代维服务
- 全国高效代维:为中小型企业,提供云计算咨询代维、架构设计、降低成本。
在下一个指南中,我们将Prometheus与Grafana集成在一起,以更好地可视化和分析指标,随时与我们分享您的反馈,并与朋友分享文章。

 浙公网安备 33010602011771号