
Matlab矢量图图例函数quiverkey
Matlab自带函数中不包含构造 quiver 函数注释过程,本文参照 matplotlib 中 quiverkey 函数,构造类似函数为 Matlab 中 quiver 矢量场进行标注。
quiverkey函数
首先看 matplotlib 中 quiverkey 如何定义的
quiverkey(*args, **kw)
Add a key to a quiver plot.
Call signature::
quiverkey(Q, X, Y, U, label, **kw)
Arguments:
Q:
The Quiver instance returned by a call to quiver.
X, Y:
The location of the key; additional explanation follows.
U:
The length of the key
label:
A string with the length and units of the key
Keyword arguments:
coordinates = [ 'axes' | 'figure' | 'data' | 'inches' ]
Coordinate system and units for X, Y: 'axes' and 'figure' are
normalized coordinate systems with 0,0 in the lower left and 1,1
in the upper right; 'data' are the axes data coordinates (used for
the locations of the vectors in the quiver plot itself); 'inches'
is position in the figure in inches, with 0,0 at the lower left
corner.
color:
overrides face and edge colors from Q.
labelpos = [ 'N' | 'S' | 'E' | 'W' ]
Position the label above, below, to the right, to the left of the
arrow, respectively.
labelsep:
Distance in inches between the arrow and the label. Default is
0.1
labelcolor:
defaults to default :class:~matplotlib.text.Text color.
fontproperties:
A dictionary with keyword arguments accepted by the
:class:~matplotlib.font_manager.FontProperties initializer:
family, style, variant, size, weight
Any additional keyword arguments are used to override vector
properties taken from Q.
The positioning of the key depends on X, Y, coordinates, and
labelpos. If labelpos is 'N' or 'S', X, Y give the position
of the middle of the key arrow. If labelpos is 'E', X, Y
positions the head, and if labelpos is 'W', X, Y positions the
tail; in either of these two cases, X, Y is somewhere in the
middle of the arrow+label key object.
Additional kwargs: hold = [True|False] overrides default hold state
可以看到主要参数有这么些个
- quiver绘图指针
- 图例位置
X, Y - 标注大小
U - 标注单位字符
- 其他参数
1). 输入坐标X, Y单位
2). (文字)标注在图例哪个位置
3). 标注与图例相对距离
4). 标注字体颜色
使用方法:
对应Matlab函数也应该使用这么个流程
- 使用quiver绘图
- 将quiver返回指针与图例位置坐标和大小等作为参数传入
示例
[x,y] = meshgrid(0:0.2:2,0:0.2:2);
u = cos(x).*y;
v = sin(x).*y;

figure;
Qh = quiver(x,y,u,v);

quiverkey(Qh, 0.5, 2.5, 1, 'm/s', 'Color', 'r', 'Coordinates', 'data')
最终效果图
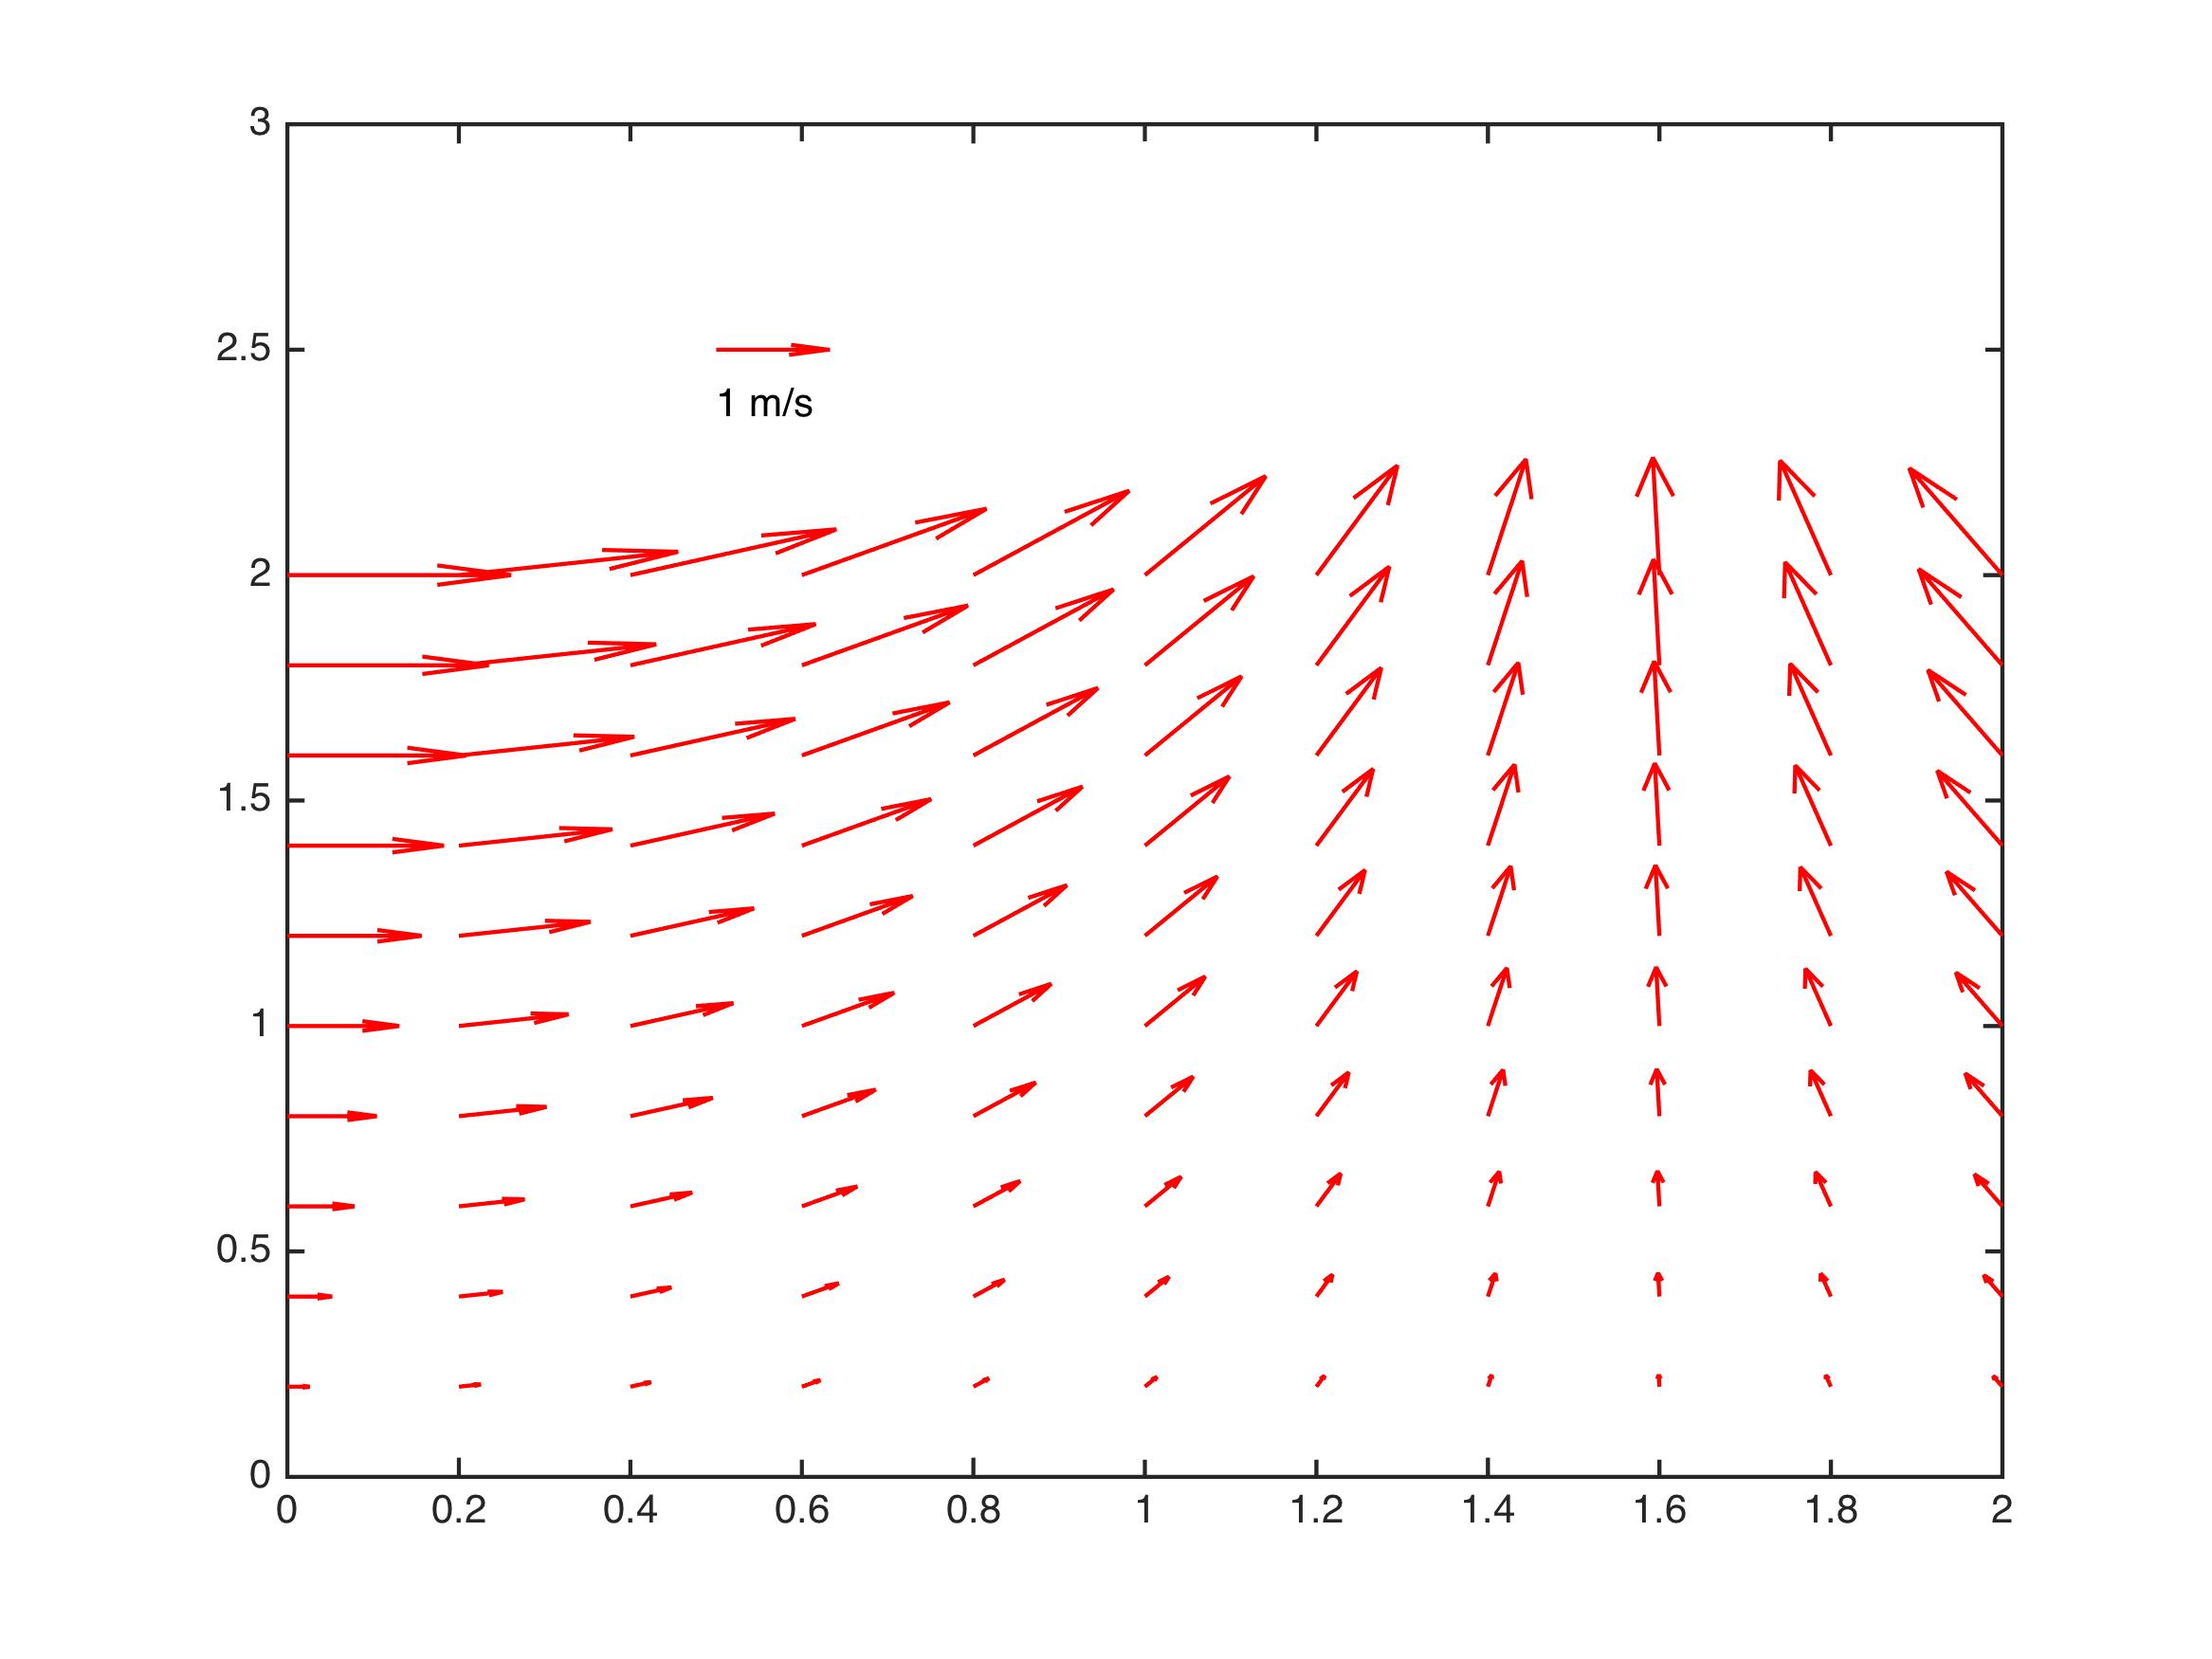
代码
function Q = quiverkey(Q, X, Y, U, label, varargin)
%QUIVERKEY legend for quiver
%
%   QUIVERKEY(Q, X, Y, U, label)
%
%   Arguments:
%       Q :      The quiver handle returned by a call to quiver
%       X,Y :    The location of the legend
%       U :      The unit length. If U<0, the arrow will be reversed
%       label :  The string with the length and units of the key
%
%   Addition arguments:
%       Coordinates = [ 'axes' | 'data'(default) ]
%
%           'axes' & 'figure' : 'axes' and 'figure' are normalized
%                       coordinate systems with 0,0 in the lower left
%                       and 1,1 in the upper right;
%           'data' :    use the axes data coordinates
%
%       LabelDistance : Distance in 'coordinates' between the arrow and the
%                   label. Deauft is 0.1 (units 'axes').
%
%       Color : overrides face and edge colors from Q.
%
%       LabelPosition = [ 'N' | 'S'(default) | 'E' | 'W' ]
%
%               Position the label above, below, to the right,
%               to the left of the arrow, respectively.
%
%       LabelColor : defaults to black
%
%   Examples:
%
%   [x,y] = meshgrid(0:0.2:2,0:0.2:2);
%   u = cos(x).*y;
%   v = sin(x).*y;
%   figure; Qh = quiver(x,y,u,v);
%   quiverkey(Qh, 0.5, 2.5, 1, 'm/s', 'Color', 'r', 'Coordinates', 'data')
%
% Author:
%   li12242 - Department of Civil Engineering in Tianjin University
% Email:
%   li12242@tju.edu.cn
%

%% get input argument
if nargin < 5
    error('Input arguments" Number incorrect!')
end

if isempty(varargin) && mod(length(varargin), 2) ~= 0
    error('Input arguments donot pairs!')
else
    [CoorUnit, LabelDist, Color, LabelPosition, LabelColor] = getInput(varargin);
end


%% add legend arrow

% get original data
xData = get(Q, 'XData'); yData = get(Q, 'YData');
uData = get(Q, 'UData'); vData = get(Q, 'VData');

% get axes properties
haxes = get(Q, 'Parent');
xLim = get(haxes, 'XLim'); yLim = get(haxes, 'YLim');
NextPlot = get(haxes, 'NextPlot');

% set axes properties
set(haxes, 'NextPlot', 'add')

if strcmp(CoorUnit, 'axes')
    % position of legend arrow
    xa = xLim(1) + X*(xLim(2) - xLim(1));
    ya = yLim(1) + Y*(yLim(2) - yLim(1));
else
    xa = X; ya = Y;
end

% add legend arrow into data vector
xData = [xData(:); xa]; yData = [yData(:); ya];
uData = [uData(:); U];  vData = [vData(:); 0];

% reset data
set(Q, 'XData', xData, 'YData', yData, 'UData', uData, 'VData', vData);
set(Q, 'Color', Color)

%% add text
dx = LabelDist*(xLim(2) - xLim(1));
dy = LabelDist*(yLim(2) - yLim(1));

% set position of label
switch LabelPosition
    case 'N'
        xl = xa; yl = ya + dy;
    case 'S'
        xl = xa; yl = ya - dy;
    case 'E'
        xl = xa + dx; yl = ya;
    case 'W'
        xl = xa - dx; yl = ya;
end% switch

th = text(xl, yl, [num2str(U), ' ', label]);
set(th, 'Color', LabelColor);

% turn axes properties to original
set(haxes, 'NextPlot', NextPlot)

end% func

%% sub function

function [CoorUnit, LabelDist, Color, LabelPosition, LabelColor] = getInput(varcell)
% Input:
%   varcell - cell variable
% Output:
%
nargin = numel(varcell);

%% set default arguments

CoorUnit = 'data';
LabelDist = 0.05; % units 'axes'
Color = 'k';
LabelPosition = 'S';
LabelColor = 'k';

%% get input arguments
contour = 1;
while contour < nargin
    switch varcell{contour}
        case 'Coordinates'
            CoorUnit = varcell{contour+ 1};
        case 'LabelDistance'
            LabelDist = varcell{contour+ 1};
        case 'Color'
            Color = varcell{contour+ 1};
        case 'LabelPosition'
            LabelPosition = varcell{contour+ 1};
        case 'LabelColor'
            LabelColor = varcell{contour+ 1};
        otherwise
            error('Unknown input argument.')
    end% switch
    contour = contour + 2;
end% while

end% fun

 浙公网安备 33010602011771号