
test
lend_club 全球最大的P2P平台。
此文章基于R语言做简单分析。
rm(list=ls()) #清除变量gc() #释放内存
- step1
考虑到后续分析
将数据导入sqlserver,用到SSIS
如图
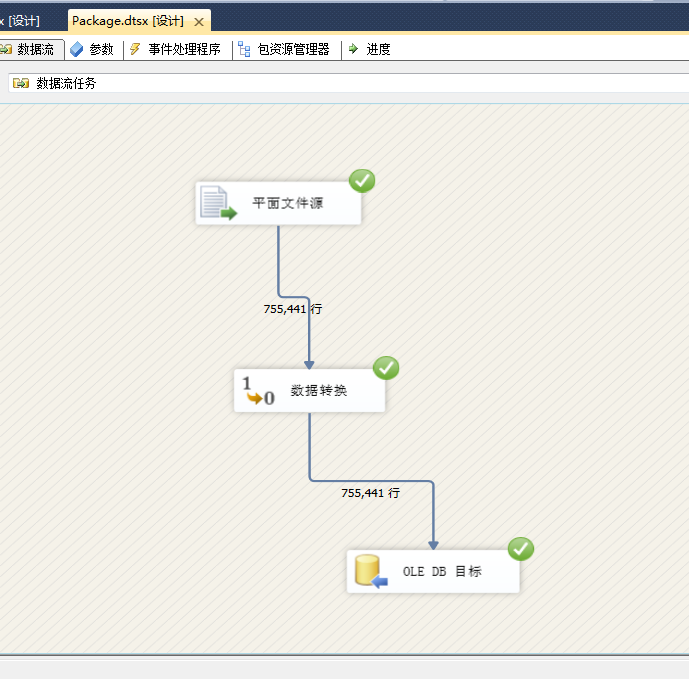
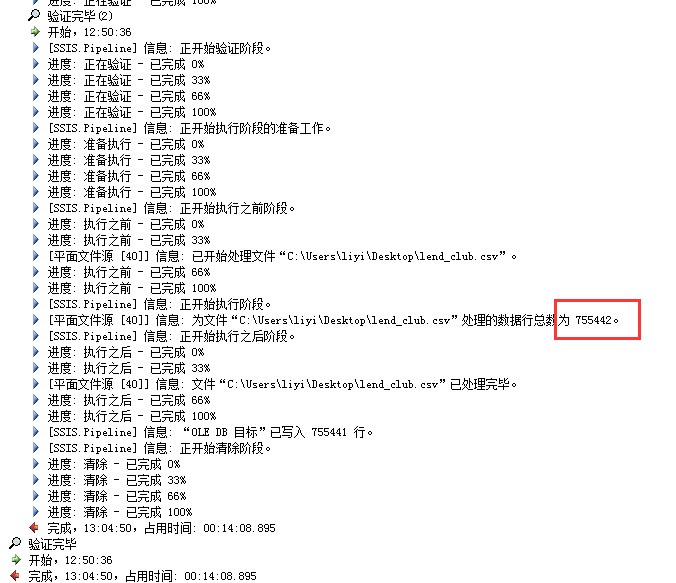 **此处有坑
- step2
连接sqlserver,并将数据读入R。
-
plot
lend_club4<- lend_club3%>%
  group_by(m,y)%>%
  summarise(total_m=sum(sumamount))

lend_club4
head(lend_club4)
Source: local data frame [6 x 3]
Groups: m [2]

      m     y   total_m
  (chr) (chr)     (dbl)
1    01  2008  32256329
2    01  2009  28523635
3    01  2010  63082946
4    01  2011 171186425
5    01  2012 297667575
6    02  2008  20596688
- step3
library(ggplot2)qplot(date_1,sumamount,data=lend_club1,geom="line") # 每天贷款金额的时序图
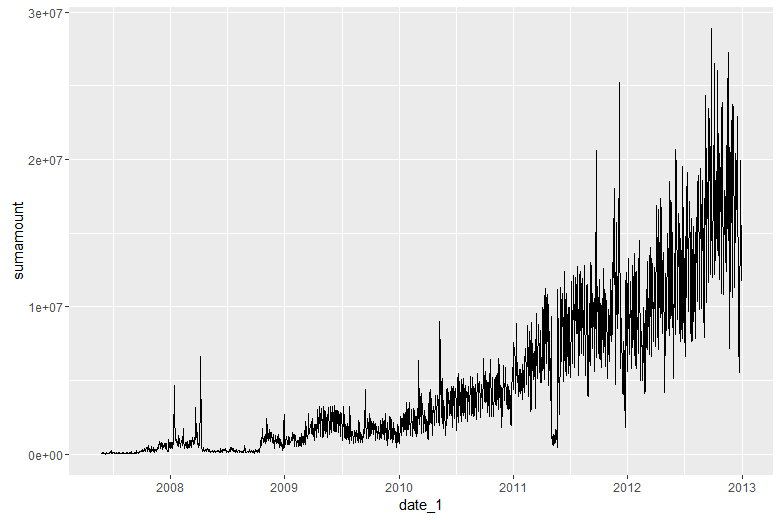
p<-qplot(month_day,sumamount,data=lend_club1)p+facet_wrap(~year) #2007-2012 期间每日的贷款金额
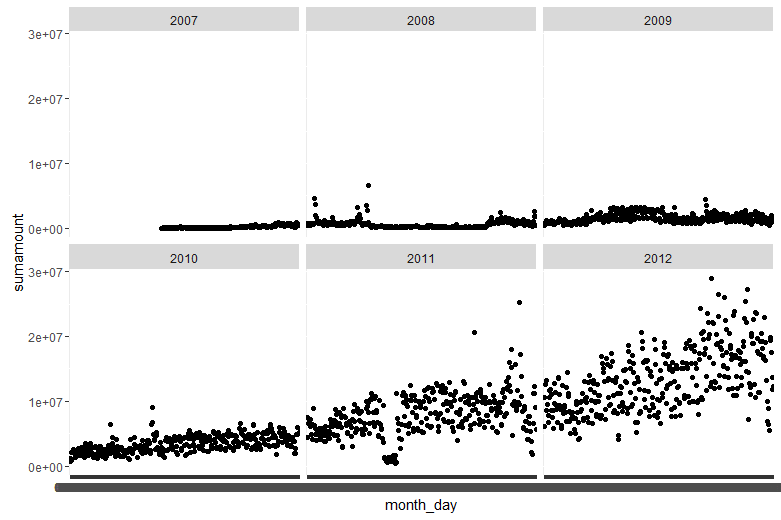
library(tidyr)library(dplyr)lend_club2<-separate(lend_club1,date_1,c("y","m","d"),sep="-")head(lend_club2)sumamount y m d year month_day1 2000 2007 05 26 2007 05/262 47400 2007 05 27 2007 05/273 23900 2007 05 28 2007 05/284 121050 2007 05 29 2007 05/295 87500 2007 05 30 2007 05/306 46500 2007 05 31 2007 05/31
lend_club3<-unite(lend_club2,"y_m",y,m,sep="-",remove = F)head(lend_club3)sumamount y_m y m d year month_day1 2000 2007-05 2007 05 26 2007 05/262 47400 2007-05 2007 05 27 2007 05/273 23900 2007-05 2007 05 28 2007 05/284 121050 2007-05 2007 05 29 2007 05/295 87500 2007-05 2007 05 30 2007 05/306 46500 2007-05 2007 05 31 2007 05/31qplot(m,sumamount,data=lend_club3,geom=c("boxplot")+facet_wrap(~year) #2007~2012年每月贷款金额的箱线图

lend_club4<- lend_club3%>%group_by(m,y)%>%summarise(total_m=sum(sumamount))lend_club4head(lend_club4)Source: local data frame [6 x 3]Groups: m [2]m y total_m(chr) (chr) (dbl)1 01 2008 322563292 01 2009 285236353 01 2010 630829464 01 2011 1711864255 01 2012 2976675756 02 2008 20596688
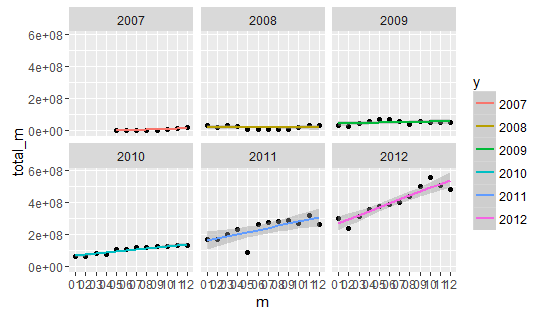
折线图 分面p<-qplot(m,total_m,data=lend_club4)+geom_smooth(aes(group=y,colour=y),method = "lm")
折线图 分面

p<-qplot(m,total_m,data=lend_club4)+geom_smooth(aes(group=y,colour=y))

p+facet_wrap(~y)
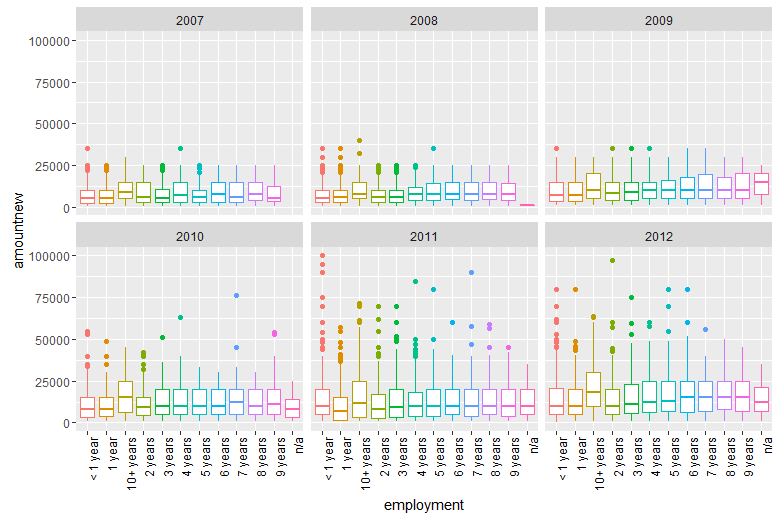
lend<-read.csv("C:\\Users\\liyi\\Desktop\\lend_club.csv")lend1<-read.csv("C:\\Users\\liyi\\Desktop\\lend_club.csv",header = F)lend1<-lend1[-1,]head(lend1)lend1<-lend1[,c(1,3,9)]myvar<-c("amount","year","employment")names(lend1)<-myvarhead(lend1)str(lend1)lend1$amountnew<-as.numeric(as.character(lend1$amount))library(sqldf)lend2<-sqldf('select sum(V1),V3,V9from lend1group by V3,V9')q<-qplot(employment,amountnew,data = lend1,geom=c("boxplot"),colour=lend1$employment)+facet_wrap(~year)q<- q+theme(axis.text.x=element_text(angle=90,hjust=1,colour="black"),legend.position='none')q<- q+scale_y_continuous(limits = c(0, 100000))q
```
专注数据分析
欢迎转载并注明出处
```

 浙公网安备 33010602011771号