Prometheus结合node_exporter实现自定义监控指标
1、创建指标采集脚本,该脚本结合crontab的* * * * *表示每15s运行一次
mkdir /opt/custom_metrics/
vim /opt/custom_metrics/disk_usage_monitor.sh
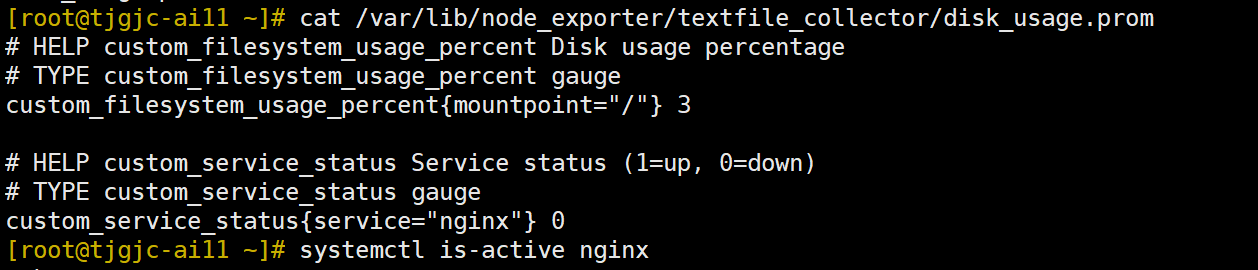
#!/bin/bash
# /opt/custom_metrics/disk_usage_monitor.sh

OUTPUT_FILE="/var/lib/node_exporter/textfile_collector/disk_usage.prom"
for i in {1..4}; do  # 60秒内运行4次(15秒间隔)
    # 获取根分区使用率
    ROOT_USAGE=$(df -h / | awk 'NR==2 {print $5}' | tr -d '%')

    # 写入Prometheus格式指标
    cat > $OUTPUT_FILE <<EOF
# HELP custom_filesystem_usage_percent Disk usage percentage
# TYPE custom_filesystem_usage_percent gauge
custom_filesystem_usage_percent{mountpoint="/"} $ROOT_USAGE

# HELP custom_service_status Service status (1=up, 0=down)
# TYPE custom_service_status gauge
custom_service_status{service="nginx"} $(systemctl is-active nginx &>/dev/null && echo 1 || echo 0)
EOF

    sleep 15
done
2、运行脚本生成 .prom 文件,生成/var/lib/node_exporter/textfile_collector/disk_usage.prom文件
mkdir /var/lib/node_exporter/textfile_collector -p
/opt/custom_metrics/disk_usage_monitor.sh
3、设置定时任务,注意* * * * *表示每分钟运行,1 * * * * 是每小时的第1分钟运行一次
crontab -e
* * * * * /opt/custom_metrics/disk_usage_monitor.sh
4、配置Node Exporter,在启动命令加如下参数
--collector.textfile.directory=/var/lib/node_exporter/textfile_collector
我这里的Node Exporter是systemctl管理的,完整内容如下
vim /usr/lib/systemd/system/node_exporter.service

[Unit]
Description=node_exporter
Documentation=https://prometheus.io/
After=network.target

[Service]
Type=simple
User=root
ExecStart=/usr/local/node_exporter/node_exporter --web.listen-address=:9101 --collector.textfile.directory=/var/lib/node_exporter/textfile_collector
ExecReload=/bin/kill -HUP $MAINPID
KillMode=process
Restart=on-failure

[Install]
WantedBy=multi-user.target
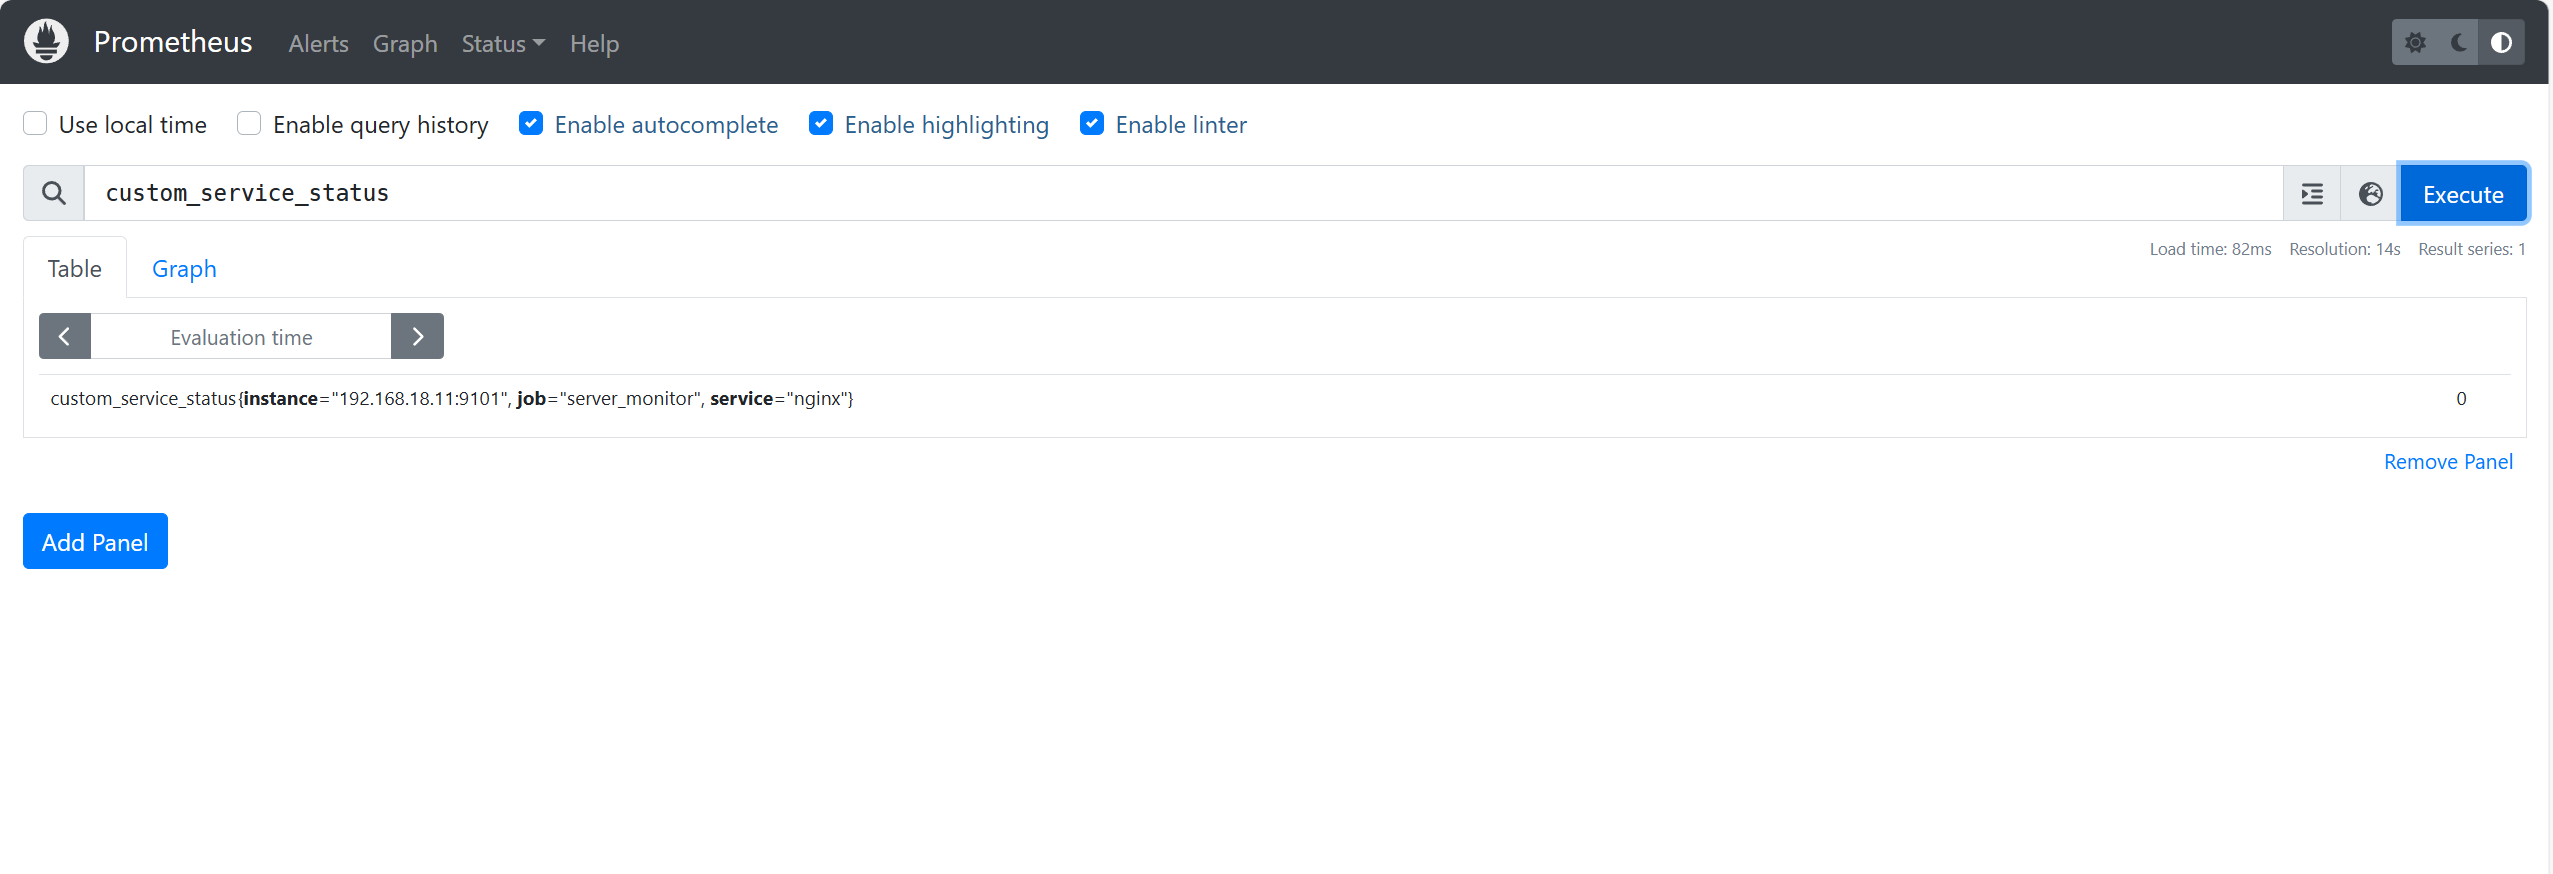
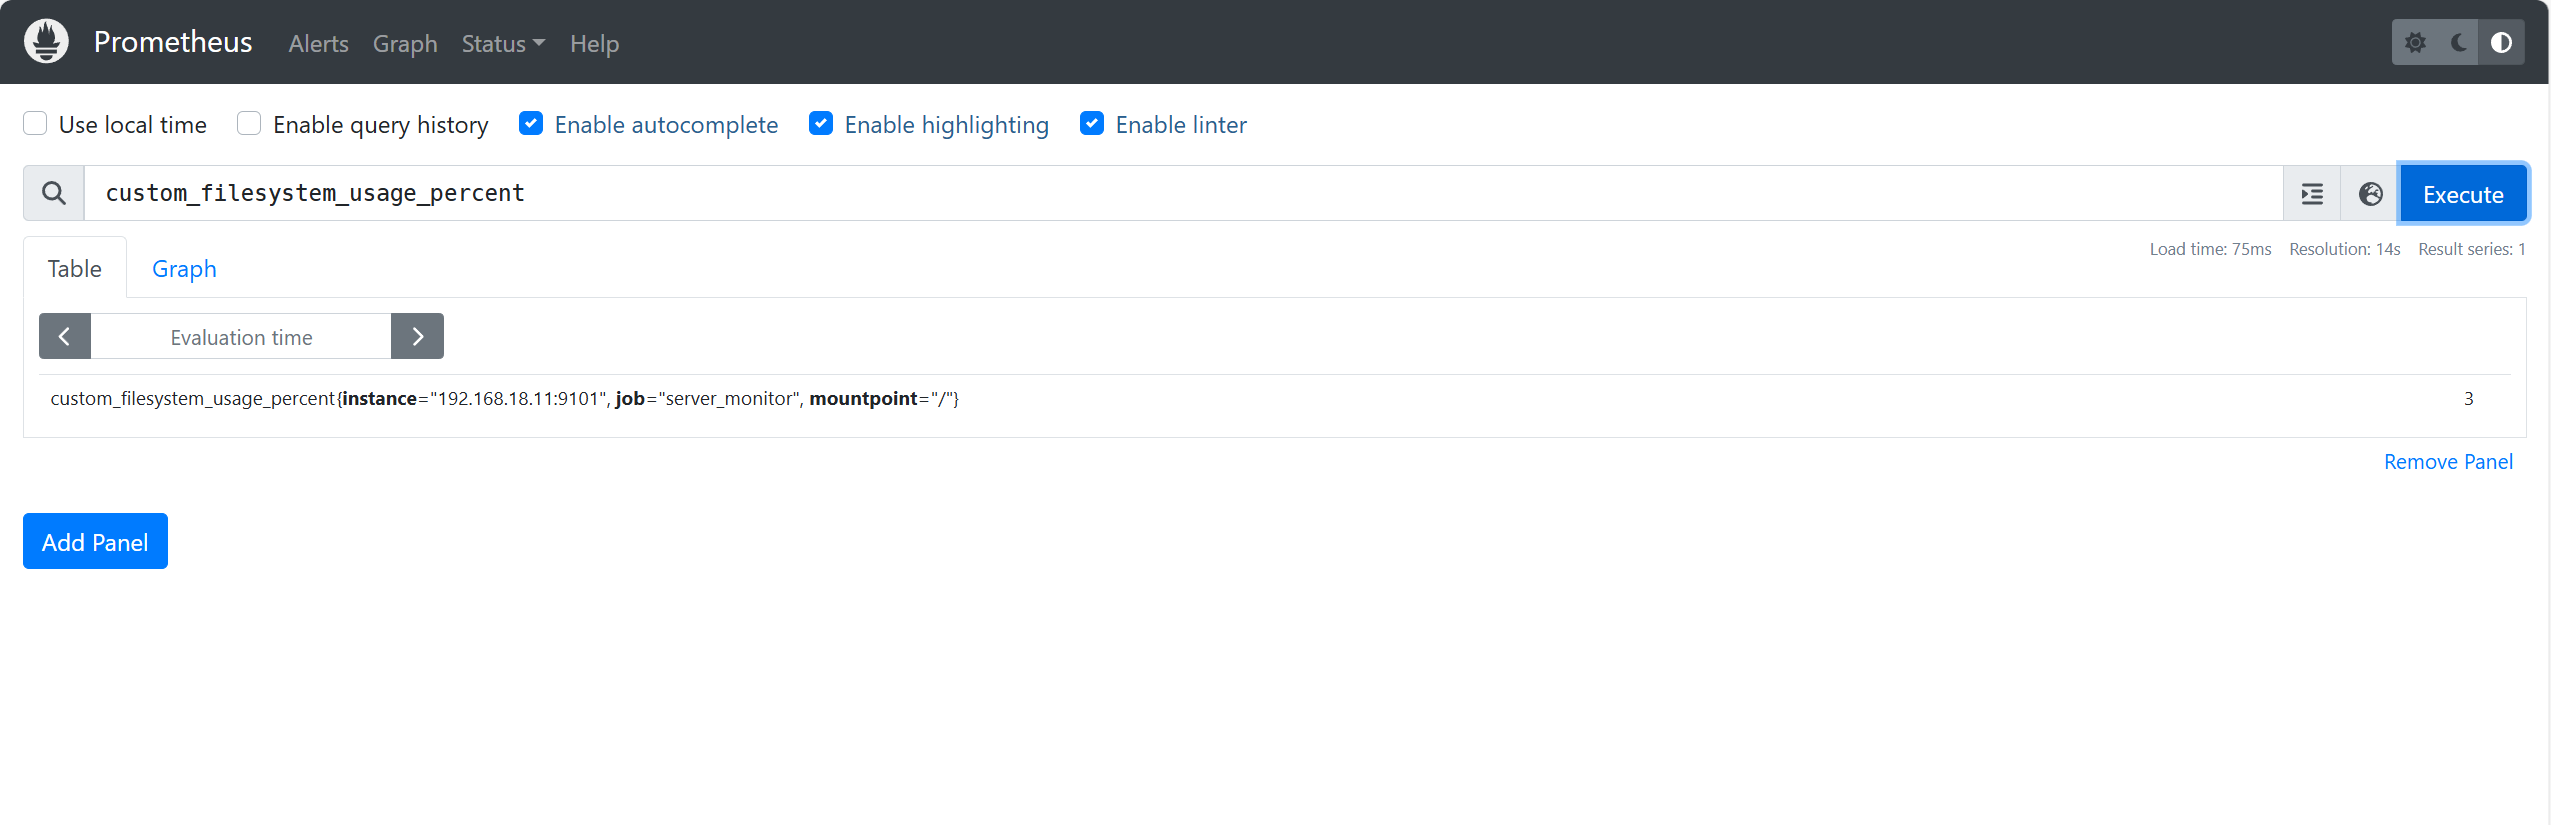
5、在Prometheus页面上验证有没有这2个自定义的指标,结果有。前提是Prometheus已经配置了job和Node_Exporter关联

 浙公网安备 33010602011771号