双柱表格组件
先上代码
入口twoColChartEntry.vue


<template>
  <div>
    <zd-two-col-chart
      :maxArr="maxArr"
      :testArr="testArr"
      :nameArr="nameArr"
      :sizeArr="sizeArr"
      :settingArr="settingArr"
    />
  </div>
</template>

<script>
import ZdTwoColChart from "../packages/twoColChart/src/main";

export default {
  // name: "Home",
  data() {
    return {
      msg: "",
      // Settings about chart [OPTIONAL]
      settingArr: {
        // backgroundColor: "#080f1b",
        // lTopColor: "orange",
        // lBotColor: "blue",
        // rTopColor: "purple",
        // rBotColor: "green",
        // colBorderWidth: 10,
      },
      // Size Array [OPTIONAL]
      // width | height (px)
      // Default setting: 500x400
      sizeArr: [],
      // Name Array [MUST]
      // From 0 to 2
      // y axis first name
      // y axis second name
      // y axis line name
      nameArr: ["Suc", "Fail", "Per"],
      // Maximum Array [MUST]
      // Corresponding to testArr a b maximum range
      // [0]:y axis maximun
      // [1]:y axis percent maximum
      maxArr: [25, 35],
      // Data Array [MUST]
      // id---x axis [Sort order ]
      // a---y axis first column
      // b---y axis second column
      // c---y axis line (% percent)
      testArr: [
        { id: 2, a: 3, b: 5, c: 12 },
        { id: 7, a: 1, b: 9, c: 11 },
        { id: 8, a: 5, b: 8, c: 12 },
        { id: 9, a: 8, b: 7, c: 15 },
        { id: 3, a: 8, b: 7, c: 30 },
        { id: 4, a: 18, b: 9, c: 17 },
        { id: 5, a: 15, b: 8, c: 23 },
        { id: 6, a: 22, b: 7, c: 30 },
        { id: 1, a: 11, b: 22, c: 20 },
        { id: 10, a: 12, b: 9, c: 17 },
        { id: 11, a: 15, b: 8, c: 23 },
      ],
    };
  },
  components: {
    ZdTwoColChart,
  },
};
</script>
组件区twoColChart/main.vue
<template>
  <div id="father">
    <div id="colAll"></div>
  </div>
</template>

<script>
import * as echarts from "echarts";

export default {
  name: "ZdTwoColChart",
  // Remember '' !!!
  // props: ["testArr", "maxArr", "nameArr", "sizeArr"],
  props: {
    testArr: {
      // Data
      type: Array,
    },
    maxArr: {
      // Chart maximum
      type: Array,
    },
    nameArr: {
      // Chart name
      type: Array,
    },
    sizeArr: {
      // Chart width and height
      type: Array,
    },
    settingArr: {
      // Chart option setting
      type: Object,
    },
  },
  data() {
    return {
      // Auto Resize
      myChart: [],
    };
  },
  mounted() {
    // The default echarts table shows this month
    window.onresize = () => {
      this.myChart.resize();
    };
    let sizeArr = this.sizeArr.length ? this.sizeArr : ["500px", "400px"];
    let t = document.getElementById("colAll");
    t.style.width = sizeArr[0];
    t.style.height = sizeArr[1];

    this.drawColAll();
  },
  methods: {
    drawColAll() {
      // Duplicate methods have done in beforeDestroy period.
      this.myChart = echarts.init(document.getElementById("colAll"));
      // split data into different arrays
      let maxArr = this.maxArr;
      let nameArr = this.nameArr;
      // let sizeArr = ["500px", "500px"];
      let aArr = [];
      let bArr = [];
      let perArr = [];
      let keyArr = [];
      // Setting Initialization
      let backgroundColor = this.settingArr.backgroundColor;
      let lTopColor = this.settingArr.lTopColor;
      let lBotColor = this.settingArr.lBotColor;
      let rTopColor = this.settingArr.rTopColor;
      let rBotColor = this.settingArr.rBotColor;
      let colBorderWidth = this.settingArr.colBorderWidth;

      this.testArr.forEach((key) => {
        keyArr.push(key.id);
        aArr.push(key.a);
        bArr.push(key.b);
        perArr.push(key.c);
      });

      function bubbleSort(keyArr, aArr, bArr, perArr) {
        for (let i = 0; i < keyArr.length - 1; i++) {
          for (let j = 0; j < keyArr.length - 1; j++) {
            if (keyArr[j] > keyArr[j + 1]) {
              let t = keyArr[j];
              keyArr[j] = keyArr[j + 1];
              keyArr[j + 1] = t;
              t = aArr[j];
              aArr[j] = aArr[j + 1];
              aArr[j + 1] = t;
              t = bArr[j];
              bArr[j] = bArr[j + 1];
              bArr[j + 1] = t;
              t = perArr[j];
              perArr[j] = perArr[j + 1];
              perArr[j + 1] = t;
            }
          }
        }
      }
      bubbleSort(keyArr, aArr, bArr, perArr);
      // console.log("key", keyArr, "\nA", aArr, "\nB", bArr, "\nPer", perArr);

      var option = {
        backgroundColor: backgroundColor ? backgroundColor : "#fff",
        tooltip: {
          trigger: "axis",
          axisPointer: {
            type: "shadow",
          },
          backgroundColor: "rgba(9, 24, 48, 0.5)",
          borderColor: "rgba(75, 253, 238, 0.4)",
          textStyle: {
            color: "#CFE3FC",
          },
          borderWidth: 1,
        },
        legend: [
          {
            data: [nameArr[0]],
            top: "25",
            x: "10%",
            itemWidth: 10,
            borderColor: "rgba(255, 192, 0, 1)",
            textStyle: {
              color: "#c1cadf",
            },
          },
          {
            data: [nameArr[1]],
            top: "25",
            x: "30%",
            itemWidth: 10,
            textStyle: {
              color: "#c1cadf",
            },
          },
          {
            // series name and legend name should be the same
            data: [nameArr[2] + "(%)"],
            x: "50%",
            // height with the top floor
            top: "25",
            itemStyle: {
              borderWidth: 2,
            },
            textStyle: {
              color: "#c1cadf",
            },
          },
        ],
        grid: {
          left: "20px",
          right: "20px",
          top: "50px",
          bottom: "30px",
          containLabel: true,
        },
        toolbox: {
          show: true,
          orient: "vertical",
          x: "right",
          y: "center",
        },
        xAxis: [
          {
            type: "category",
            boundaryGap: true,
            axisTick: {
              show: false,
            },
            data: keyArr,
            axisLine: {
              lineStyle: {
                color: "rgba(51, 176, 255, 1)",
              },
            },
            axisLabel: {
              interval: 0,
              color: "#8ccaf4",
              fontSize: 12,
            },
          },
        ],
        yAxis: [
          {
            type: "value",
            axisTick: {
              show: true,
            },
            axisLine: {
              show: true,
              lineStyle: {
                color: "rgba(120, 160, 236, 1)",
              },
              symbol: ["none", "arrow"],
              symbolSize: [5, 12],
              symbolOffset: [0, 10],
            },
            axisLabel: {
              interval: 0,
              color: "#8ccaf4",
            },
            max: maxArr[0],
            splitLine: {
              show: false,
              lineStyle: {
                color: "rgba(39, 57, 75, 1)",
                width: 1,
                type: "solid",
              },
            },
          },
          {
            type: "value",
            axisTick: {
              show: true,
            },
            axisLabel: {
              formatter: "{value} %",
              interval: 0,
              color: "#8ccaf4",
            },
            axisLine: {
              show: true,
              lineStyle: {
                color: "rgba(207, 227, 252, 1)t",
              },
              symbol: ["none", "arrow"],
              symbolSize: [5, 12],
              symbolOffset: [0, 10],
            },
            min: 0,
            max: maxArr[1],
            splitLine: {
              show: false,
              lineStyle: {
                color: "rgba(39, 57, 75, 1)",
                width: 1,
                type: "solid",
              },
            },
          },
        ],
        series: [
          {
            // series name and legend name should be the same
            name: nameArr[2] + "(%)",
            yAxisIndex: 1,
            type: "line",
            smooth: true,
            areaStyle: {
              color: new echarts.graphic.LinearGradient(0, 0, 0, 1, [
                {
                  offset: 0,
                  color: "rgba(194, 175, 223, 1)",
                },
                {
                  offset: 1,
                  color: "rgba(98, 227, 255, 0)",
                },
              ]),
            },
            data: perArr,
            symbol: "circle",
            symbolSize: 8,
            // Line Style
            itemStyle: {
              color: "#FFFFFF",
              borderColor: "rgba(111, 25, 240, 1)",
              lineStyle: {
                color: "rgba(194, 175, 223,1)",
              },
            },
          },
          // Gradient background color
          {
            type: "bar",
            yAxisIndex: 0,
            name: nameArr[0],
            itemStyle: {
              color: new echarts.graphic.LinearGradient(
                0,
                0,
                0,
                1,
                [
                  {
                    offset: 0,
                    color: lTopColor ? lTopColor : "rgba(194, 175, 223, 1)",
                  },
                  {
                    offset: 1,
                    color: lBotColor ? lBotColor : "rgba(232, 98, 32, 0)",
                  },
                ],
                false
              ),
            },
            // column width
            barWidth: colBorderWidth ? colBorderWidth : 12,
            data: aArr,
          },
          {
            type: "bar",
            yAxisIndex: 0,
            name: nameArr[1],
            itemStyle: {
              color: new echarts.graphic.LinearGradient(
                0,
                0,
                0,
                1,
                [
                  {
                    offset: 0,
                    color: rTopColor ? rTopColor : "rgba(40, 158, 255, 1)",
                  },
                  {
                    offset: 1,
                    color: rBotColor ? rBotColor : "rgba(32, 178, 232, 0)",
                  },
                ],
                false
              ),
            },
            barWidth: colBorderWidth ? colBorderWidth : 12,
            data: bArr,
          },
        ],
      };

      this.myChart.setOption(option);
    },
  },
  beforeDestroy() {
    if (this.myChart === null) {
      return;
    }
    this.myChart.dispose();
    this.myChart = null;
  },
};
</script>

<style scoped>
el-card {
  border: 0px !important;
}
</style>
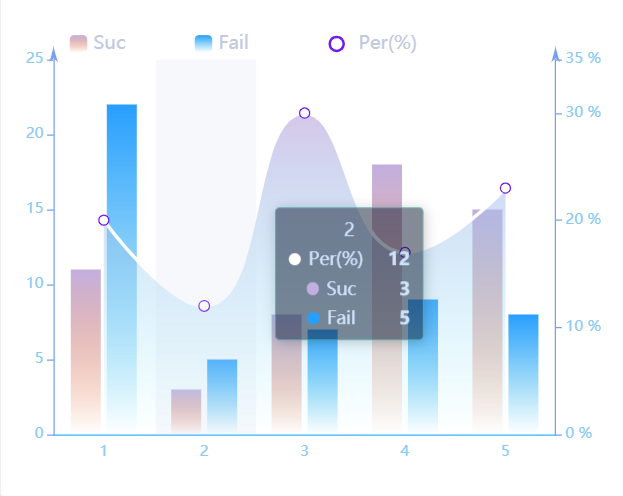
效果如图
如果传入数据未排序,则按照KeyArr数组顺序依次排好,在drawColAll函数中加入冒泡排序
      function bubbleSort(keyArr, aArr, bArr, perArr) {
        for (let i = 0; i < keyArr.length - 1; i++) {
          for (let j = 0; j < keyArr.length - 1; j++) {
            if (keyArr[j] > keyArr[j + 1]) {
              let t = keyArr[j];
              keyArr[j] = keyArr[j + 1];
              keyArr[j + 1] = t;
              t = aArr[j];
              aArr[j] = aArr[j + 1];
              aArr[j + 1] = t;
              t = bArr[j];
              bArr[j] = bArr[j + 1];
              bArr[j + 1] = t;
              t = perArr[j];
              perArr[j] = perArr[j + 1];
              perArr[j + 1] = t;
            }
          }
        }
      }
      bubbleSort(keyArr, aArr, bArr, perArr);

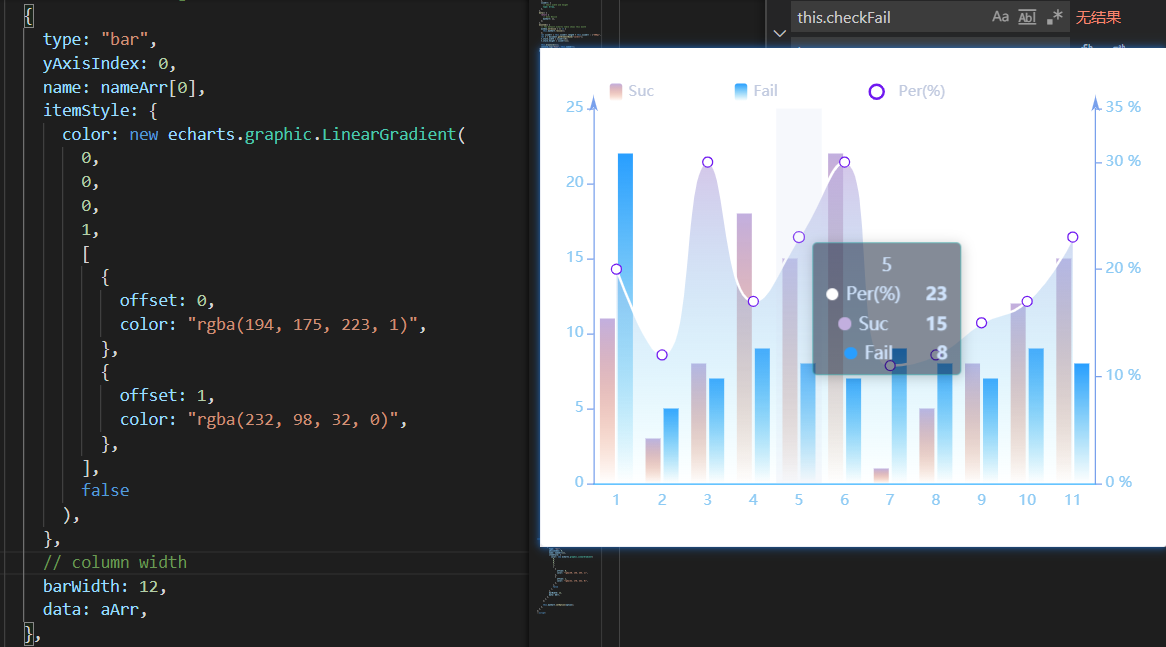
这里表格柱子宽度太大,有些挡在一起,我改变宽度后正常了
记得在beforeDestroy时期挂上清除echarts图
  beforeDestroy() {
    if (this.myChart === null) {
      return;
    }
    this.myChart.dispose();
    this.myChart = null;
  },
人生到处知何似,应似飞鸿踏雪泥。

 浙公网安备 33010602011771号