
Echarts之内嵌圆环图v5.1.2
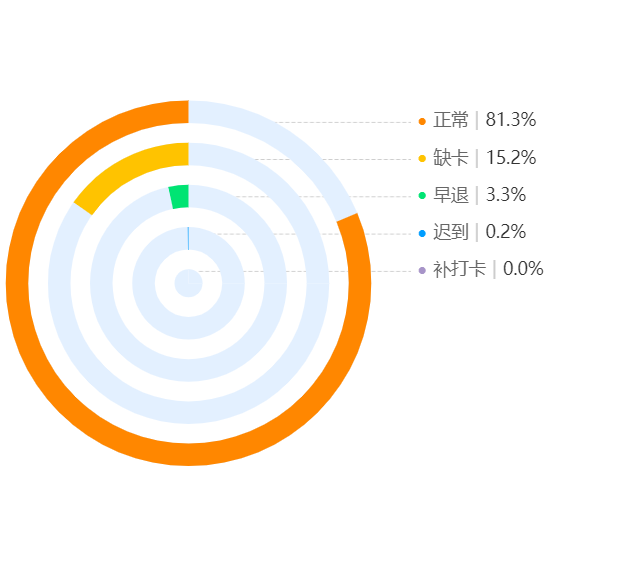
相比v4,v5有些许变动。我也没看官方文档,就对着浏览器开发者工具报错的地方一个一个调的,又综合了别人的经验,代码如下
放在drawPieAll function下
 drawPieAll() {
      // myChart paint more times, it will warn
      if (
        this.myChart != null &&
        this.myChart != "" &&
        this.myChart != undefined
      ) {
        this.myChart.dispose();
      }
      this.$nextTick(() => {
        this.myChart = echarts.init(document.getElementById("pieAll"));

        let dashedPic =
          "data:image/png;base64,iVBORw0KGgoAAAANSUhEUgAAAM8AAAAOBAMAAAB6G1V9AAAAD1BMVEX////Kysrk5OTj4+TJycoJ0iFPAAAAG0lEQVQ4y2MYBaNgGAMTQQVFOiABhlEwCugOAMqzCykGOeENAAAAAElFTkSuQmCC";
        let color = ["#FF8700", "#ffc300", "#00e473", "#009DFF", "#a794c8"];
        let chartData = [
          { value: this.getAmount("statement", "正常"), name: "正常" },
          { value: this.getAmount("statement", "缺卡"), name: "缺卡" },
          { value: this.getAmount("statement", "早退"), name: "早退" },
          { value: this.getAmount("statement", "迟到"), name: "迟到" },
          {
            value: this.getAmount("statement", "补打卡"),
            name: "补打卡",
          },
        ];
        let arrName = [];
        let arrValue = [];
        let sum = 0;
        let pieSeries = [],
          lineYAxis = [];

        // 数据处理
        chartData.forEach((v, i) => {
          arrName.push(v.name);
          arrValue.push(v.value);
          sum = sum + v.value;
        });

        // 图表option整理
        chartData.forEach((v, i) => {
          pieSeries.push({
            name: "考勤情况",
            type: "pie",
            clockwise: false,
            radius: [65 - i * 15 + "%", 57 - i * 15 + "%"],
            center: ["30%", "50%"],
            label: {
              show: false,
            },
            data: [
              {
                value: v.value,
                name: v.name,
              },
              {
                value: sum - v.value,
                name: "",
                itemStyle: {
                  color: "rgba(0,0,0,0)",
                },
              },
            ],
          });
          pieSeries.push({
            name: "",
            type: "pie",
            silent: true,
            z: 1,
            clockwise: false, //顺时加载
            radius: [65 - i * 15 + "%", 57 - i * 15 + "%"],
            center: ["30%", "50%"],
            label: {
              show: false,
            },
            data: [
              {
                value: 7.5,
                itemStyle: {
                  color: "#E3F0FF",
                },
              },
              {
                value: 2.5,
                name: "",
                itemStyle: {
                  color: "#e3f0ff",
                },
              },
            ],
          });
          v.percent = ((v.value / sum) * 100).toFixed(1) + "%";
          lineYAxis.push({
            value: i,
textStyle: {
rich: {
circle: {
color: color[i],
padding: [0, 5]
}
}
}
          });
        });

        var option = {
          tooltip: {
            trigger: "item",
          },
          backgroundColor: "#fff",
          color: color,
          grid: {
            top: "18%",
            bottom: "220",
            left: "30%",
            containLabel: false,
          },
          yAxis: [
            {
              type: "category",
              inverse: true,
              axisLine: {
                show: false,
              },
              axisTick: {
                show: false,
              },
              axisLabel: {
                rich: {
                  circle: {
                    color: color[1],
                    padding: [0, 5],
                  },
                },
                formatter: function (params) {
                  let item = chartData[params];
                  console.log(item);
                  return (
                    "{line|}{circle|●}{name|" +
                    item.name +
                    "}{bd||}{percent|" +
                    item.percent +
                    "}"
                  );
                },
                interval: 0,
                inside: true,
                textStyle: {
                  color: "#333",
                  fontSize: 14,
                  rich: {
                    line: {
                      width: 170,
                      height: 10,
                      backgroundColor: { image: dashedPic },
                    },
                    name: {
                      color: "#666",
                      fontSize: 14,
                    },
                    bd: {
                      color: "#ccc",
                      padding: [0, 5],
                      fontSize: 14,
                    },
                    percent: {
                      color: "#333",
                      fontSize: 14,
                    },
                    value: {
                      color: "#333",
                      fontSize: 16,
                      fontWeight: 500,
                      padding: [0, 0, 0, 20],
                    },
                    unit: {
                      fontSize: 14,
                    },
                  },
                },
                show: true,
              },
              data: lineYAxis,
            },
          ],
          xAxis: [
            {
              show: false,
            },
          ],
          series: pieSeries,
        };
      this.myChart.setOption(option);
      });
}
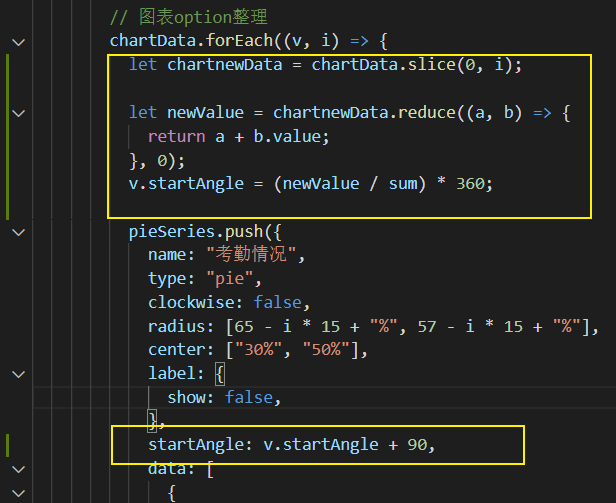
加强版——叠加直360°

加入了一个计算旋转角度的玩意
参考文档
人生到处知何似,应似飞鸿踏雪泥。

 浙公网安备 33010602011771号