k3s 基础 —— 快捷搭建 loki
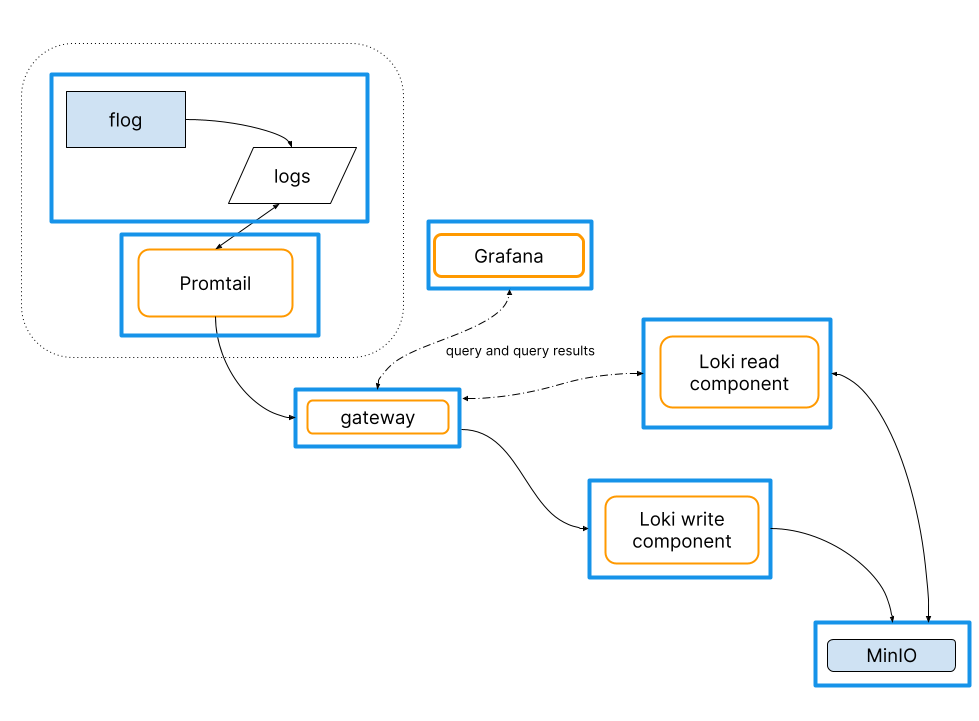
核心组件 3 个 chart:
- promtail 这是一个 agent 代理客户端,用于收集日志,将日志传送给 loki
- loki 核心组件,主要功能是日志数据的写入与分析。包含 gateway、read、write 3个组件。
- kube-prometheus-stack 这个技术栈包含 prometheus,grafana,prometheus operator 等组件。prometheus 主要用于数据监控与告警。grafana 图形界面展示。Prometheus Operator 用于在 k8s 中能够帮助用户自动化的创建以及管理 Prometheus Server 以及其相应的配置(监听一些 crd 资源的配置)。
部署 loki
新增配置文件 /var/lib/rancher/k3s/server/manifests/loki.yaml
创建 smtp secret
kubectl create secret generic smtp-secret --from-literal=user=<SMTP_USER> --from-literal=password=<SMTP_PASSWORD> -n monitoring
grafana.yaml 配置文件
apiVersion: v1
kind: Namespace
metadata:
  name: monitoring
---
apiVersion: helm.cattle.io/v1
kind: HelmChart
metadata:
  name: kube-prometheus-stack
  namespace: kube-system
spec:
  repo: https://prometheus-community.github.io/helm-charts
  chart: kube-prometheus-stack
  version: 77.5.0
  targetNamespace: monitoring
  valuesContent: |-
    grafana:
      adminUser: xfe1235
      adminPassword: xiangzhi@5205
      persistence:
        enabled: true
        size: 4Gi
      # assertNoLeakedSecrets: false
      smtp:
        existingSecret: smtp-secret
        userKey: user
        passwordKey: password
      grafana.ini:
        server:
          root_url: https://grafana.s.carry-flap.com/
        smtp:
          enabled: true
          host: email-smtp.ap-northeast-1.amazonaws.com:465
          from_address: noreply@xxx.com
          from_name: Xxx
          #password: xxxxxxxxxxxxxxxxxxxxxx
          #password: $__env{SMTP_PWD}
          #user: xxxxx
---
apiVersion: helm.cattle.io/v1
kind: HelmChart
metadata:
  name: promtail
  namespace: kube-system
spec:
  repo: https://grafana.github.io/helm-charts
  chart: promtail
  version: 6.17.0
  targetNamespace: monitoring
  valuesContent: |-
    daemonset:
      enabled: true
注:grafana alert 触发警报时邮件提醒,需要填写发信邮箱 SMTP 相关配置。
更多配置参考:
① https://github.com/grafana/helm-charts/blob/main/charts/grafana/values.yaml
② https://github.com/prometheus-community/helm-charts/blob/main/charts/kube-prometheus-stack/values.yaml
loki.yaml 配置文件
apiVersion: helm.cattle.io/v1
kind: HelmChart
metadata:
  name: loki
  namespace: kube-system
spec:
  repo: https://grafana.github.io/helm-charts
  chart: loki
  version: 6.39.0
  targetNamespace: monitoring
  valuesContent: |-
    loki:
      auth_enabled: false
      commonConfig:
        path_prefix: /var/loki
        replication_factor: 1
      # 配置 Schema
      schemaConfig:
        configs:
          - from: "2020-07-31"
            index:
              period: 24h
              prefix: index_
            object_store: s3
            schema: v13
            store: tsdb
      # 配置存储
      storage:
        type: s3
      # 配置存储详细信息
      storage_config:
        tsdb_shipper:
          active_index_directory: /var/loki/tsdb-index
          cache_location: /var/loki/tsdb-cache
      # 配置压缩器
      compactor:
        working_directory: /var/loki/compactor
        compaction_interval: 1h
        retention_enabled: true
        retention_delete_delay: 2h
        retention_delete_worker_count: 30
        delete_request_store: s3
      # 配置日志保留策略
      limits_config:
        retention_period: 48h
    # Simple Scalable 模式配置
    backend:
      replicas: 1
    read:
      replicas: 1
    write:
      replicas: 1
    # 禁用 chunksCache 以节省资源
    chunksCache:
      enabled: false
    # 禁用 resultsCache 以节省资源
    resultsCache:
      enabled: false
    # MinIO 配置
    minio:
      enabled: true
      # storage class 为local-path 不支持容量限制
      persistence:
        size: 5Gi
执行部署
kubectl apply -f grafana.yaml
kubectl apply -f loki.yaml
PS: 若要访问 minio console,可执行下面的命令进行流量转发。浏览器访问 http://server_ip:9001 ,默认账号 enterprise-logs/supersecret
kubectl port-forward -n monitoring service/loki-minio-console 9001:9001 --address 0.0.0.0
查询日志数据
配置 grafana 访问路由
新增配置文件 grafana-traefik.yaml
apiVersion: traefik.containo.us/v1alpha1
kind: IngressRoute
metadata:
  name: grafana-web
  namespace: monitoring
spec:
  entryPoints:
    - web
  routes:
    - kind: Rule
      match: Host(`grafana.example.com`)
      services:
        - name: kube-prometheus-stack-grafana
          namespace: monitoring
          port: 80
执行部署命令后,即可访问 grafana.example.com
kubectl apply -f grafana-traefik.yaml
默认的账号密码:admin/prom-operator 查看
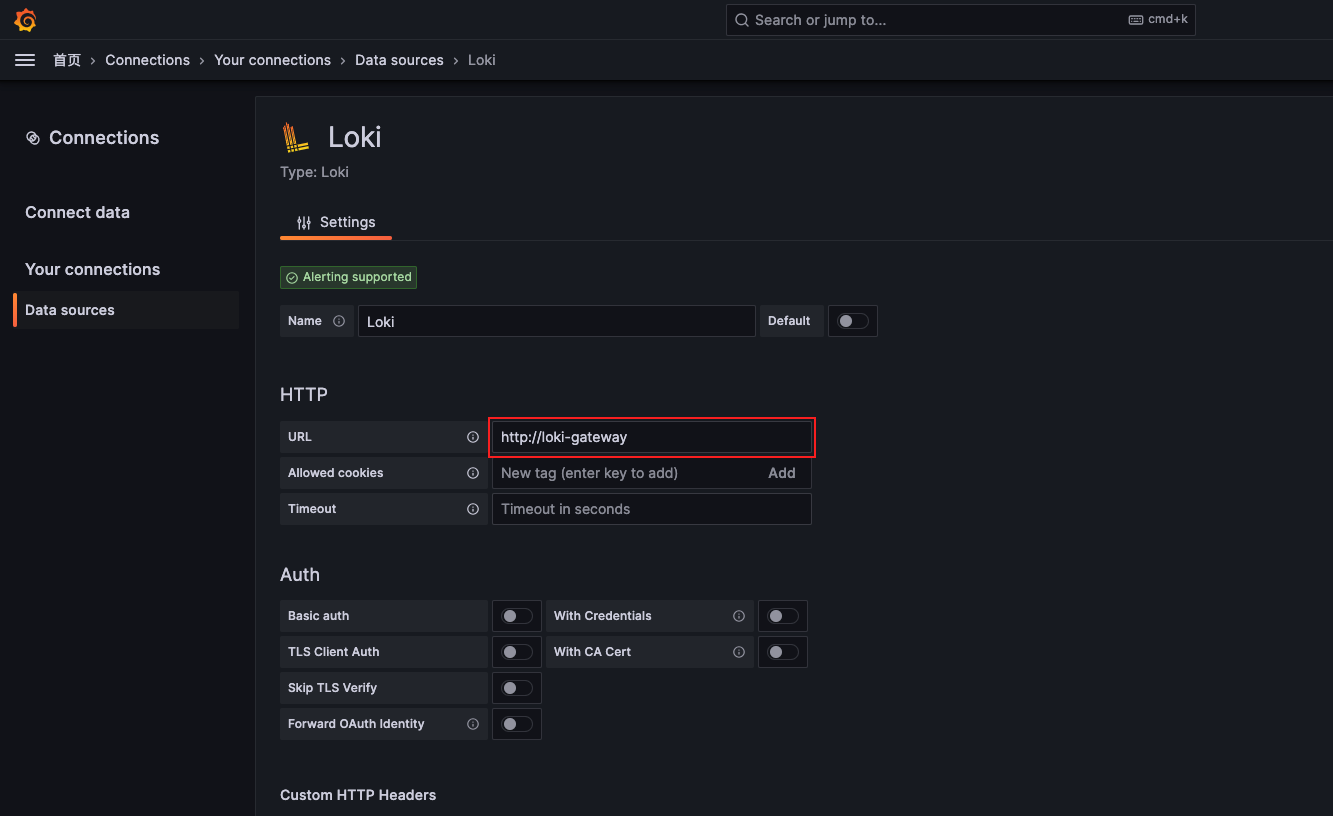
添加 loki 数据源
打开 Data sources 页面,添加 loki 数据源。其中 url 为 http://loki-gateway
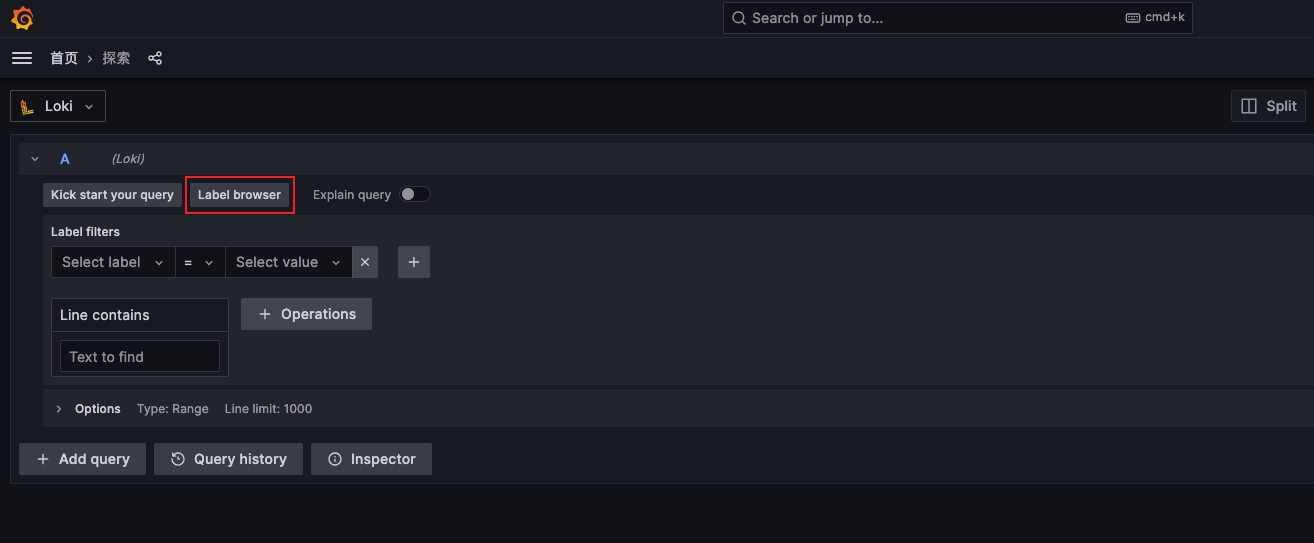
查询日志
打开 explore 页面。选择 Label Broswer
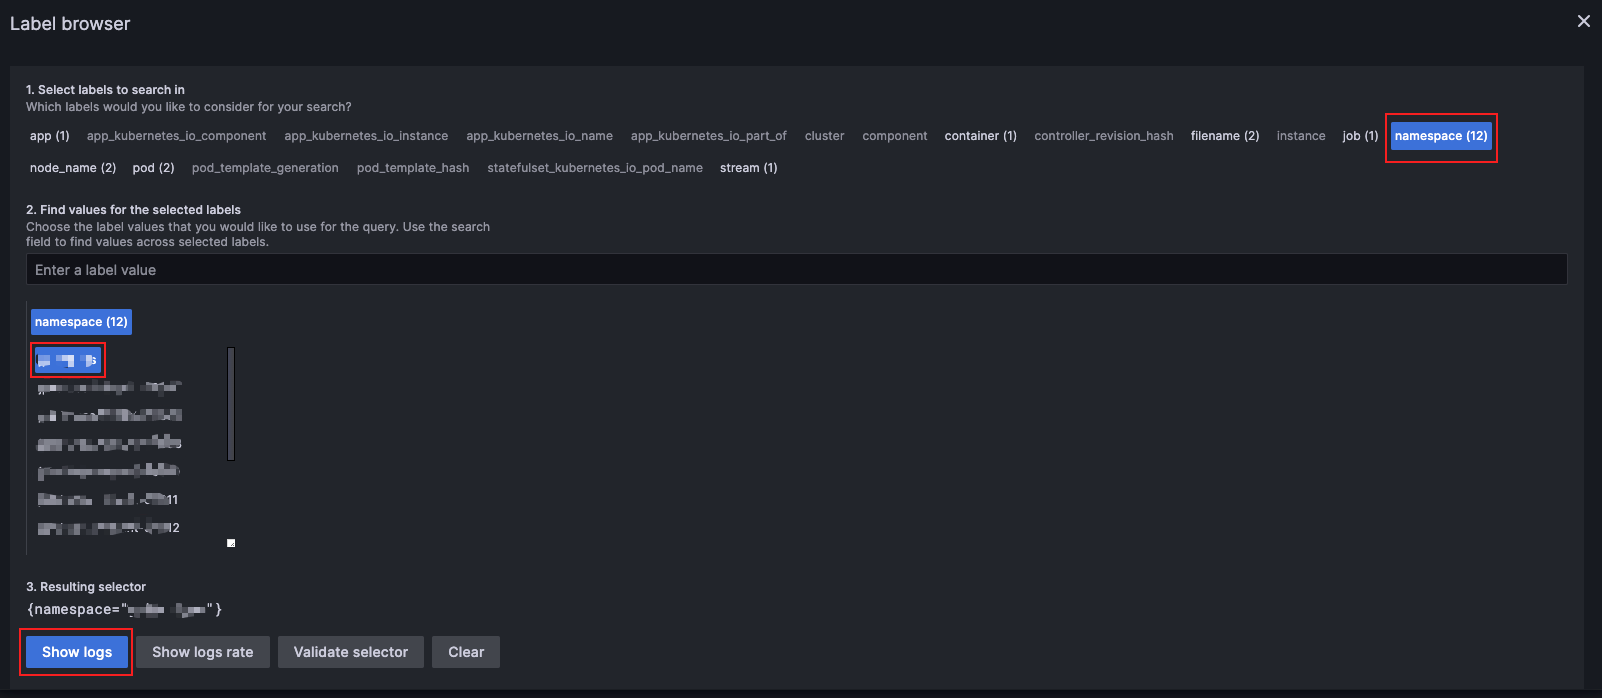
选择需要查询的标签,如 namespace,然后选择列表出现的任一值,最后点击下方的 Show logs 进行查询
2233

 浙公网安备 33010602011771号