
之前已经说过了自己写sh脚本监控,我看有人评论了说用telegraf进行数据收集,于是乎去研究了下,感觉还可以,不过磁盘io的的表个人感觉有些美中不足,并未直接给出读写速率的情况,可能是研究时间太短,没搞定,希望会的能够指点迷津,接下来把我这两天研究的成果展示下。
首先我们需要安装telegraf,百度查找一下相关资料即可,可参考https://www.jianshu.com/p/dfd329d30891,安装比较简单,这里简单再说一下:
wget https://dl.influxdata.com/telegraf/releases/telegraf-1.0.1.x86_64.rpm    #获取rpm包
yum localinstall telegraf-1.0.1.x86_64.rpm                    #直接localinstall安装
然后在/etc/telegraf/配置下文件telegraf.conf:
数据源配置:找到下面字段,账号密码可以用之前设置好的
[[outputs.influxdb]]
  urls = ["http://10.10.18.165:8086"]  #infulxdb地址
  database = "telegraf" #数据库
  precision = "s"
  timeout = "5s"
  #username = "admin" #帐号
  #password = "admin" #密码
telegrfa默认开启下列几项系统性能收集,也可以通过配置文件自定义收集应用服务性能数据
安装配置完后,进到influxdb里面可以看到几张表,如下:

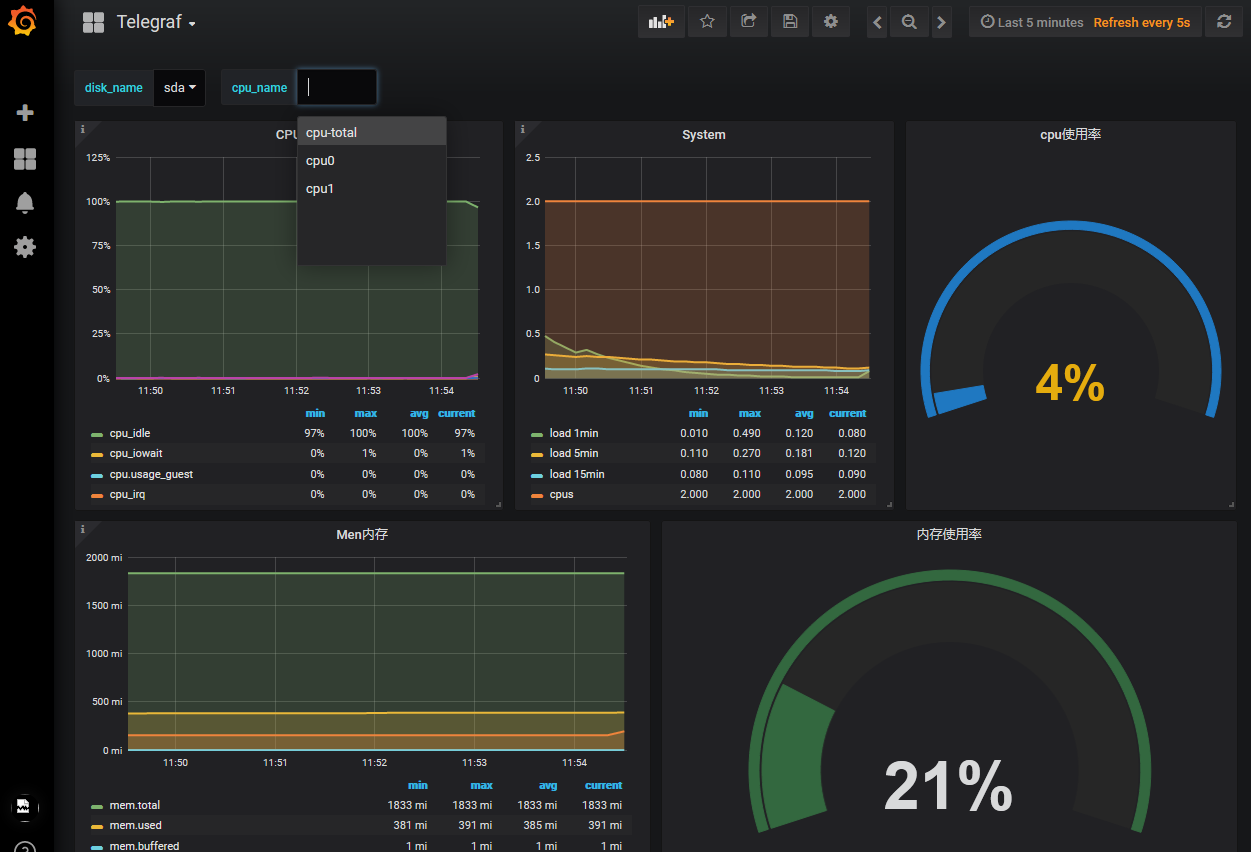
然后再将数据通过sql展现到grafana界面即可,效果图如下,因为cpu和磁盘会有多个,所以要弄成变量可以自由选择:
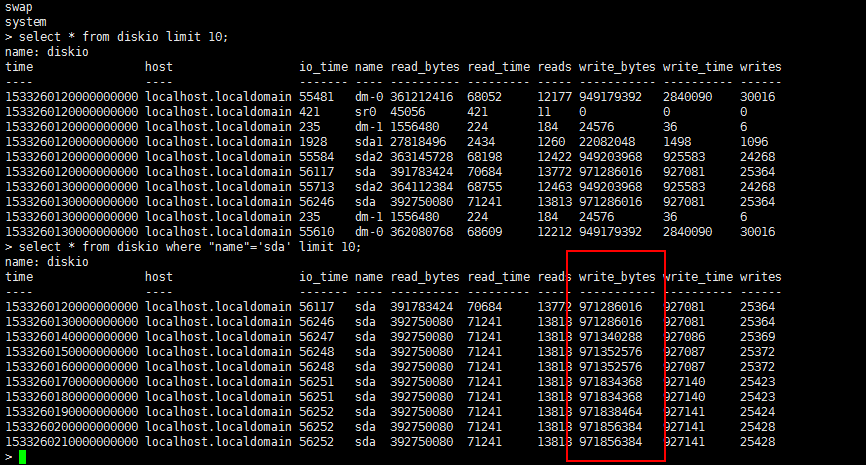
不过磁盘的io还是没搞好,请看下表,write_bytes是总字节,是不断在变大的,而且10s更新一次数据,所以很尴尬,不能直接读取,需要后一个减去前一个然后除以时间才能得到速率,influxdb的语法还跟sql语法不完全一致,因此没想到啥好的想法去展现,看下谁有好的办法可以展示下。
这里贴出自己搞得结果给大家看下,格式是json格式导出的,你只要粘贴保存json格式导入就可以用了:
{
"__inputs": [
{
"name": "DS_TELEGRAF",
"label": "Telegraf",
"description": "",
"type": "datasource",
"pluginId": "influxdb",
"pluginName": "InfluxDB"
}
],
"__requires": [
{
"type": "grafana",
"id": "grafana",
"name": "Grafana",
"version": "5.2.1"
},
{
"type": "panel",
"id": "graph",
"name": "Graph",
"version": "5.0.0"
},
{
"type": "datasource",
"id": "influxdb",
"name": "InfluxDB",
"version": "5.0.0"
},
{
"type": "panel",
"id": "singlestat",
"name": "Singlestat",
"version": "5.0.0"
}
],
"annotations": {
"list": [
{
"builtIn": 1,
"datasource": "-- Grafana --",
"enable": true,
"hide": true,
"iconColor": "rgba(0, 211, 255, 1)",
"name": "Annotations & Alerts",
"type": "dashboard"
}
]
},
"editable": true,
"gnetId": null,
"graphTooltip": 0,
"id": null,
"iteration": 1533610408171,
"links": [],
"panels": [
{
"aliasColors": {},
"bars": false,
"dashLength": 10,
"dashes": false,
"datasource": "${DS_TELEGRAF}",
"description": "在任意时间内,CPU有7个状态: \n1.idle,表示CPU闲置并等待工作分配.\n \n2.user,表示CPU在运行用户的进程 \n\n3.system,表示CPU在执行kernel工作 \n\n4.nice,表示CPU花费在被nice改变过优先级的process上的时间(注意:被nice命令改变优先级的process仅指那些nice值为负的process.花费在被nice命令改变优先级的任务上的时间也将被计算在系统和用户时间内,因此整个时间加起来可能会超过百分之百) \n\n5.iowait,表示CPU等待IO操作完成的时间 \n\n6.irq,表示CPU开销在响应硬中断上的时间 \n\n7.softirq,表示CPU开销在响应软中断上的时间. \n\n我们一般用vmstat看到的都是四个状态:sy,us,id,wa,通过他和load avg结合,基本可以知道cpu的状态",
"fill": 2,
"gridPos": {
"h": 10,
"w": 9,
"x": 0,
"y": 0
},
"id": 2,
"legend": {
"alignAsTable": true,
"avg": true,
"current": true,
"max": true,
"min": true,
"show": true,
"total": false,
"values": true
},
"lines": true,
"linewidth": 2,
"links": [],
"nullPointMode": "null",
"percentage": false,
"pointradius": 5,
"points": false,
"renderer": "flot",
"seriesOverrides": [],
"spaceLength": 10,
"stack": false,
"steppedLine": false,
"targets": [
{
"alias": "cpu_idle",
"groupBy": [
{
"params": [
"$__interval"
],
"type": "time"
},
{
"params": [
"null"
],
"type": "fill"
}
],
"hide": false,
"orderByTime": "ASC",
"policy": "default",
"query": "SELECT \"usage_idle\" from (select * from cpu group by \"cpu\") WHERE \"cpu\" =~ /^$cpu_name$/ and $timeFilter fill(null)",
"rawQuery": true,
"refId": "B",
"resultFormat": "time_series",
"select": [
[
{
"params": [
"value"
],
"type": "field"
},
{
"params": [],
"type": "mean"
}
]
],
"tags": []
},
{
"alias": "cpu_iowait",
"groupBy": [
{
"params": [
"$__interval"
],
"type": "time"
},
{
"params": [
"null"
],
"type": "fill"
}
],
"hide": false,
"orderByTime": "ASC",
"policy": "default",
"query": "SELECT \"usage_iowait\" from (select * from cpu group by \"cpu\") WHERE \"cpu\" =~ /^$cpu_name$/ and $timeFilter fill(null)",
"rawQuery": true,
"refId": "C",
"resultFormat": "time_series",
"select": [
[
{
"params": [
"value"
],
"type": "field"
},
{
"params": [],
"type": "mean"
}
]
],
"tags": []
},
{
"groupBy": [
{
"params": [
"$__interval"
],
"type": "time"
},
{
"params": [
"null"
],
"type": "fill"
}
],
"hide": false,
"orderByTime": "ASC",
"policy": "default",
"query": "SELECT \"usage_guest\" from (select * from cpu group by \"cpu\") WHERE \"cpu\" =~ /^$cpu_name$/ and $timeFilter fill(null)",
"rawQuery": true,
"refId": "D",
"resultFormat": "time_series",
"select": [
[
{
"params": [
"value"
],
"type": "field"
},
{
"params": [],
"type": "mean"
}
]
],
"tags": []
},
{
"alias": "cpu_irq",
"groupBy": [
{
"params": [
"$__interval"
],
"type": "time"
},
{
"params": [
"null"
],
"type": "fill"
}
],
"hide": false,
"orderByTime": "ASC",
"policy": "default",
"query": "SELECT \"usage_irq\" from (select * from cpu group by \"cpu\") WHERE \"cpu\" =~ /^$cpu_name$/ and $timeFilter fill(null)",
"rawQuery": true,
"refId": "E",
"resultFormat": "time_series",
"select": [
[
{
"params": [
"value"
],
"type": "field"
},
{
"params": [],
"type": "mean"
}
]
],
"tags": []
},
{
"alias": "cpu_softirq",
"groupBy": [
{
"params": [
"$__interval"
],
"type": "time"
},
{
"params": [
"null"
],
"type": "fill"
}
],
"hide": false,
"orderByTime": "ASC",
"policy": "default",
"query": "SELECT \"usage_softirq\" from (select * from cpu group by \"cpu\") WHERE \"cpu\" =~ /^$cpu_name$/ and $timeFilter fill(null)",
"rawQuery": true,
"refId": "F",
"resultFormat": "time_series",
"select": [
[
{
"params": [
"value"
],
"type": "field"
},
{
"params": [],
"type": "mean"
}
]
],
"tags": []
},
{
"alias": "cpu_user",
"groupBy": [
{
"params": [
"$__interval"
],
"type": "time"
},
{
"params": [
"null"
],
"type": "fill"
}
],
"hide": false,
"orderByTime": "ASC",
"policy": "default",
"query": "SELECT \"usage_user\" from (select * from cpu group by \"cpu\") WHERE \"cpu\" =~ /^$cpu_name$/ and $timeFilter fill(null)",
"rawQuery": true,
"refId": "G",
"resultFormat": "time_series",
"select": [
[
{
"params": [
"value"
],
"type": "field"
},
{
"params": [],
"type": "mean"
}
]
],
"tags": []
},
{
"alias": "cpu_system",
"groupBy": [
{
"params": [
"$__interval"
],
"type": "time"
},
{
"params": [
"null"
],
"type": "fill"
}
],
"hide": false,
"orderByTime": "ASC",
"policy": "default",
"query": "SELECT \"usage_system\" from (select * from cpu group by \"cpu\") WHERE \"cpu\" =~ /^$cpu_name$/ and $timeFilter fill(null)",
"rawQuery": true,
"refId": "H",
"resultFormat": "time_series",
"select": [
[
{
"params": [
"value"
],
"type": "field"
},
{
"params": [],
"type": "mean"
}
]
],
"tags": []
}
],
"thresholds": [],
"timeFrom": null,
"timeShift": null,
"title": "CPU",
"tooltip": {
"shared": true,
"sort": 0,
"value_type": "individual"
},
"transparent": false,
"type": "graph",
"xaxis": {
"buckets": null,
"mode": "time",
"name": null,
"show": true,
"values": []
},
"yaxes": [
{
"format": "percent",
"label": null,
"logBase": 1,
"max": null,
"min": null,
"show": true
},
{
"format": "short",
"label": null,
"logBase": 1,
"max": null,
"min": null,
"show": true
}
],
"yaxis": {
"align": false,
"alignLevel": null
}
},
{
"aliasColors": {},
"bars": false,
"dashLength": 10,
"dashes": false,
"datasource": "${DS_TELEGRAF}",
"description": "在CPU中可以理解为CPU可以并行处理的任务数,那么就是“CPU个数 * 核数”,如果CPU Load = CPU个数 * 核数 那么就是说CPU正好满负载,再多一点,可能就要出问题了,有任务不能被及时分配处理器,那么保证性能的话,最好是小于CPU个数 * 核数 *0.7。\n\nLoad Average是 CPU的 Load,它所包含的信息是在一段时间内 CPU正在处理以及等待 CPU处理的进程数之和的统计信息,也就是 CPU使用队列的长度的统计信息。\n\nLoad Average 的值应该小于“CPU个数 * 核数 *0.7 ” ,否则就高了。",
"fill": 2,
"gridPos": {
"h": 10,
"w": 8,
"x": 9,
"y": 0
},
"id": 4,
"legend": {
"alignAsTable": true,
"avg": true,
"current": true,
"max": true,
"min": true,
"show": true,
"total": false,
"values": true
},
"lines": true,
"linewidth": 2,
"links": [],
"nullPointMode": "null",
"percentage": false,
"pointradius": 5,
"points": false,
"renderer": "flot",
"seriesOverrides": [],
"spaceLength": 10,
"stack": false,
"steppedLine": false,
"targets": [
{
"alias": "load 1min",
"groupBy": [
{
"params": [
"$__interval"
],
"type": "time"
},
{
"params": [
"null"
],
"type": "fill"
}
],
"orderByTime": "ASC",
"policy": "default",
"query": "SELECT load1 FROM system WHERE $timeFilter fill(null)",
"rawQuery": true,
"refId": "B",
"resultFormat": "time_series",
"select": [
[
{
"params": [
"value"
],
"type": "field"
},
{
"params": [],
"type": "mean"
}
]
],
"tags": []
},
{
"alias": "load 5min",
"groupBy": [
{
"params": [
"$__interval"
],
"type": "time"
},
{
"params": [
"null"
],
"type": "fill"
}
],
"orderByTime": "ASC",
"policy": "default",
"query": "SELECT load5 FROM system WHERE $timeFilter fill(null)",
"rawQuery": true,
"refId": "C",
"resultFormat": "time_series",
"select": [
[
{
"params": [
"value"
],
"type": "field"
},
{
"params": [],
"type": "mean"
}
]
],
"tags": []
},
{
"alias": "load 15min",
"groupBy": [
{
"params": [
"$__interval"
],
"type": "time"
},
{
"params": [
"null"
],
"type": "fill"
}
],
"orderByTime": "ASC",
"policy": "default",
"query": "SELECT load15 FROM system WHERE $timeFilter fill(null)",
"rawQuery": true,
"refId": "D",
"resultFormat": "time_series",
"select": [
[
{
"params": [
"value"
],
"type": "field"
},
{
"params": [],
"type": "mean"
}
]
],
"tags": []
},
{
"alias": "cpus",
"groupBy": [
{
"params": [
"$__interval"
],
"type": "time"
},
{
"params": [
"null"
],
"type": "fill"
}
],
"orderByTime": "ASC",
"policy": "default",
"query": "SELECT n_cpus FROM system WHERE $timeFilter fill(null)",
"rawQuery": true,
"refId": "E",
"resultFormat": "time_series",
"select": [
[
{
"params": [
"value"
],
"type": "field"
},
{
"params": [],
"type": "mean"
}
]
],
"tags": []
}
],
"thresholds": [],
"timeFrom": null,
"timeShift": null,
"title": "System",
"tooltip": {
"shared": true,
"sort": 0,
"value_type": "individual"
},
"type": "graph",
"xaxis": {
"buckets": null,
"mode": "time",
"name": null,
"show": true,
"values": []
},
"yaxes": [
{
"format": "short",
"label": null,
"logBase": 1,
"max": null,
"min": null,
"show": true
},
{
"format": "short",
"label": null,
"logBase": 1,
"max": null,
"min": null,
"show": true
}
],
"yaxis": {
"align": false,
"alignLevel": null
}
},
{
"cacheTimeout": null,
"colorBackground": false,
"colorValue": true,
"colors": [
"#f9ba8f",
"#e5ac0e",
"#1f78c1"
],
"datasource": "${DS_TELEGRAF}",
"decimals": null,
"format": "percent",
"gauge": {
"maxValue": 100,
"minValue": 0,
"show": true,
"thresholdLabels": false,
"thresholdMarkers": true
},
"gridPos": {
"h": 10,
"w": 7,
"x": 17,
"y": 0
},
"id": 12,
"interval": null,
"links": [],
"mappingType": 1,
"mappingTypes": [
{
"name": "value to text",
"value": 1
},
{
"name": "range to text",
"value": 2
}
],
"maxDataPoints": 100,
"nullPointMode": "connected",
"nullText": null,
"postfix": "",
"postfixFontSize": "50%",
"prefix": "",
"prefixFontSize": "50%",
"rangeMaps": [
{
"from": "null",
"text": "N/A",
"to": "null"
}
],
"sparkline": {
"fillColor": "rgba(31, 118, 189, 0.18)",
"full": false,
"lineColor": "rgb(31, 120, 193)",
"show": false
},
"tableColumn": "",
"targets": [
{
"groupBy": [
{
"params": [
"$__interval"
],
"type": "time"
},
{
"params": [
"null"
],
"type": "fill"
}
],
"orderByTime": "ASC",
"policy": "default",
"query": "SELECT 100-\"usage_idle\" from cpu WHERE $timeFilter fill(null)",
"rawQuery": true,
"refId": "A",
"resultFormat": "time_series",
"select": [
[
{
"params": [
"value"
],
"type": "field"
},
{
"params": [],
"type": "mean"
}
]
],
"tags": []
}
],
"thresholds": "",
"title": "cpu使用率",
"type": "singlestat",
"valueFontSize": "80%",
"valueMaps": [
{
"op": "=",
"text": "N/A",
"value": "null"
}
],
"valueName": "current"
},
{
"aliasColors": {},
"bars": false,
"dashLength": 10,
"dashes": false,
"datasource": "${DS_TELEGRAF}",
"description": "total - 物理内存总大小\n\nused - 已经使用的物理内存大小\n\nfree - 空闲的物理内存\n\nshared - 多个进程共享内存的大小\n\nbuffers/cached - 做为缓存的内存大小,buffer 缓存的是磁盘文件的元数据,例如文件属性、目录结构等等,cache 缓存的是真正的文件内容\n\nswap - 交互空间的使用状态",
"fill": 2,
"gridPos": {
"h": 9,
"w": 12,
"x": 0,
"y": 10
},
"id": 6,
"legend": {
"alignAsTable": true,
"avg": true,
"current": true,
"max": true,
"min": true,
"show": true,
"total": false,
"values": true
},
"lines": true,
"linewidth": 2,
"links": [],
"nullPointMode": "null",
"percentage": false,
"pointradius": 5,
"points": false,
"renderer": "flot",
"seriesOverrides": [],
"spaceLength": 10,
"stack": false,
"steppedLine": false,
"targets": [
{
"groupBy": [
{
"params": [
"$__interval"
],
"type": "time"
},
{
"params": [
"null"
],
"type": "fill"
}
],
"orderByTime": "ASC",
"policy": "default",
"query": "select total/1024/1024 from mem WHERE $timeFilter fill(null)",
"rawQuery": true,
"refId": "A",
"resultFormat": "time_series",
"select": [
[
{
"params": [
"value"
],
"type": "field"
},
{
"params": [],
"type": "mean"
}
]
],
"tags": []
},
{
"groupBy": [
{
"params": [
"$__interval"
],
"type": "time"
},
{
"params": [
"null"
],
"type": "fill"
}
],
"orderByTime": "ASC",
"policy": "default",
"query": "select used/1024/1024 from mem WHERE $timeFilter fill(null)",
"rawQuery": true,
"refId": "B",
"resultFormat": "time_series",
"select": [
[
{
"params": [
"value"
],
"type": "field"
},
{
"params": [],
"type": "mean"
}
]
],
"tags": []
},
{
"groupBy": [
{
"params": [
"$__interval"
],
"type": "time"
},
{
"params": [
"null"
],
"type": "fill"
}
],
"orderByTime": "ASC",
"policy": "default",
"query": "select buffered/1024/1024 from mem WHERE $timeFilter fill(null)",
"rawQuery": true,
"refId": "C",
"resultFormat": "time_series",
"select": [
[
{
"params": [
"value"
],
"type": "field"
},
{
"params": [],
"type": "mean"
}
]
],
"tags": []
},
{
"groupBy": [
{
"params": [
"$__interval"
],
"type": "time"
},
{
"params": [
"null"
],
"type": "fill"
}
],
"orderByTime": "ASC",
"policy": "default",
"query": "select cached/1024/1024 from mem WHERE $timeFilter fill(null)",
"rawQuery": true,
"refId": "D",
"resultFormat": "time_series",
"select": [
[
{
"params": [
"value"
],
"type": "field"
},
{
"params": [],
"type": "mean"
}
]
],
"tags": []
}
],
"thresholds": [],
"timeFrom": null,
"timeShift": null,
"title": "Men内存",
"tooltip": {
"shared": true,
"sort": 0,
"value_type": "individual"
},
"type": "graph",
"xaxis": {
"buckets": null,
"mode": "time",
"name": null,
"show": true,
"values": []
},
"yaxes": [
{
"format": "lengthmi",
"label": null,
"logBase": 1,
"max": null,
"min": null,
"show": true
},
{
"format": "short",
"label": null,
"logBase": 1,
"max": null,
"min": null,
"show": true
}
],
"yaxis": {
"align": false,
"alignLevel": null
}
},
{
"cacheTimeout": null,
"colorBackground": false,
"colorValue": false,
"colors": [
"#d44a3a",
"rgba(40, 129, 237, 0.89)",
"rgb(51, 104, 63)"
],
"datasource": "${DS_TELEGRAF}",
"format": "percent",
"gauge": {
"maxValue": 100,
"minValue": 0,
"show": true,
"thresholdLabels": false,
"thresholdMarkers": true
},
"gridPos": {
"h": 9,
"w": 12,
"x": 12,
"y": 10
},
"id": 8,
"interval": null,
"links": [],
"mappingType": 1,
"mappingTypes": [
{
"name": "value to text",
"value": 1
},
{
"name": "range to text",
"value": 2
}
],
"maxDataPoints": 100,
"nullPointMode": "connected",
"nullText": null,
"postfix": "",
"postfixFontSize": "50%",
"prefix": "",
"prefixFontSize": "50%",
"rangeMaps": [
{
"from": "null",
"text": "N/A",
"to": "null"
}
],
"sparkline": {
"fillColor": "rgba(31, 118, 189, 0.18)",
"full": false,
"lineColor": "rgb(31, 120, 193)",
"show": false
},
"tableColumn": "",
"targets": [
{
"groupBy": [
{
"params": [
"$__interval"
],
"type": "time"
},
{
"params": [
"null"
],
"type": "fill"
}
],
"orderByTime": "ASC",
"policy": "default",
"query": "SELECT used_percent from mem WHERE $timeFilter fill(null)",
"rawQuery": true,
"refId": "A",
"resultFormat": "time_series",
"select": [
[
{
"params": [
"value"
],
"type": "field"
},
{
"params": [],
"type": "mean"
}
]
],
"tags": []
}
],
"thresholds": "",
"title": "内存使用率",
"type": "singlestat",
"valueFontSize": "80%",
"valueMaps": [
{
"op": "=",
"text": "N/A",
"value": "null"
}
],
"valueName": "current"
},
{
"aliasColors": {},
"bars": false,
"dashLength": 10,
"dashes": false,
"datasource": "${DS_TELEGRAF}",
"decimals": null,
"description": "这个读写速率需要后一个点减去前一个点",
"fill": 2,
"gridPos": {
"h": 9,
"w": 12,
"x": 0,
"y": 19
},
"id": 10,
"legend": {
"alignAsTable": true,
"avg": false,
"current": true,
"hideEmpty": false,
"hideZero": false,
"max": true,
"min": true,
"rightSide": false,
"show": true,
"total": false,
"values": true
},
"lines": true,
"linewidth": 2,
"links": [],
"minSpan": 13,
"nullPointMode": "null",
"percentage": false,
"pointradius": 3,
"points": true,
"renderer": "flot",
"repeat": null,
"repeatDirection": "h",
"seriesOverrides": [],
"spaceLength": 10,
"stack": false,
"steppedLine": false,
"targets": [
{
"alias": "reads $tag_name",
"groupBy": [
{
"params": [
"$__interval"
],
"type": "time"
},
{
"params": [
"null"
],
"type": "fill"
}
],
"hide": true,
"orderByTime": "ASC",
"policy": "default",
"query": "select reads from (select \"name\",\"reads\" from diskio WHERE \"name\" =~ /^$disk_name$/ and $timeFilter fill(null)) group by \"name\"",
"rawQuery": true,
"refId": "A",
"resultFormat": "time_series",
"select": [
[
{
"params": [
"value"
],
"type": "field"
},
{
"params": [],
"type": "mean"
}
]
],
"tags": []
},
{
"alias": "writes $tag_name",
"groupBy": [
{
"params": [
"$__interval"
],
"type": "time"
},
{
"params": [
"null"
],
"type": "fill"
}
],
"hide": true,
"orderByTime": "ASC",
"policy": "default",
"query": "select writes from (select \"name\",\"writes\" from diskio WHERE \"name\" =~ /^$disk_name$/ and $timeFilter fill(null)) group by \"name\"",
"rawQuery": true,
"refId": "C",
"resultFormat": "time_series",
"select": [
[
{
"params": [
"value"
],
"type": "field"
},
{
"params": [],
"type": "mean"
}
]
],
"tags": []
},
{
"alias": "write_bytes $tag_name MB/S",
"groupBy": [
{
"params": [
"$__interval"
],
"type": "time"
},
{
"params": [
"null"
],
"type": "fill"
}
],
"hide": false,
"orderByTime": "ASC",
"policy": "default",
"query": "select write_bytes/1024/1024/10 from (select \"name\",\"write_bytes\" from diskio WHERE \"name\" =~ /^$disk_name$/ and $timeFilter fill(null)) group by \"name\"",
"rawQuery": true,
"refId": "D",
"resultFormat": "time_series",
"select": [
[
{
"params": [
"value"
],
"type": "field"
},
{
"params": [],
"type": "mean"
}
]
],
"tags": []
},
{
"alias": "read_bytes $tag_name MB/S",
"groupBy": [
{
"params": [
"$__interval"
],
"type": "time"
},
{
"params": [
"null"
],
"type": "fill"
}
],
"orderByTime": "ASC",
"policy": "default",
"query": "select read_bytes/1024/1024/10 from (select \"name\",\"read_bytes\" from diskio WHERE \"name\" =~ /^$disk_name$/ and $timeFilter fill(null)) group by \"name\"",
"rawQuery": true,
"refId": "E",
"resultFormat": "time_series",
"select": [
[
{
"params": [
"value"
],
"type": "field"
},
{
"params": [],
"type": "mean"
}
]
],
"tags": []
},
{
"groupBy": [
{
"params": [
"$__interval"
],
"type": "time"
},
{
"params": [
"null"
],
"type": "fill"
}
],
"hide": true,
"orderByTime": "ASC",
"policy": "default",
"query": "select reads from (select \"name\",\"reads\" from diskio WHERE $timeFilter fill(null)) group by \"name\"",
"rawQuery": true,
"refId": "F",
"resultFormat": "time_series",
"select": [
[
{
"params": [
"value"
],
"type": "field"
},
{
"params": [],
"type": "mean"
}
]
],
"tags": []
}
],
"thresholds": [],
"timeFrom": null,
"timeShift": null,
"title": "Disk IO",
"tooltip": {
"shared": true,
"sort": 0,
"value_type": "individual"
},
"transparent": false,
"type": "graph",
"xaxis": {
"buckets": null,
"mode": "time",
"name": null,
"show": true,
"values": []
},
"yaxes": [
{
"decimals": null,
"format": "none",
"label": "",
"logBase": 1,
"max": null,
"min": null,
"show": true
},
{
"format": "short",
"label": null,
"logBase": 1,
"max": null,
"min": null,
"show": true
}
],
"yaxis": {
"align": false,
"alignLevel": null
}
},
{
"aliasColors": {},
"bars": false,
"dashLength": 10,
"dashes": false,
"datasource": "${DS_TELEGRAF}",
"description": "xfs是根目录\n\nrootfs是挂载的目录",
"fill": 2,
"gridPos": {
"h": 9,
"w": 12,
"x": 12,
"y": 19
},
"id": 14,
"legend": {
"alignAsTable": true,
"avg": true,
"current": true,
"max": true,
"min": true,
"show": true,
"total": false,
"values": true
},
"lines": true,
"linewidth": 2,
"links": [],
"nullPointMode": "null",
"percentage": false,
"pointradius": 5,
"points": false,
"renderer": "flot",
"seriesOverrides": [],
"spaceLength": 10,
"stack": false,
"steppedLine": false,
"targets": [
{
"alias": "$tag_fstype disk",
"groupBy": [
{
"params": [
"$__interval"
],
"type": "time"
},
{
"params": [
"null"
],
"type": "fill"
}
],
"orderByTime": "ASC",
"policy": "default",
"query": "select used_percent from disk WHERE $timeFilter group by fstype fill(null)",
"rawQuery": true,
"refId": "A",
"resultFormat": "time_series",
"select": [
[
{
"params": [
"value"
],
"type": "field"
},
{
"params": [],
"type": "mean"
}
]
],
"tags": []
}
],
"thresholds": [],
"timeFrom": null,
"timeShift": null,
"title": "磁盘利用率",
"tooltip": {
"shared": true,
"sort": 0,
"value_type": "individual"
},
"type": "graph",
"xaxis": {
"buckets": null,
"mode": "time",
"name": null,
"show": true,
"values": []
},
"yaxes": [
{
"decimals": 0,
"format": "percent",
"label": null,
"logBase": 1,
"max": null,
"min": null,
"show": true
},
{
"format": "short",
"label": null,
"logBase": 1,
"max": null,
"min": null,
"show": true
}
],
"yaxis": {
"align": false,
"alignLevel": null
}
}
],
"refresh": "5s",
"schemaVersion": 16,
"style": "dark",
"tags": [],
"templating": {
"list": [
{
"allValue": null,
"current": {},
"datasource": "${DS_TELEGRAF}",
"hide": 0,
"includeAll": false,
"label": "disk_name",
"multi": false,
"name": "disk_name",
"options": [],
"query": "SHOW TAG VALUES FROM \"diskio\" WITH KEY = \"name\"",
"refresh": 1,
"regex": "",
"sort": 0,
"tagValuesQuery": "",
"tags": [],
"tagsQuery": "",
"type": "query",
"useTags": false
},
{
"allValue": null,
"current": {},
"datasource": "${DS_TELEGRAF}",
"hide": 0,
"includeAll": false,
"label": "cpu_name",
"multi": false,
"name": "cpu_name",
"options": [],
"query": "SHOW TAG VALUES FROM \"cpu\" WITH KEY = \"cpu\"",
"refresh": 1,
"regex": "",
"sort": 0,
"tagValuesQuery": "",
"tags": [],
"tagsQuery": "",
"type": "query",
"useTags": false
}
]
},
"time": {
"from": "now-5m",
"to": "now"
},
"timepicker": {
"refresh_intervals": [
"5s",
"10s",
"30s",
"1m",
"5m",
"15m",
"30m",
"1h",
"2h",
"1d"
],
"time_options": [
"5m",
"15m",
"1h",
"6h",
"12h",
"24h",
"2d",
"7d",
"30d"
]
},
"timezone": "",
"title": "Telegraf",
"uid": "cg08WeKmz",
"version": 18
}

 浙公网安备 33010602011771号