
转:JMeter整合InfluxDB,Grafana让测试结果实时显示
软件版本:
apache-jmeter-2.13.tgz
grafana-2.1.1-1.x86_64.rpm
influxdb-0.8.8-1.x86_64.rpm
虽然官方不在支持influxdb-0.8.8版本了,但是jmeter的文档用的这个版本,所以我也用了这个版本
【重要体会】,玩弄一个新的软件,最好将其日志调整的越丰富越好,这样可以发现很多问题
安装步骤:
安装influxdb
wget https://dl.influxdata.com/influxdb/releases/influxdb-1.1.0.x86_64.rpm
yum localinstall influxdb-1.1.0.x86_64.rpm
修改/opt/influxdb/current/config.toml
[input_plugins.graphite]
enabled = true
address = “192.168.14.135” # If not set, is actually set to bind-address.
port = 2003
database = “jmeter”
然后执行./influxdb -config=config.toml 启动服务器
浏览器执行http://192.168.14.135:8083/ 用户名和密码root:root就可以进入influxdb管理界面,创建Jmeter数据库
安装grafana
wget https://s3-us-west-2.amazonaws.com/grafana-releases/release/grafana-4.2.0-1.x86_64.rpm
yum localinstall grafana-4.2.0-1.x86_64.rpm
systemctl start grafana-server
浏览器指向http://192.168.14.135:3000/ , 默认用户名和密码是admin:admin
按照官方步骤创建一个数据源
创建一个dashboard, home->下拉框->new
选择监控图的标题->编辑->Metrics-Series栏输入jmeter.login.a.max表示我们要监视所有采样(sampler)的最大响应时间
Jmeter 配置:
添加一个Backend Listener 监听器
配置如下:
graphiteHost: graphite服务器的地址,其实指向的是influxdb, 因为inffuxdb有个graphite插件
graphitePort: graphite服务器的端口, 我们在上面的input_plugins.graphite中配置信息
rootMetricsPrefix:前缀”meter.”, 注意”.”是必须的
summaryOnly:false, 统计详细信息
samplersList: 采样器列表, 你添加的sampler的名字,
percentiles:额外的百分比Metrics
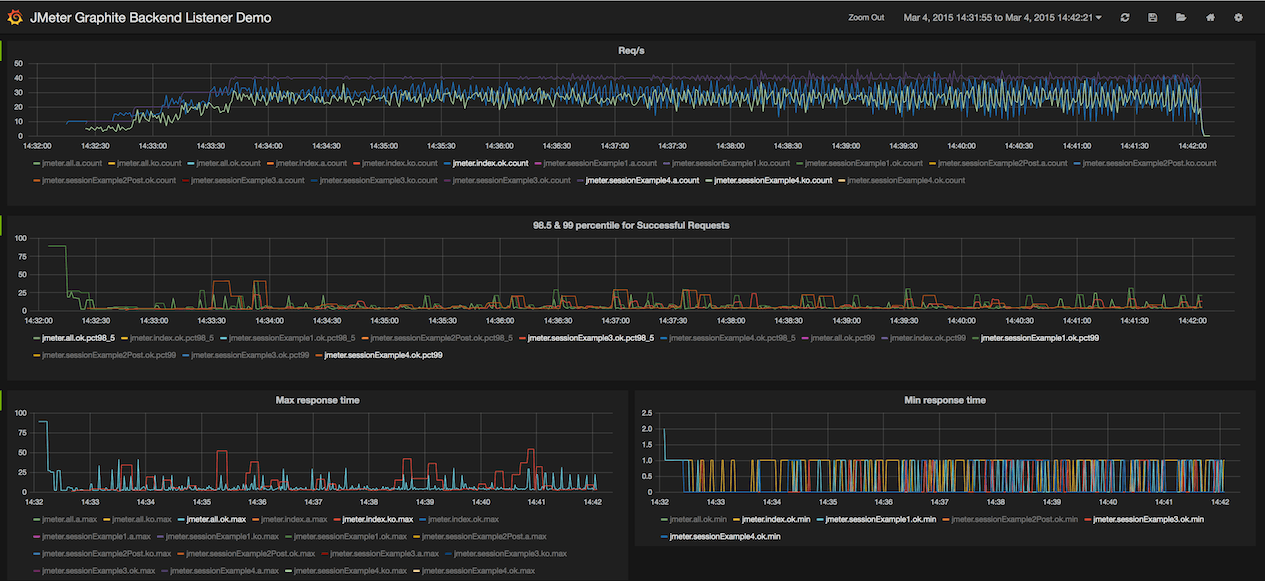
效果图
参考文档:
http://docs.grafana.org/datasources/influxdb/
http://docs.grafana.org/datasources/influxdb/
http://jmeter.apache.org/usermanual/realtime-results.html
原文:http://ju.outofmemory.cn/entry/201105


 浙公网安备 33010602011771号