EFK Stack 日志收集服务部署
EFK Stack 日志收集服务部署
| OS Version | IP | Setting |
|---|---|---|
| CentOS7.9 | 10.0.0.10 | 2C2G |
| CentOS7.9 | 10.0.0.11 | 2C2G |
1:配置主机名
hostnamectl set-hostname es-kibana
hostnamectl set-hostname nginx

2:配置时间同步
yum install -y chrony
systemctl start chronyd
systemctl enable chronyd
chronyc sources -v

3:部署es与kibana
安装java-1.8:
	yum install java-1.8.0-openjdk -y
	java -version
		openjdk version "1.8.0_191"
		OpenJDK Runtime Environment (build 1.8.0_191-b12)
		OpenJDK 64-Bit Server VM (build 25.191-b12, mixed mode)
修改打开文件最大数:
cat << eof>> /etc/sysctl.conf
	vm.max_map_count = 655360
eof
sysctl -p
部署ES:
下载并安装源码包:
wget https://artifacts.elastic.co/downloads/elasticsearch/elasticsearch-6.4.1.rpm
rpm -ivh elasticsearch-6.4.1.rpm

#修改es配置文件
[root@elk-01 ~]# grep '^[a-Z]' /etc/elasticsearch/elasticsearch.yml

cluster.name: elk-cluster          #集群名称
node.name: elk01                   #节点名称
node.master: true                   #当前节点为集群master
node.data: true                 #当前为数据节点
path.data: /var/lib/elasticsearch    #数据存放位置
path.logs: /var/log/elasticsearch   #日志存放位置
network.host: 10.0.0.10         #监听的IP地址
http.port: 9200                 #监听的端口
discovery.zen.ping.unicast.hosts: ["elk01"]  #集群节点的主机名或IP地址

启动ES服务:
systemctl start elasticsearch.service
systemctl enable elasticsearch.service

查看ES进程:(有进程启动成功,没进程启动失败)
[root@es-kibana ~]# ps -ef |grep elasticsearch
elastic+   1532      1 35 01:58 ?        00:00:43 /bin/java -Xms1g -Xmx1g -XX:+UseConcMarkSweepGC -XX:CMSInitiatingOccupancyFraction=75 -XX:+UseCMSInitiatingOccupancyOnly -XX:+AlwaysPreTouch -Xss1m -Djava.awt.headless=true -Dfile.encoding=UTF-8 -Djna.nosys=true -XX:-OmitStackTraceInFastThrow -Dio.netty.noUnsafe=true -Dio.netty.noKeySetOptimization=true -Dio.netty.recycler.maxCapacityPerThread=0 -Dlog4j.shutdownHookEnabled=false -Dlog4j2.disable.jmx=true -Djava.io.tmpdir=/tmp/elasticsearch.BckwQulr -XX:+HeapDumpOnOutOfMemoryError -XX:HeapDumpPath=/var/lib/elasticsearch -XX:ErrorFile=/var/log/elasticsearch/hs_err_pid%p.log -XX:+PrintGCDetails -XX:+PrintGCDateStamps -XX:+PrintTenuringDistribution -XX:+PrintGCApplicationStoppedTime -Xloggc:/var/log/elasticsearch/gc.log -XX:+UseGCLogFileRotation -XX:NumberOfGCLogFiles=32 -XX:GCLogFileSize=64m -Des.path.home=/usr/share/elasticsearch -Des.path.conf=/etc/elasticsearch -Des.distribution.flavor=default -Des.distribution.type=rpm -cp /usr/share/elasticsearch/lib/* org.elasticsearch.bootstrap.Elasticsearch -p /var/run/elasticsearch/elasticsearch.pid --quiet
elastic+   1605   1532  0 01:58 ?        00:00:00 /usr/share/elasticsearch/modules/x-pack-ml/platform/linux-x86_64/bin/controller
root       1631   1429  0 02:00 pts/0    00:00:00 grep --color=auto elasticsearch
[root@es-kibana ~]# ss -lnt | grep 9200
LISTEN     0      128     [::ffff:10.0.0.10]:9200                  [::]:*

查看集群状态:"status" : "green",则正常
[root@es-kibana ~]# curl '10.0.0.10:9200/_cluster/health?pretty'
{
  "cluster_name" : "elk-cluster",
  "status" : "green",
  "timed_out" : false,
  "number_of_nodes" : 1,
  "number_of_data_nodes" : 1,
  "active_primary_shards" : 0,
  "active_shards" : 0,
  "relocating_shards" : 0,
  "initializing_shards" : 0,
  "unassigned_shards" : 0,
  "delayed_unassigned_shards" : 0,
  "number_of_pending_tasks" : 0,
  "number_of_in_flight_fetch" : 0,
  "task_max_waiting_in_queue_millis" : 0,
  "active_shards_percent_as_number" : 100.0
}

报错解决:
如果状态是yellow
curl -H "Content-Type: application/json" -XPUT 'http://10.0.0.10:9200/_settings' -d '
{
    "index" : {
        "number_of_replicas" : 0
    }
}'
部署Kibana
下载并安装源码包:
wget https://artifacts.elastic.co/downloads/kibana/kibana-6.4.1-x86_64.rpm
rpm -ivh kibana-6.4.1-x86_64.rpm

KA配置:
#默认日志存放在系统日志
grep '^[a-Z]' /etc/kibana/kibana.yml

server.port: 5601                               #kibana监听的端口
server.host: "10.0.0.10"                      #kibana监听的IP地址
elasticsearch.url: "http://10.0.0.10:9200"        #kibana连接ES集群master节点地址

启动KA:
systemctl start kibana.service
systemctl enable kibana.service、
[root@es-kibana ~]# ss -lnt | grep 5601
LISTEN     0      128    10.0.0.10:5601                     *:*
部署FileBeats
部署FB:(在nginx机器上部署)
下载并安装源码包:
wget https://artifacts.elastic.co/downloads/beats/filebeat/filebeat-6.4.1-x86_64.rpm
rpm -ivh filebeat-6.4.1-x86_64.rpm

部署nginx
yum install -y nginx

FB配置:
#本地连接终端显示日志
egrep -v '^$|#' /etc/filebeat/filebeat.yml

#输出到elasticsearch,并指定ES的地址与端口
egrep -v '^$|#' /etc/filebeat/filebeat.yml

filebeat.inputs:
- type: log
  enabled: true
  paths:
    - /var/log/nginx/*.log
filebeat.config.modules:
  path: ${path.config}/modules.d/*.yml
  reload.enabled: false
setup.template.settings:
  index.number_of_shards: 3
setup.kibana:
output.elasticsearch:
  hosts: ["10.0.0.10:9200"]

 老A
发表于:2020-2-26 12:19:271378次点击
关注
发送私信
您没有权限发布私信
部署EFK收集Nginx日志(filebeat连接elasticsearch)
时间同步:

yum -y install ntpdate
ntpdate ntp1.aliyun.com
安装java-1.8:

yum install java-1.8.0-openjdk -y
java -version

openjdk version "1.8.0_191"
OpenJDK Runtime Environment (build 1.8.0_191-b12)
OpenJDK 64-Bit Server VM (build 25.191-b12, mixed mode)
修改打开文件最大数:

vim /etc/sysctl.conf

vm.max_map_count = 655360
sysctl -p

部署ES:
下载并安装源码包:
wget https://artifacts.elastic.co/downloads/elasticsearch/elasticsearch-6.4.1.rpm
rpm -ivh elasticsearch-6.4.1.rpm

#修改es配置文件
[root@elk-01 ~]# grep '^[a-Z]' /etc/elasticsearch/elasticsearch.yml

cluster.name: olda-cluster          #集群名称
node.name: elk-01                   #节点名称
node.master: true                   #当前节点为集群master
node.data: true                 #当前为数据节点
path.data: /var/lib/elasticsearch    #数据存放位置
path.logs: /var/log/elasticsearch   #日志存放位置
network.host: 10.0.0.10         #监听的IP地址
http.port: 9200                 #监听的端口
discovery.zen.ping.unicast.hosts: ["elk-01"]  #集群节点的主机名或IP地址
启动ES服务:
systemctl start elasticsearch.service
systemctl enable elasticsearch.service

查看ES进程:(有进程启动成功,没进程启动失败)
ps -ef |grep elasticsearch


查看集群状态:
curl '10.0.0.10:9200/_cluster/health?pretty'


报错解决:
如果状态是yellow

curl -H "Content-Type: application/json" -XPUT 'http://10.0.0.10:9200/_settings' -d '
{
    "index" : {
        "number_of_replicas" : 0
    }
}'
部署KA:
下载并安装源码包:
wget https://artifacts.elastic.co/downloads/kibana/kibana-6.4.1-x86_64.rpm
rpm -ivh kibana-6.4.1-x86_64.rpm

KA配置:

#默认日志存放在系统日志
grep '^[a-Z]' /etc/kibana/kibana.yml

server.port: 5601                               #kibana监听的端口
server.host: "10.0.0.10"                      #kibana监听的IP地址
elasticsearch.url: "http://10.0.0.10:9200"        #kibana连接ES集群master节点地址
启动KA:
systemctl start kibana.service
systemctl enable kibana.service

查看端口:

访问测试:

部署FB:
下载并安装源码包:
https://artifacts.elastic.co/downloads/beats/filebeat/filebeat-6.4.1-x86_64.rpm
rpm -ivh filebeat-6.4.1-x86_64.rpm

FB配置:

#本地连接终端显示日志
egrep -v '^$|#' /etc/filebeat/filebeat.yml

filebeat.inputs:
- type: log
  enabled: true
  paths:
#这里定义的是收集那个日志文件
    - /var/log/messages
filebeat.config.modules:
  path: ${path.config}/modules.d/*.yml
  reload.enabled: false
setup.template.settings:
  index.number_of_shards: 3
setup.kibana:
#定义推送到那个终端,这里是终端控制台,正式配置是推送到ES服务
output.console:
  enable: true
前台启动测试是否可收集日志:
/usr/share/filebeat/bin/filebeat -c /etc/filebeat/filebeat.yml


正式配置输出到ES分析日志:

#把输出到console改为elasticsearch,并指定ES的地址与端口
egrep -v '^$|#' /etc/filebeat/filebeat.yml

filebeat.inputs:
- type: log
  enabled: true
  paths:
    - /var/log/messages
filebeat.config.modules:
  path: ${path.config}/modules.d/*.yml
  reload.enabled: false
setup.template.settings:
  index.number_of_shards: 3
setup.kibana:
output.elasticsearch:
  hosts: ["10.0.0.10:9200"]


启动FB:
systemctl start filebeat.service
systemctl enable filebeat.service

FB日志:
tail -f /var/log/filebeat/filebeat

查看FB是否收集日志:
[root@nginx ~]# curl '10.0.0.10:9200/_cat/indices?v'
health status index                     uuid                   pri rep docs.count docs.deleted store.size pri.store.size
yellow open   filebeat-6.4.1-2021.12.27 t2mdNzykSwK9sDTUOjvoWw   3   1        101            0     29.5kb         29.5kb
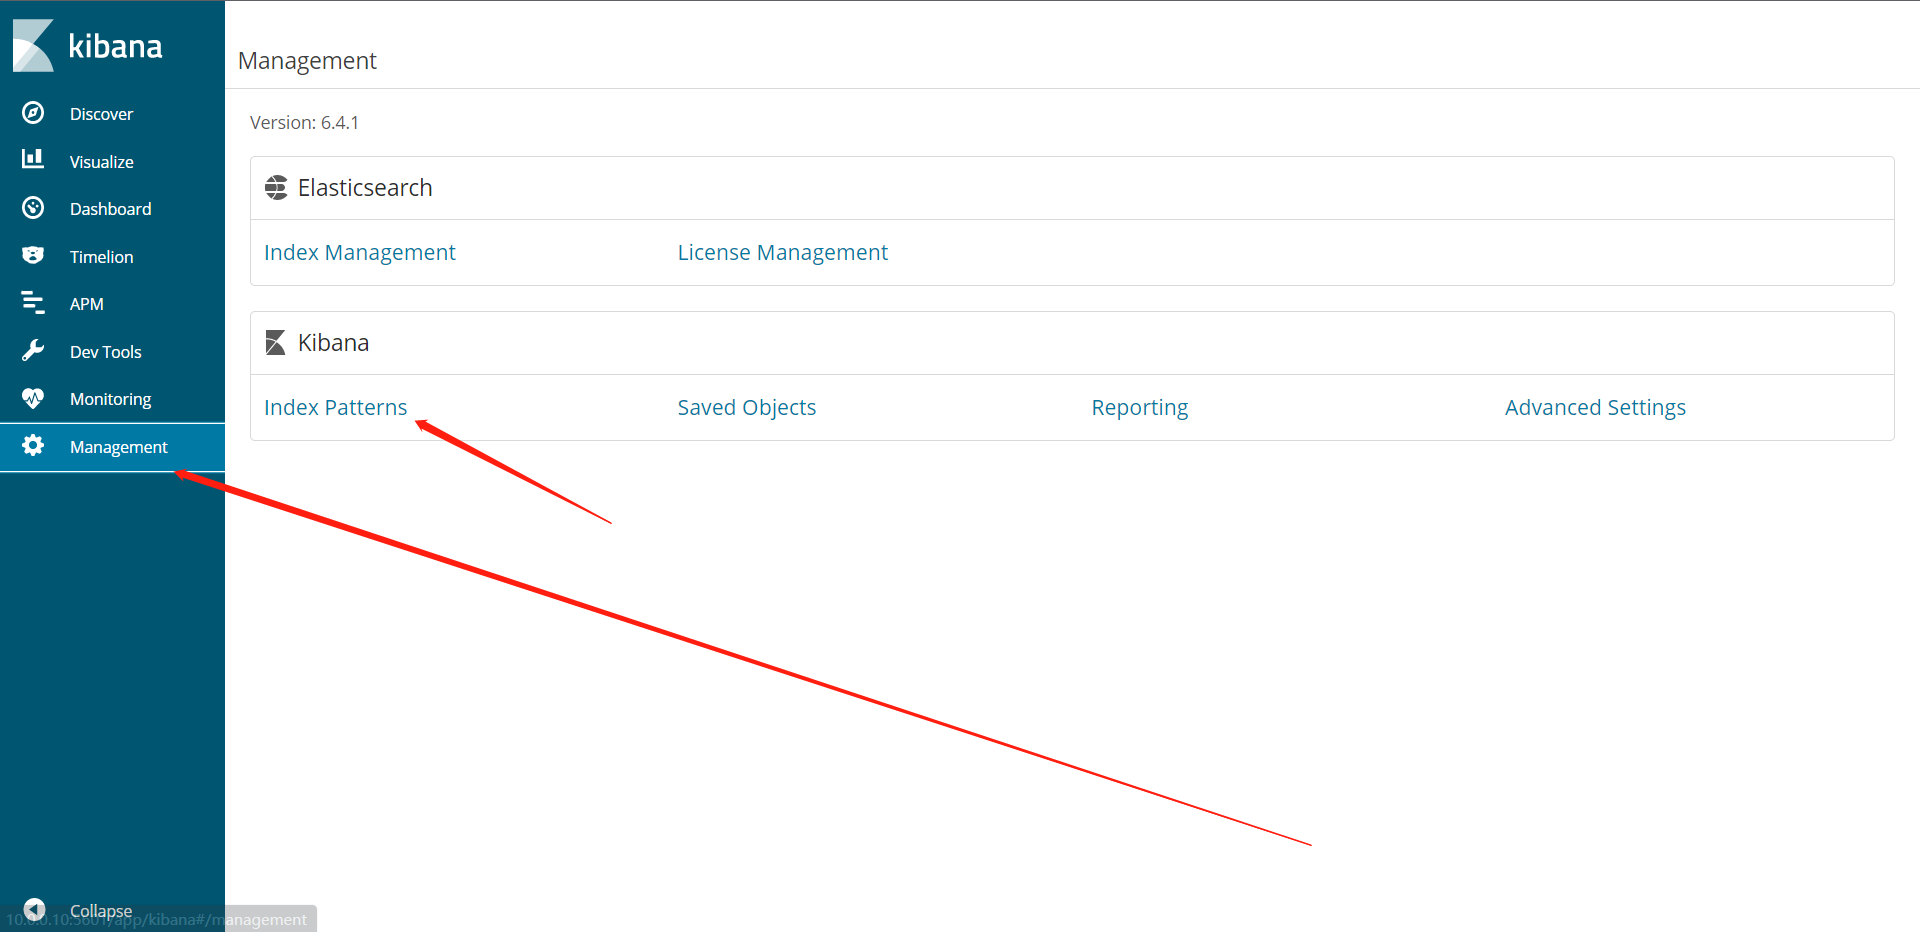
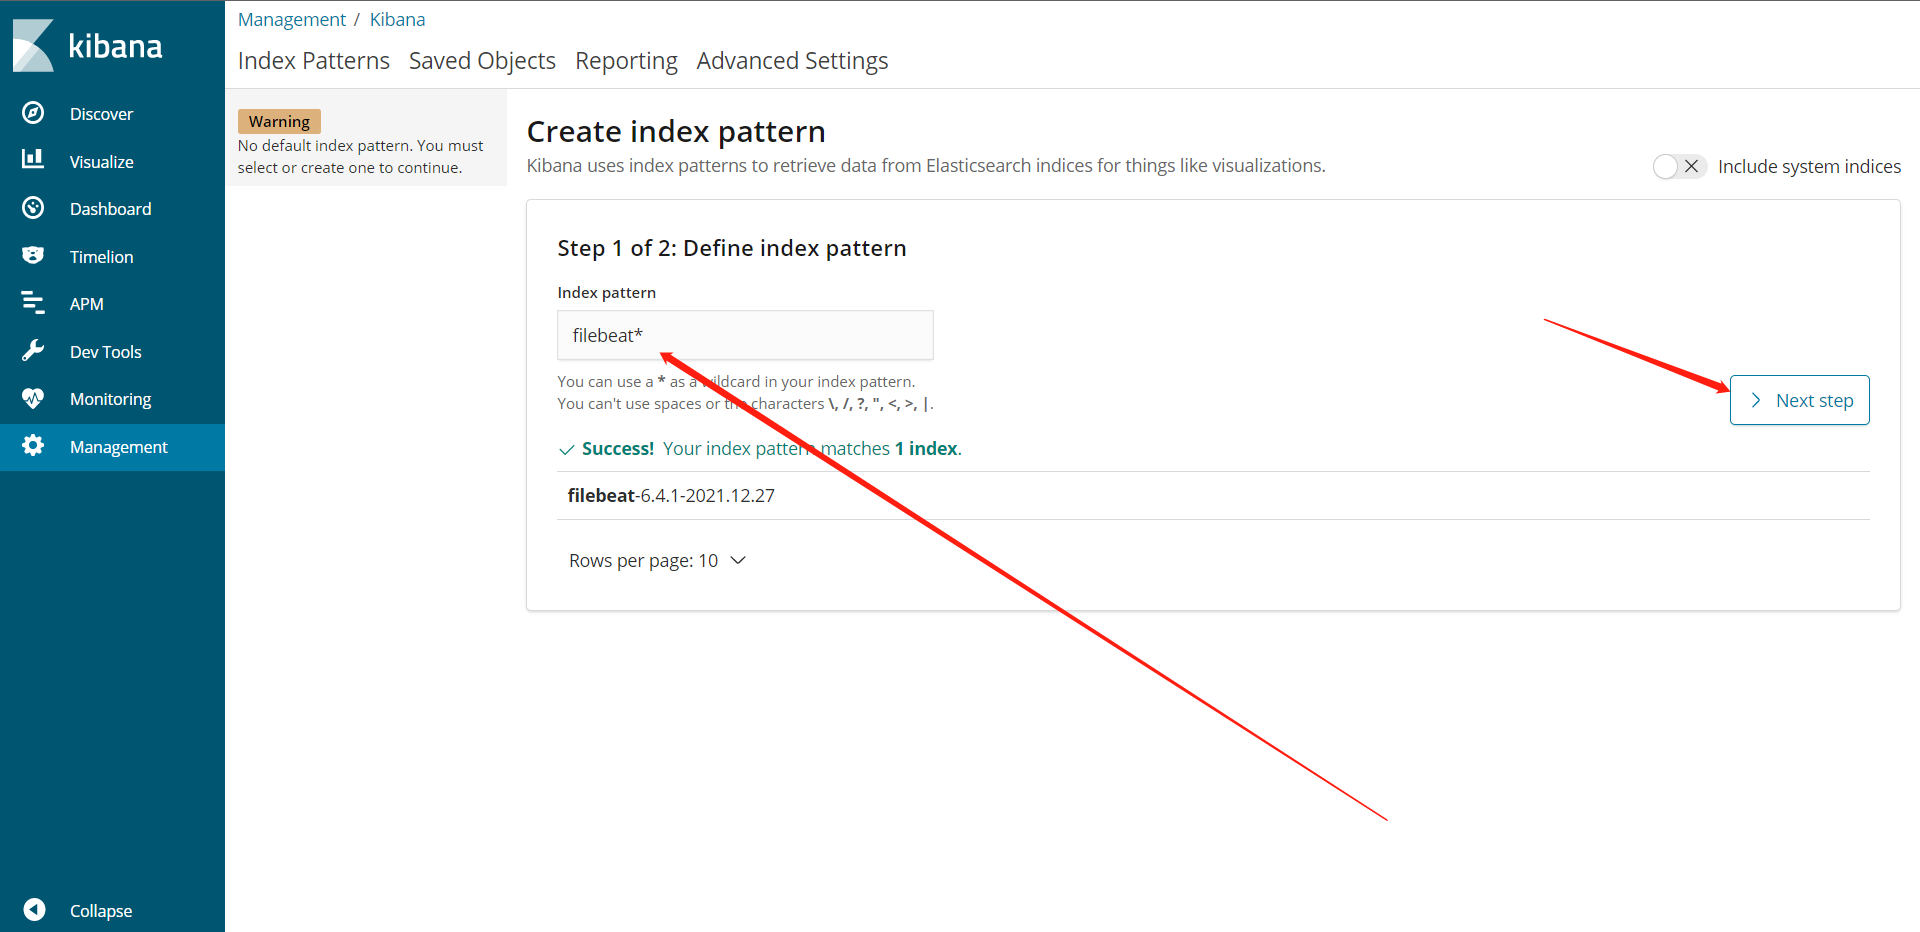
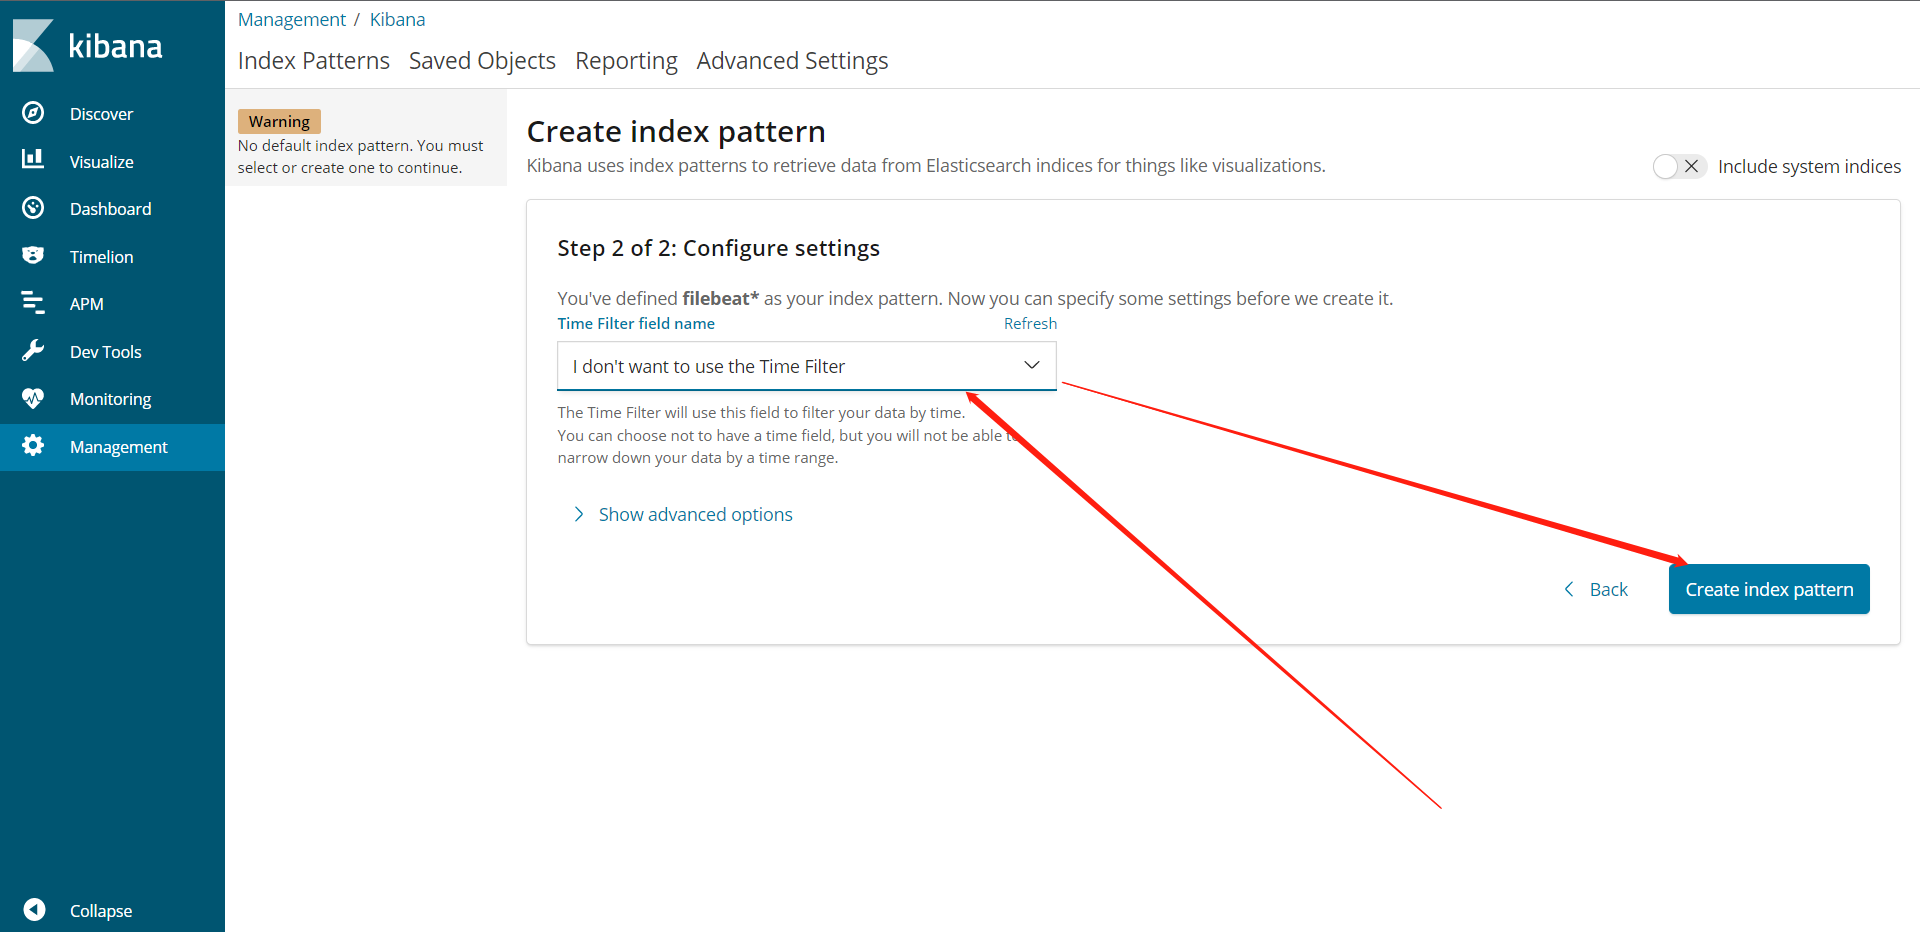
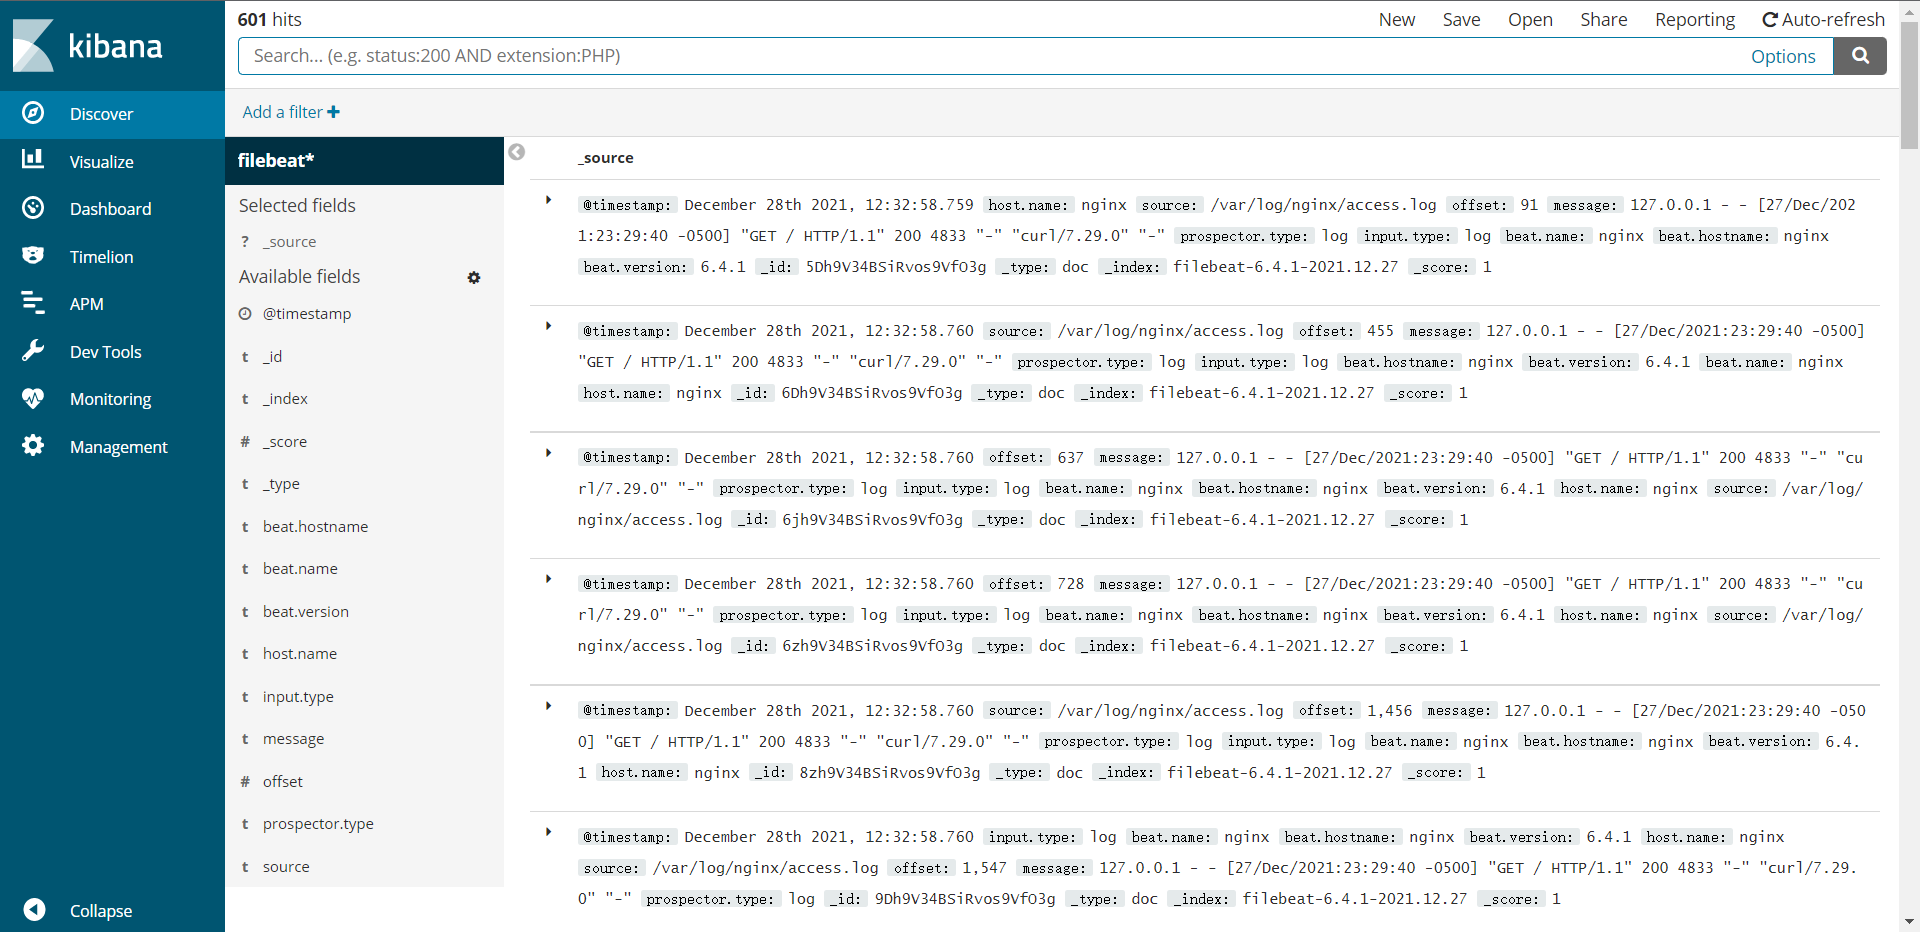
配置KA展示日志

 浙公网安备 33010602011771号