
🎯 Prometheus 核心概念 及 安装部署
官方链接:
https://prometheus.io/docs/introduction/overview/#architecture
一、Prometheus 是什么?解决什么问题?
1️⃣ 一句话理解
Prometheus 是一个“监控 + 时序数据库 + 查询语言 + 告警”的一体化系统
它主要用来回答这些问题:
-
服务器现在健康吗?
-
CPU / 内存 / 磁盘 / QPS / 延迟怎么样?
-
某个服务是不是越来越慢?
-
出问题前发生了什么?
-
什么时候该报警?
2️⃣ Prometheus 的核心特点(先有整体印象)
-
开源(CNCF 项目,和 Kubernetes 是一伙的)
-
Pull 拉取模型(主动去“抓”指标)
-
时间序列数据(指标随时间变化)
-
强大的查询语言 PromQL
-
天然适配云原生 / 容器 / K8s
3️⃣ Prometheus 的典型使用场景
-
服务器监控(CPU / 内存 / 磁盘 / 网络)
-
应用监控(接口 QPS、延迟、错误率)
-
容器 & Kubernetes 监控
-
告警(服务异常、资源耗尽)
二、Prometheus 的整体架构(非常重要)
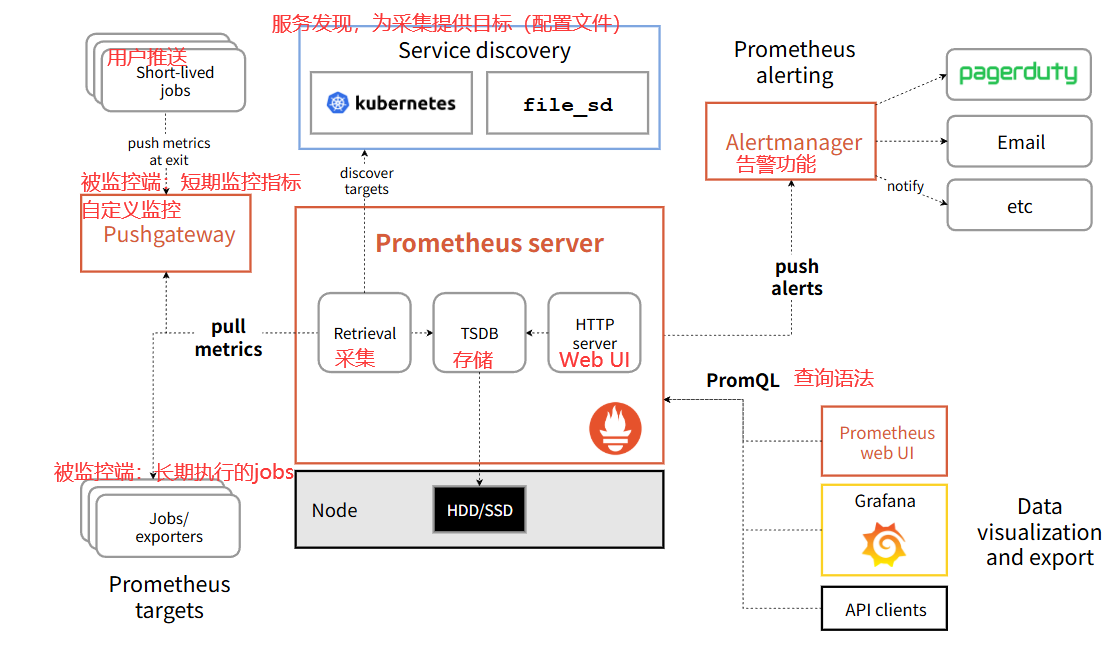
核心组件说明
# Prometheus Server:
  负责数据采集、存储和查询。Prometheus Server使用Pull模型从配置的目标抓取数据。它保存时间序列数据并提供查询接口。
# Exporter:
  用于将应用程序的内部指标暴露为Prometheus可以抓取的格式。Exporter有很多预构建的版本(如node_exporter用于系统级别的指标,blackbox_exporter用于服务可用性监测),也可以为自定义应用编写自己的Exporter。
# Alertmanager:
  用于处理Prometheus生成的警报,支持警报的分组、抑制和通知。Alertmanager可以将警报发送到电子邮件、Slack、PagerDuty等通知渠道。
# Pushgateway:
  用于接收短期批处理作业的指标,适用于无法由Prometheus Server直接抓取的情况。Pushgateway将这些指标推送到Prometheus Server。
# Grafana:
  虽然不是Prometheus的原生组件,但Grafana经常与Prometheus配合使用,用于可视化和分析数据。Grafana提供丰富的仪表板和图表功能,可以与Prometheus的查询语言无缝集成。


# 推荐阅读:
    云原生CNCF官网:
        https://landscape.cncf.io/

    Prometheus的GitHub地址:
        https://github.com/prometheus/prometheus

    Prometheus的官网地址:
        https://prometheus.io/
三、Prometheus 核心概念(重点中的重点)
1️⃣ 什么是指标(Metric)?
指标 = 某个值随时间变化的记录
# 指标示例
http_requests_total{method="POST", handler="/api", status="200"} 1024
      ↑                ↑     ↑       ↑        ↑               ↑   ↑
   指标名称         标签名称  标签值  标签名称   标签值            结束  指标值
关键特性:
-
指标名称:描述监控的内容(如:cpu_usage、memory_free)
-
标签(Labels):提供多维度的分类
-
时间戳:每个数据点都有关联的时间戳
-
值:数值类型的测量结果
2️⃣ 时间序列(Time Series)
Prometheus 存的是时间序列数据:
指标名 + 标签 = 一条时间序列
例如:
http_requests_total{method="GET", status="200"}
这是一条序列:
(t1, 100)
(t2, 120)
(t3, 150)
3️⃣ Metric Name(指标名)
- 只能是字母、数字、下划线
- 建议有明确含义
常见例子:
| 指标名 | 含义 |
|---|---|
| cpu_usage_seconds_total | CPU 使用时间 |
| node_memory_MemAvailable_bytes | 可用内存 |
| http_requests_total | HTTP 请求总数 |
4️⃣ Label(标签)——Prometheus 的灵魂
标签 = 维度
http_requests_total{
  method="GET",
  status="200",
  instance="10.0.0.1:8080"
}
标签可以帮你:
- 区分不同实例
- 区分接口 / 状态码 / 服务
⚠️ 重要原则:
- 标签不是越多越好
- 高基数标签(如 user_id)会炸库 ❌
5️⃣ Metric 类型(四种)
1. Counter(计数器)
# 只增不减,适合累计值
http_requests_total{method="GET"} 1500
http_requests_total{method="POST"} 800
# 使用rate()计算增长率
rate(http_requests_total[5m])  # 过去5分钟每秒请求数
2. Gauge(仪表盘)
# 可增可减,反映当前状态
memory_usage_bytes 536870912  # 当前内存使用量
cpu_temperature 65.2          # 当前CPU温度
3. Histogram(直方图)
# 统计数据分布,自动生成多个指标
# 原始指标
http_request_duration_seconds_bucket{le="0.1"} 100
http_request_duration_seconds_bucket{le="0.5"} 300
http_request_duration_seconds_bucket{le="1.0"} 350
http_request_duration_seconds_bucket{le="+Inf"} 400
http_request_duration_seconds_sum 150.2
http_request_duration_seconds_count 400

# 计算95分位响应时间
histogram_quantile(0.95,
  rate(http_request_duration_seconds_bucket[5m])
)
4. Summary(摘要)
# 客户端计算分位数,更精确但消耗资源
rpc_duration_seconds{quantile="0.5"} 0.03
rpc_duration_seconds{quantile="0.9"} 0.08
rpc_duration_seconds{quantile="0.99"} 0.12
rpc_duration_seconds_sum 45.6
rpc_duration_seconds_count 1200
6️⃣ Exporter 是什么?
Prometheus 不会“魔法读取系统指标”,它需要 Exporter。
| Exporter | 用途 |
|---|---|
| node_exporter | 服务器指标 |
| mysql_exporter | MySQL |
| redis_exporter | Redis |
| jmx_exporter | Java |
| blackbox_exporter | 探测(HTTP / TCP) |
👉 Exporter 本质就是一个 HTTP 服务,暴露 /metrics
7️⃣ 数据抓取流程
抓取周期开始
    ↓
通过服务发现获取目标列表
    ↓
对每个目标发起HTTP请求
    ↓
目标返回metrics数据(通常是/metrics端点)
    ↓
解析数据并存入时间序列数据库
    ↓
等待下一个抓取周期
8️⃣服务发现机制
# 静态配置示例
static_configs:
  - targets:
    - 192.168.1.100:9100  # Node Exporter
    - 192.168.1.101:9090  # 另一个Prometheus
支持的发现方式:
- 静态配置
- 文件发现
- DNS发现
- Kubernetes发现
- Consul发现
- EC2发现
- Azure发现
四、Prometheus 的工作流程(一步步)
1️⃣ 应用 / 系统通过 Exporter 暴露 /metrics
2️⃣ Prometheus 定时 拉取(scrape)
3️⃣ 数据存入本地 TSDB
4️⃣ 通过 PromQL 查询
5️⃣ Grafana 展示
6️⃣ 触发告警 → Alertmanager
五、Prometheus 安装部署(单机入门版)
目标:10 分钟跑起来
1️⃣ 安装 Prometheus(Linux)
① 下载
wget https://github.com/prometheus/prometheus/releases/download/v2.48.0/prometheus-2.48.0.linux-amd64.tar.gz
② 解压
tar -zxvf prometheus-2.48.0.linux-amd64.tar.gz
cd prometheus-2.48.0.linux-amd64
2️⃣ 核心目录说明
prometheus
├── prometheus        # 主程序
├── promtool          # 配置校验工具
├── prometheus.yml    # 核心配置文件
├── data/             # 本地数据存储
3️⃣ Prometheus 配置文件详解(prometheus.yml)
# prometheus.yml - 完整示例
# 全局配置
global:
  scrape_interval: 15s      # 抓取间隔,默认15秒
  evaluation_interval: 15s  # 规则评估间隔
  # scrape_timeout: 10s     # 抓取超时时间(默认10秒)

# 告警配置(如果使用Alertmanager)
alerting:
  alertmanagers:
    - static_configs:
        - targets:
          # - alertmanager:9093  # Alertmanager地址

# 规则文件(告警和记录规则)
rule_files:
  # - "first_rules.yml"
  # - "second_rules.yml"

# 抓取配置
scrape_configs:
  # 监控Prometheus自身
  - job_name: 'prometheus'
    static_configs:
      - targets: ['localhost:9090']
        labels:
          service: 'prometheus'
          group: 'monitoring'

  # 监控Linux服务器(需要安装Node Exporter)
  - job_name: 'node'  # 任务名
    static_configs:
      - targets: ['localhost:9100']   # 要抓的地址
        labels:
          service: 'node-exporter'
          group: 'servers'
    # 抓取配置示例
    scrape_interval: 30s  # 覆盖全局配置
    metrics_path: /metrics  # 默认就是/metrics
    # 可添加认证信息
    # basic_auth:
    #   username: 'admin'
    #   password: 'secret'
4️⃣ 启动 Prometheus
# 1. 命令启动
./prometheus --config.file=prometheus.yml

# 2.systemd
tee /etc/systemd/system/prometheus.service << 'EOF'
[Unit]
Description=Prometheus Monitoring System
Documentation=https://prometheus.io/docs/introduction/overview/
After=network.target

[Service]
Type=simple
User=root
Group=root
WorkingDirectory=/app/prometheus-3.5.0
ExecStart=/app/prometheus-3.5.0/prometheus \  # 主程序路径
  --config.file=/app/prometheus-3.5.0/prometheus.yml \      # 配置文件
  --storage.tsdb.path=/app/prometheus-3.5.0/data \          # 数据存储路径
  --web.listen-address=0.0.0.0:9090 \                       # Web监听地址
  --web.enable-lifecycle \                                  # 启用生命周期API
  --storage.tsdb.retention.time=15d \                       # 数据保留时间
  --log.level=info                                          # 日志级别
ExecReload=/bin/kill -HUP $MAINPID
Restart=on-failure
RestartSec=10s

[Install]
WantedBy=multi-user.target
EOF

 应用配置
sudo systemctl daemon-reload
sudo systemctl restart prometheus
访问:
http://localhost:9090
🎉 你已经成功启动 Prometheus!
六、安装 Node Exporter(监控服务器)
1️⃣ 下载 & 启动
>官网:https://prometheus.io/download/#node_exporter
  # 1.下载
  wget https://github.com/prometheus/node_exporter/releases/download/v1.8.2/node_exporter-1.8.2.linux-amd64.tar.gz
  # 2.解压
  tar  xf
  # 3.安装
  ./node_exporter-xxxxxx
  # 4.其他节点安装node exporter
  依照上面步骤
  # 5.访问WebUI验证
  http://localhost:9100/metrics
2️⃣ 配置 Prometheus 抓 Node Exporter
 1. 修改配置文件  vim prometheus.yml # 注意yaml格式
    scrape_configs:
        ...
      - job_name: "node-elk"
        static_configs:
      - targets: ["10.0.0.91:9100","10.0.0.92:9100","10.0.0.93:9100"]

2.检查配置文件语法
  [root@study /app/prometheus-3.5.0]# ./promtool check config prometheus.yml
  Checking prometheus.yml
   SUCCESS: prometheus.yml is valid prometheus config file syntax

3.热重载配置(无需重启)
  # 方法1:发送SIGHUP信号(如果未启用lifecycle)
  sudo killall -HUP prometheus

  # 方法2:使用API(需要启用--web.enable-lifecycle)
  curl -X POST http://localhost:9090/-/reload

  # 方法3:使用promtool检查配置
  promtool check config /etc/prometheus/prometheus.yml

4.访问WebUI验证
  http://10.0.0.91:9090/targets

5.配置别名 (可选)
   vim ~/.bashrc
...
 84 alias yy='egrep -v "^.*#|^$"'
 85 alias check='/app/prometheus-3.5.0/promtool  check config /app/prometheus-3.5.0/prometheus.yml'
 86 alias rr='curl -X POST http://10.0.0.91:9090/-/reload'
...

 [root@study]# source ~/.bashrc
 [root@study]# check
 [root@study]# rr

 浙公网安备 33010602011771号