

《DSP using MATLAB》Problem 3.18
代码:
%% ------------------------------------------------------------------------
%% Output Info about this m-file
fprintf('\n***********************************************************\n');
fprintf(' <DSP using MATLAB> Problem 3.18 \n\n');
banner();
%% ------------------------------------------------------------------------
%% -------------------------------------------------------------------
%% y(n)=x(n)+x(n-2)+x(n-4)+x(n-6)
%% -0.81y(n-2)-0.81*0.81y(n-4)-0.81^3*y(n-6)
%% -------------------------------------------------------------------
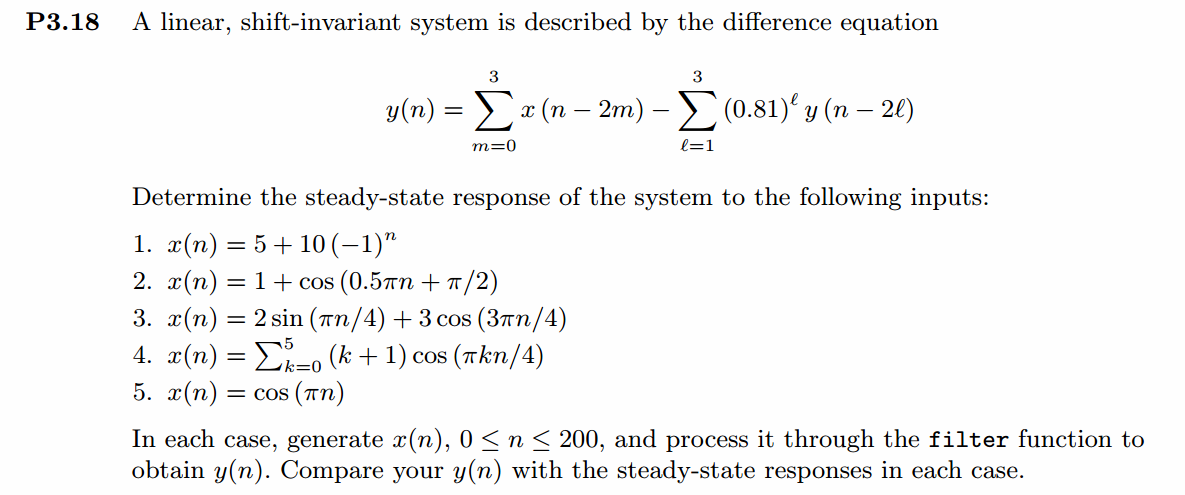
a = [1, 0, 0.81, 0, 0.81^2, 0, 0.81^3]; % filter coefficient array a
b = [1, 0, 1, 0, 1, 0, 1]; % filter coefficient array b
MM = 500;
[H, w] = freqresp1(b, a, MM);
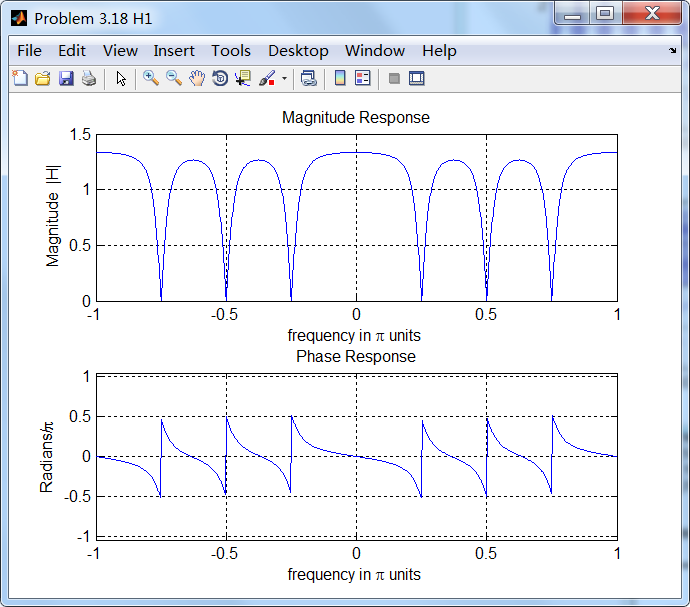
magH = abs(H); angH = angle(H); realH = real(H); imagH = imag(H);
%% --------------------------------------------------------------------
%% START H's mag ang real imag
%% --------------------------------------------------------------------
figure('NumberTitle', 'off', 'Name', 'Problem 3.18 H1');
set(gcf,'Color','white');
subplot(2,1,1); plot(w/pi,magH); grid on; %axis([-1,1,0,1.05]);
title('Magnitude Response');
xlabel('frequency in \pi units'); ylabel('Magnitude |H|');
subplot(2,1,2); plot(w/pi, angH/pi); grid on; axis([-1,1,-1.05,1.05]);
title('Phase Response');
xlabel('frequency in \pi units'); ylabel('Radians/\pi');
figure('NumberTitle', 'off', 'Name', 'Problem 3.18 H1');
set(gcf,'Color','white');
subplot(2,1,1); plot(w/pi, realH); grid on;
title('Real Part');
xlabel('frequency in \pi units'); ylabel('Real');
subplot(2,1,2); plot(w/pi, imagH); grid on;
title('Imaginary Part');
xlabel('frequency in \pi units'); ylabel('Imaginary');
%% -------------------------------------------------------------------
%% END X's mag ang real imag
%% -------------------------------------------------------------------
%% --------------------------------------------------
%% x1(n)=5+10*(-1)^n
%% --------------------------------------------------
M = 200;
n1 = [0:M];
x1 = 5 + 10*(-1).^n1;
y1 = filter(b, a, x1);
figure('NumberTitle', 'off', 'Name', sprintf('Problem 3.18.1 M = %d',M));
set(gcf,'Color','white');
subplot(2,1,1);
stem(n1, x1);
xlabel('n'); ylabel('x1');
title(sprintf('x1(n) input sequence, M = %d', M)); grid on;
subplot(2,1,2);
stem(n1, y1);
xlabel('n'); ylabel('y1');
title(sprintf('y1(n) output sequence, M = %d', M)); grid on;
%% --------------------------------------------------
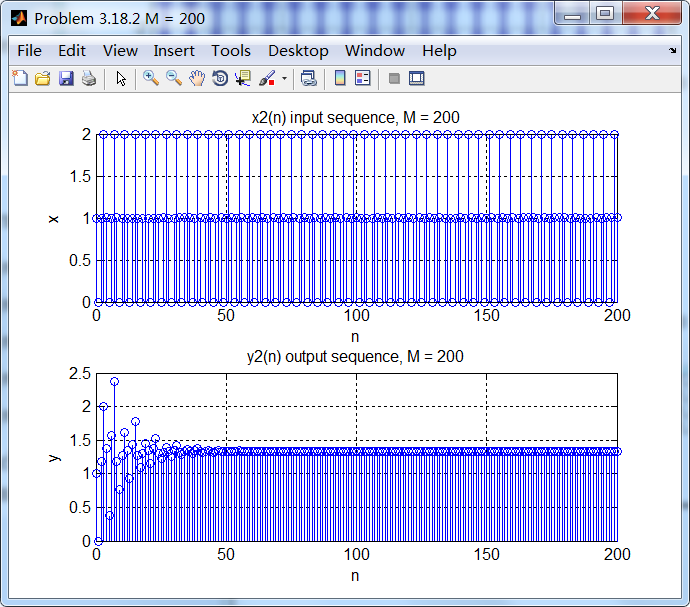
%% x2(n)=1+cos(0.5pin+pi/2)
%% --------------------------------------------------
n2 = n1;
x2 = 1 + cos(0.5*pi*n2+pi/2);
y2 = filter(b, a, x2);
figure('NumberTitle', 'off', 'Name', sprintf('Problem 3.18.2 M = %d',M));
set(gcf,'Color','white');
subplot(2,1,1);
stem(n2, x2);
xlabel('n'); ylabel('x');
title(sprintf('x2(n) input sequence, M = %d', M)); grid on;
subplot(2,1,2);
stem(n2, y2);
xlabel('n'); ylabel('y');
title(sprintf('y2(n) output sequence, M = %d', M)); grid on;
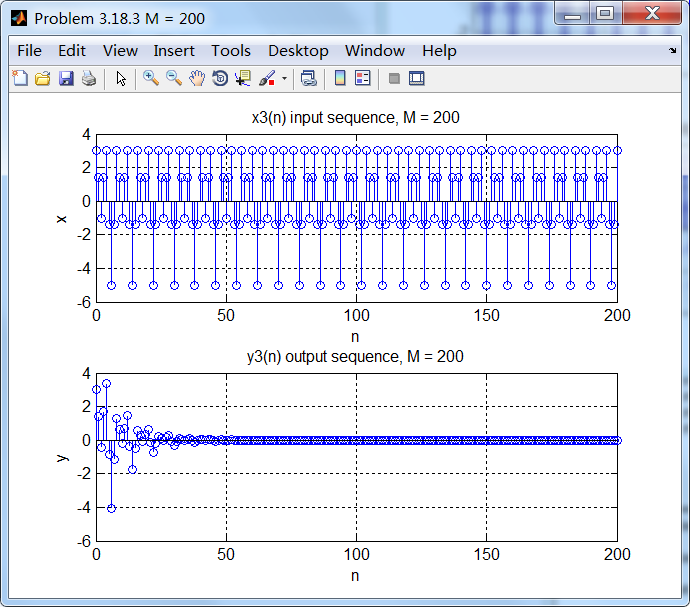
%% --------------------------------------------------
%% x3(n)=2sin(pin/4) + 3cos(3pin/4)
%% --------------------------------------------------
n3 = n1;
x3 = 2*sin(pi*n3/4) + 3*cos(3*pi*n3/2);
y3 = filter(b, a, x3);
figure('NumberTitle', 'off', 'Name', sprintf('Problem 3.18.3 M = %d',M));
set(gcf,'Color','white');
subplot(2,1,1);
stem(n3, x3);
xlabel('n'); ylabel('x');
title(sprintf('x3(n) input sequence, M = %d', M)); grid on;
subplot(2,1,2);
stem(n3, y3);
xlabel('n'); ylabel('y');
title(sprintf('y3(n) output sequence, M = %d', M)); grid on;
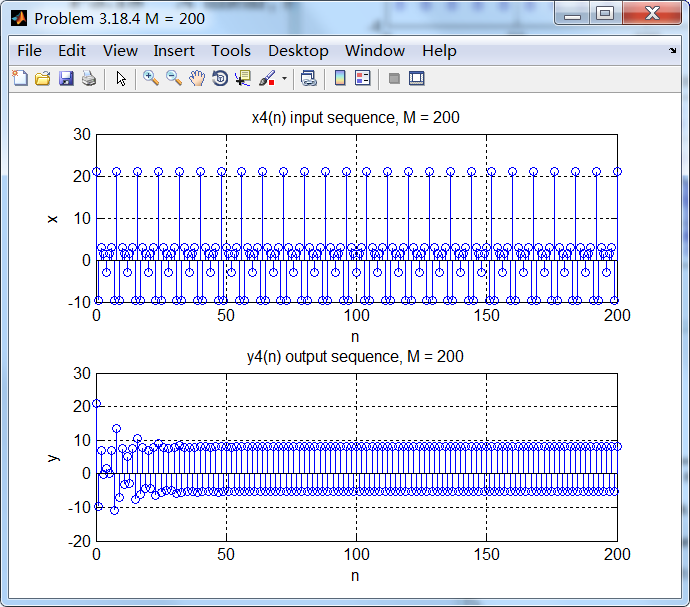
%% ------------------------------------------------------------------------------
%% x4(n)=1+2cos(pin/4)+3cos(2pin/4)+4cos(3pin/4)+5cos(4pin/4)+6cos(5pin/4)
%% ------------------------------------------------------------------------------
n4 = n1;
sum = 0;
for i = 0:5
sum = sum + (i+1)*cos(i*pi*n4/4);
end
x4 = sum;
y4 = filter(b, a, x4);
figure('NumberTitle', 'off', 'Name', sprintf('Problem 3.18.4 M = %d',M));
set(gcf,'Color','white');
subplot(2,1,1);
stem(n4, x4);
xlabel('n'); ylabel('x');
title(sprintf('x4(n) input sequence, M = %d', M)); grid on;
subplot(2,1,2);
stem(n4, y4);
xlabel('n'); ylabel('y');
title(sprintf('y4(n) output sequence, M = %d', M)); grid on;
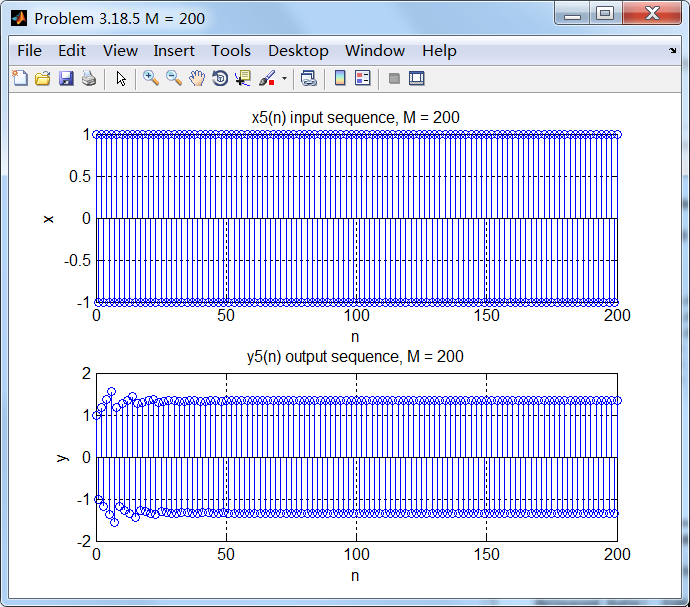
%% -----------------------------------------------------------------
%% x5(n)=cos(pin)
%% -----------------------------------------------------------------
n5 = n1;
x5 = cos(pi*n5);
y5 = filter(b, a, x5);
figure('NumberTitle', 'off', 'Name', sprintf('Problem 3.18.5 M = %d',M));
set(gcf,'Color','white');
subplot(2,1,1);
stem(n5, x5);
xlabel('n'); ylabel('x');
title(sprintf('x5(n) input sequence, M = %d', M)); grid on;
subplot(2,1,2);
stem(n5, y5);
xlabel('n'); ylabel('y');
title(sprintf('y5(n) output sequence, M = %d', M)); grid on;
%% -----------------------------------------------------------------
%% x0(n)=Acos(w0n+theta)
%% -----------------------------------------------------------------
A = 3;
w0 = 0.2*pi;
theta = 0;
n0 = n1;
x0 = A * cos(w0*n0+theta);
yss = filter(b, a, x0);
figure('NumberTitle', 'off', 'Name', sprintf('Problem 3.18.6 M = %d',M));
set(gcf,'Color','white');
subplot(2,1,1);
stem(n0, x0);
xlabel('n'); ylabel('x');
title(sprintf('x0(n) input sequence, M = %d', M)); grid on;
subplot(2,1,2);
stem(n0, yss);
xlabel('n'); ylabel('y');
title(sprintf('yss(n) output sequence, M = %d', M)); grid on;
运行结果:
1、LTI系统的频率响应
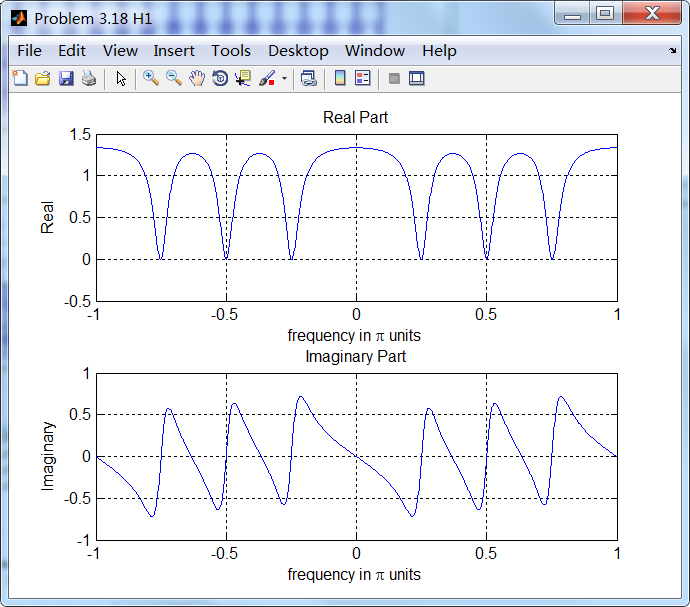
第1小题:
第2小题:
第3小题:
第4小题:
第5小题:
牢记:
1、如果你决定做某事,那就动手去做;不要受任何人、任何事的干扰。2、这个世界并不完美,但依然值得我们去为之奋斗。

 浙公网安备 33010602011771号