

《DSP using MATLAB》示例 Example 9.6
代码:
%% ------------------------------------------------------------------------
%%            Output Info about this m-file
fprintf('\n***********************************************************\n');
fprintf('        <DSP using MATLAB> Exameple 9.6 \n\n');

time_stamp = datestr(now, 31);
[wkd1, wkd2] = weekday(today, 'long');
fprintf('      Now is %20s, and it is %7s  \n\n', time_stamp, wkd2);
%% ------------------------------------------------------------------------

n = 0:2048; k1 = 256; k2 = k1+32; m = 0:(k2-k1);

%% -----------------------------------------------------------------
%%                             Plot
%% -----------------------------------------------------------------
Hf1 = figure('units', 'inches', 'position', [1, 1, 8, 6], ...
	'paperunits', 'inches', 'paperposition', [0, 0, 6, 4], ...
	'NumberTitle', 'off', 'Name', 'Exameple 9.6');
set(gcf,'Color','white');

TF = 10;
% (a) Original singal
x = cos(0.125*pi*n);
subplot(2, 2, 1);
Ha = stem(m, x(m+k1+1), 'filled'); axis([-1, 33, -1.1, 1.1]); grid on;
set(Ha, 'markersize', 2); xlabel('n'); ylabel('Amplitude');
title('Original Signal x(n)', 'fontsize', TF);
set(gca, 'xtick', [0, 16, 32]);
set(gca, 'ytick', [-1, 0, 1]);

% (b) Sample rate conversion by 3/2:  I = 3, D = 2
I = 3; D = 2; [y, h] = resample(x, I, D);
fprintf('\n  The Length of filter is %d , and length of y is %d \n', length(h), length(y) );

subplot(2, 2, 2);
Hb = stem(m, y(m+k1*I/D+1), 'filled'); axis([-1, 33, -1.1, 1.1]); grid on;
set(Hb, 'markersize', 2); xlabel('n'); ylabel('Amplitude');
title('Sample rate I/D: I = 3, D = 2 ', 'fontsize', TF);
set(gca, 'xtick', [0, 16, 24, 32]);
set(gca, 'ytick', [-1, 0, 1]);

% (c) Sample rate conversion by 3/4:  I = 3, D = 4
I = 3; D = 4; [y, h] = resample(x, I, D);
fprintf('\n  The Length of filter is %d , and length of y is %d \n', length(h), length(y) );

subplot(2, 2, 3);
Hc = stem(m, y(m+k1*I/D+1), 'filled'); axis([-1, 33, -1.1, 1.1]); grid on;
set(Hc, 'markersize', 2); xlabel('n'); ylabel('Amplitude');
title('Sample rate I/D: I = 3, D = 4 ', 'fontsize', TF);
set(gca, 'xtick', [0, 12, 16, 32]);
set(gca, 'ytick', [-1, 0, 1]);

% (d) Sample rate conversion by 5/8:  I = 5, D = 8
I = 5; D = 8; [y, h] = resample(x, I, D);
fprintf('\n  The Length of filter is %d , and length of y is %d \n', length(h), length(y) );

subplot(2, 2, 4);
Hd = stem(m, y(m+k1*I/D+1), 'filled'); axis([-1, 33, -1.1, 1.1]); grid on;
set(Hd, 'markersize', 2); xlabel('n'); ylabel('Amplitude');
title('Sample rate I/D: I = 5, D = 8 ', 'fontsize', TF);
set(gca, 'xtick', [0, 10, 16, 32]);
set(gca, 'ytick', [-1, 0, 1]);
运行结果:
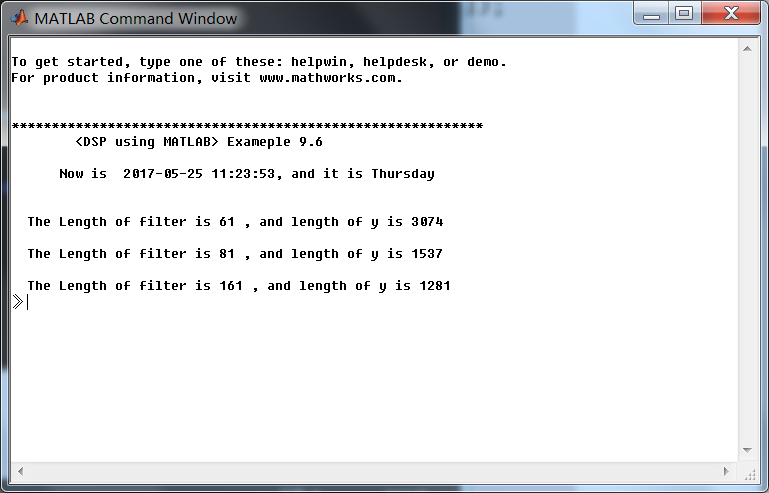
三种不同采样率情况下对应的滤波器长度61、81、161是如何算出来的,我现在还不清楚,有知道的博友不吝赐教。在这里先谢谢了。
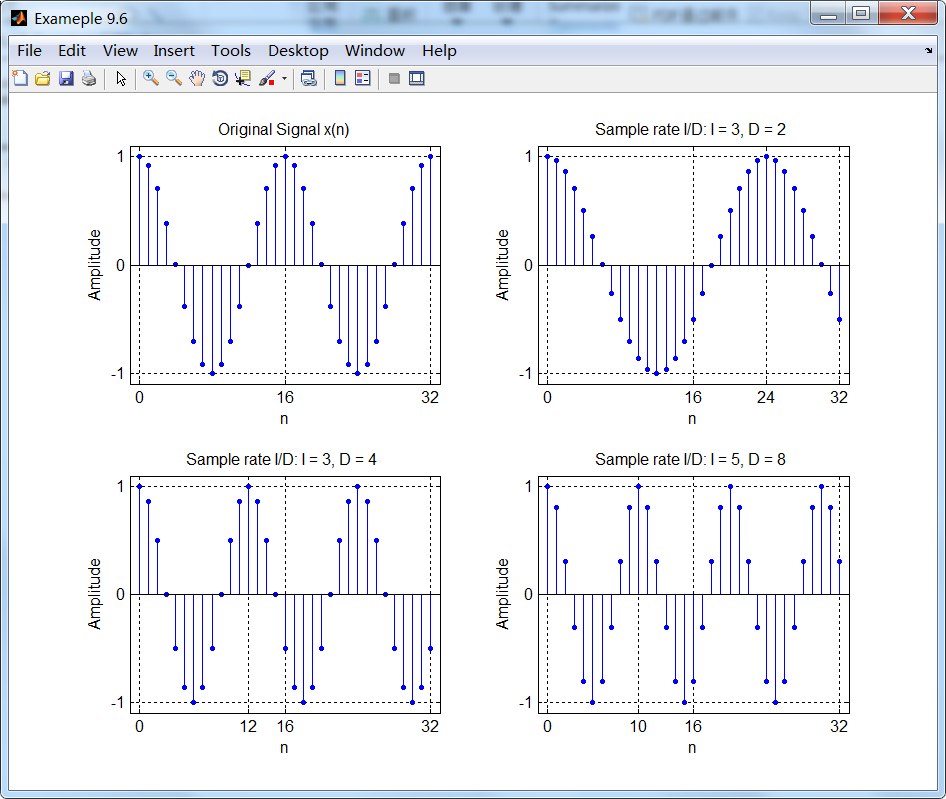
第1个采样率用3/2(大于1)转换,总体效果表现为插值。所得信号在一个周期内有16×3/2=24个采样点。
另外两个采样率变换因子都小于1,总体效果就表现为抽样,相应的一个周期内分别有16×3/4=12、16×5/8=10个采样点。
牢记:
1、如果你决定做某事,那就动手去做;不要受任何人、任何事的干扰。2、这个世界并不完美,但依然值得我们去为之奋斗。

 浙公网安备 33010602011771号