

《DSP using MATLAB》示例Example7.5

代码:
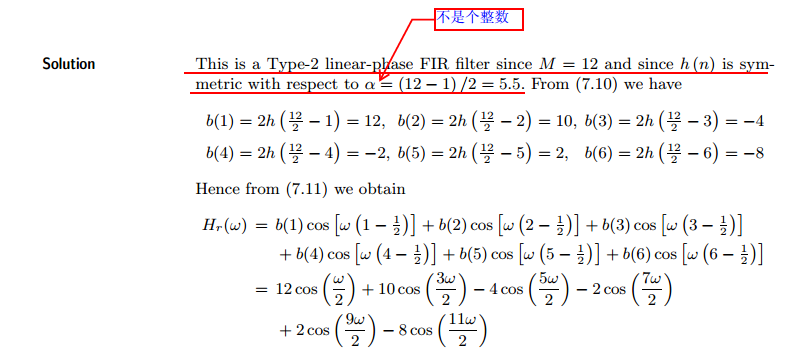
h = [-4, 1, -1, -2, 5, 6, 6, 5, -2, -1, 1, -4];
M = length(h); n = 0:M-1;
[Hr, w, b, L] = Hr_Type2(h);
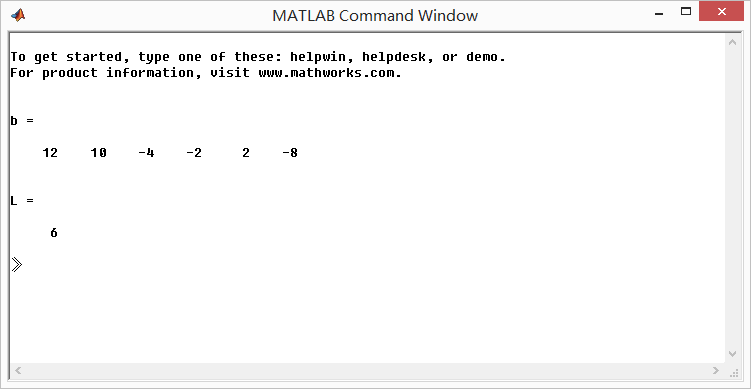
b
L
bmax = max(b) + 1; bmin = min(b) - 1;
figure('NumberTitle', 'off', 'Name', 'Exameple 7.5')
set(gcf,'Color','white');
subplot(2,2,1); stem(n, h); axis([-1, 2*L+1, bmin, bmax]); grid on;
xlabel('n'); ylabel('h(n)'); title('Impulse Response');
subplot(2,2,3); stem(1:L, b); axis([-1, 2*L+1, bmin, bmax]); grid on;
xlabel('n'); ylabel('b(n)'); title('b(n) coefficients');
subplot(2,2,2); plot(w/pi, Hr); grid on;
xlabel('frequency in \pi units'); ylabel('Hr'); title('Type-2 Amplitude Response');
subplot(2,2,4); zplane(h); grid on;
xlabel('real axis'); ylabel('imaginary axis'); title('Pole-Zero Plot');
运行结果:
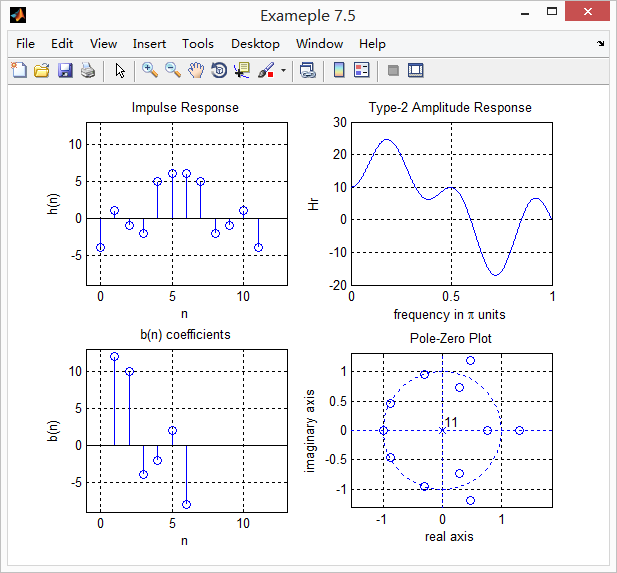
ω=π时,振幅谱为零。有3个零点对,其中一个在ω=π的位置。
牢记:
1、如果你决定做某事,那就动手去做;不要受任何人、任何事的干扰。2、这个世界并不完美,但依然值得我们去为之奋斗。

 浙公网安备 33010602011771号