

《DSP using MATLAB》示例Example4.15
代码:
b = [1/3, 1/3, 1/3]; a = [1, -0.95, 0.9025]; % x(n) y(n) coefficient
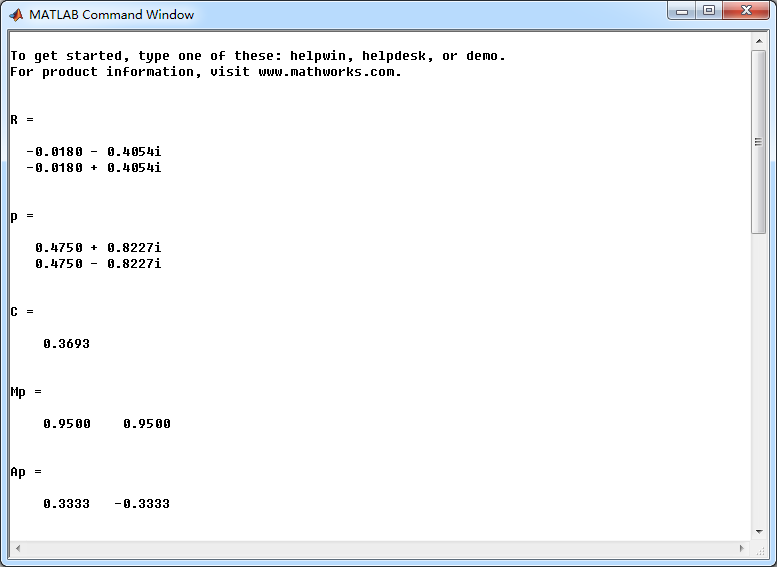
[R, p, C] = residuez(b,a)
Mp = (abs(p))', Ap = (angle(p))'/pi % polar form
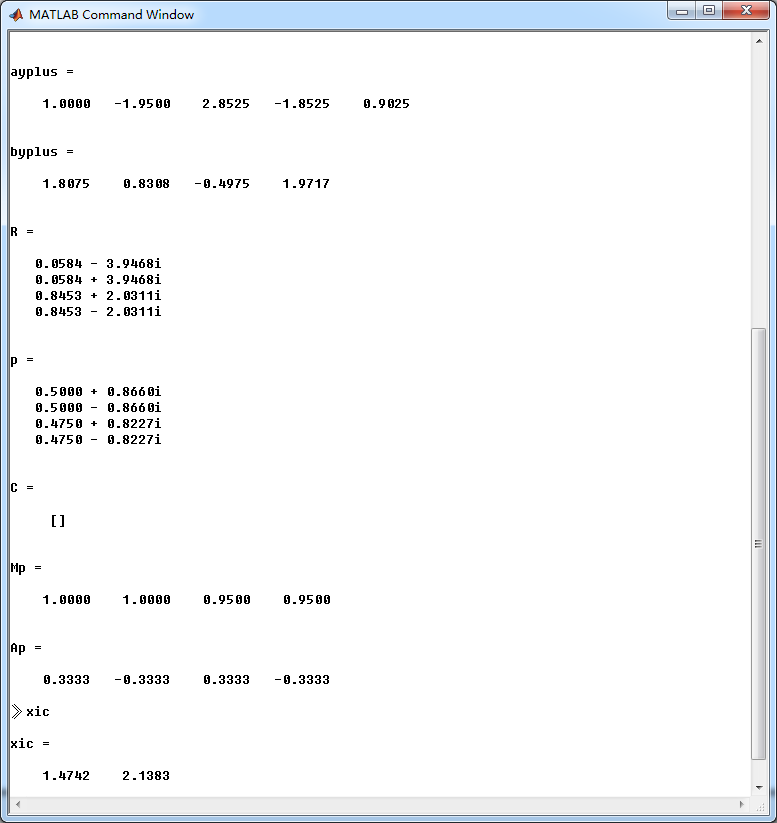
Y = [-2, -3]; X =[1, 1]; xic = filtic(b,a,Y,X);
%% ----------------------------------------------
%% START a determine H(z) and sketch
%% ----------------------------------------------
figure('NumberTitle', 'off', 'Name', 'Example4.15 H(z) its pole-zero plot')
set(gcf,'Color','white');
zplane(b,a);
title('pole-zero plot'); grid on;
%% ----------------------------------------------
%% END
%% ----------------------------------------------
bxplus = [1, -0.5]; axplus = [1, -1, 1]; % X(z) transform coeff
ayplus = conv(a, axplus) % Denominator of Yplus(z)
byplus = conv(b,bxplus) + conv(xic,axplus) % Numerator of Yplus(z)
[R, p, C] = residuez(byplus, ayplus)
Mp = (abs(p))' , Ap = (angle(p))'/pi % polar form
%% --------------------------------------------------------------
%% START b |H| <H
%% 1st form of freqz
%% --------------------------------------------------------------
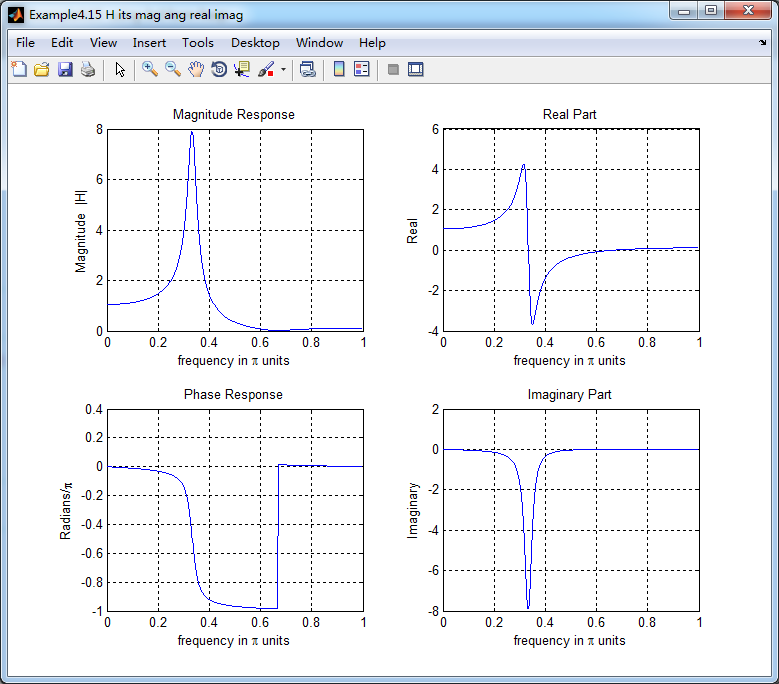
[H,w] = freqz(b,a,500); % 1st form of freqz
magH = abs(H); angH = angle(H); realH = real(H); imagH = imag(H);
%% ================================================
%% START H's mag ang real imag
%% ================================================
figure('NumberTitle', 'off', 'Name', 'Example4.15 H its mag ang real imag');
set(gcf,'Color','white');
subplot(2,2,1); plot(w/pi,magH); grid on; %axis([0,1,0,1.5]);
title('Magnitude Response');
xlabel('frequency in \pi units'); ylabel('Magnitude |H|');
subplot(2,2,3); plot(w/pi, angH/pi); grid on; % axis([-1,1,-1,1]);
title('Phase Response');
xlabel('frequency in \pi units'); ylabel('Radians/\pi');
subplot('2,2,2'); plot(w/pi, realH); grid on;
title('Real Part');
xlabel('frequency in \pi units'); ylabel('Real');
subplot('2,2,4'); plot(w/pi, imagH); grid on;
title('Imaginary Part');
xlabel('frequency in \pi units'); ylabel('Imaginary');
%% ==================================================
%% END H's mag ang real imag
%% ==================================================
%% ---------------------------------------------------------------
%% END b |H| <H
%% ---------------------------------------------------------------
%% --------------------------------------------------------------
%% START b |H| <H
%% 3rd form of freqz
%% --------------------------------------------------------------
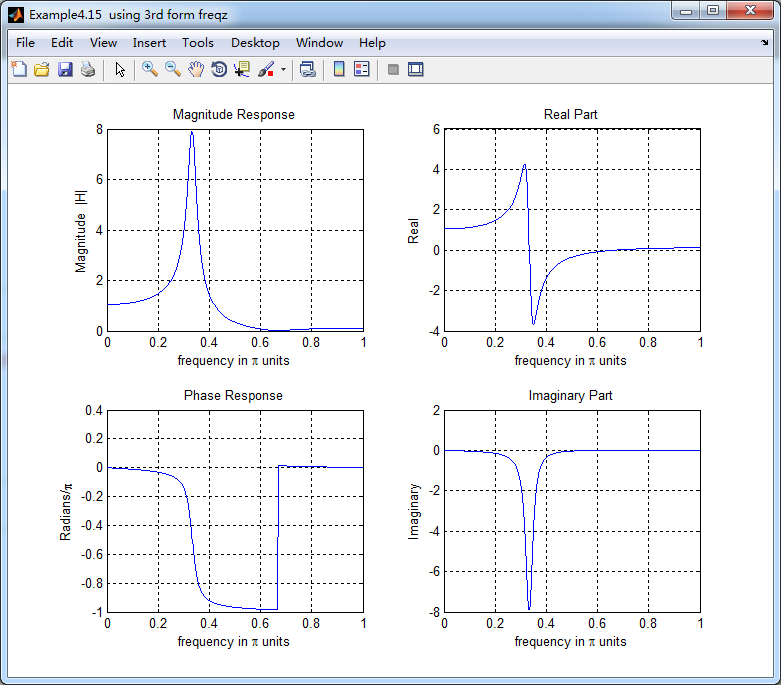
w = [0:1:500]*pi/500; H = freqz(b,a,w);
%[H,w] = freqz(b,a,200,'whole'); % 3rd form of freqz
magH = abs(H); angH = angle(H); realH = real(H); imagH = imag(H);
%% ================================================
%% START H's mag ang real imag
%% ================================================
figure('NumberTitle', 'off', 'Name', 'Example4.15 using 3rd form freqz ');
set(gcf,'Color','white');
subplot(2,2,1); plot(w/pi,magH); grid on; %axis([0,1,0,1.5]);
title('Magnitude Response');
xlabel('frequency in \pi units'); ylabel('Magnitude |H|');
subplot(2,2,3); plot(w/pi, angH/pi); grid on; % axis([-1,1,-1,1]);
title('Phase Response');
xlabel('frequency in \pi units'); ylabel('Radians/\pi');
subplot('2,2,2'); plot(w/pi, realH); grid on;
title('Real Part');
xlabel('frequency in \pi units'); ylabel('Real');
subplot('2,2,4'); plot(w/pi, imagH); grid on;
title('Imaginary Part');
xlabel('frequency in \pi units'); ylabel('Imaginary');
%% ==================================================
%% END H's mag ang real imag
%% ==================================================
%% ---------------------------------------------------------------
%% END b |H| <H
%% ---------------------------------------------------------------
%% START Check
n = [0:7]; x = cos(pi*n/3); y_ori = filter(b,a,x,xic)
%% MATLAB verification
A = real(2*R(1)); B = imag(2*R(1)); C = real(2*R(3)); D = imag(2*R(4));
y_check = A*cos(pi*n/3) + B *sin(pi*n/3) + ((0.95).^n) .* (C*cos(pi*n/3) + D*sin(pi*n/3))
结果:
牢记:
1、如果你决定做某事,那就动手去做;不要受任何人、任何事的干扰。2、这个世界并不完美,但依然值得我们去为之奋斗。

 浙公网安备 33010602011771号