

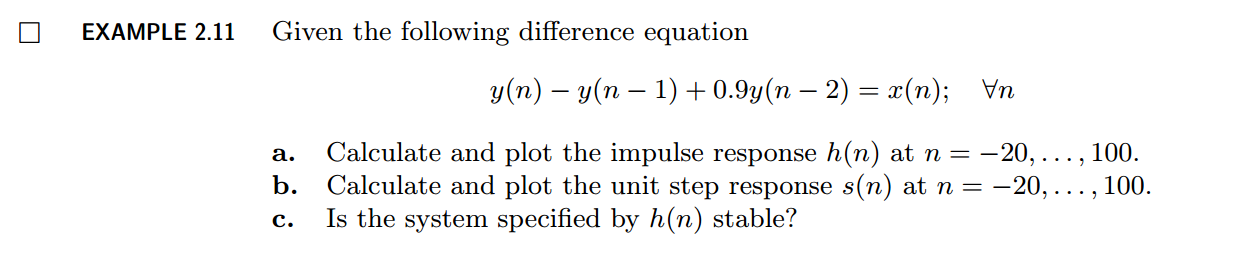
DSP using MATLAB 示例Example2.11
上代码:
b = [1]; a = [1, -1, 0.9]; n = [-20:120];
h = impz(b,a,n);

set(gcf,'Color','white');
%subplot(2,1,1);
stem(n,h); title('Impulse Response');
xlabel('n'); ylabel('h(n)'); grid on;


x = stepseq(0,-20, 120); s = filter(b,a,x);
figure; set(gcf,'Color','white');
%subplot(2, 1,2);
stem(n,x); title('Step Sequence');
xlabel('n'); ylabel('x(n)'); grid on;


figure; set(gcf,'Color','white');
%subplot(2, 1,2);
stem(n,s); title('Step Response');
xlabel('n'); ylabel('s(n)'); grid on;
结果:


牢记:
1、如果你决定做某事,那就动手去做;不要受任何人、任何事的干扰。2、这个世界并不完美,但依然值得我们去为之奋斗。

 浙公网安备 33010602011771号