《DSP using MATLAB》Problem 3.13(scilab脚本)
由P3.12的结论可知,将正弦(余弦)信号输入一个LTI(线性时不变)系统,那么其输出仍是同频率的正弦(余弦)信号,但模和相位都经过系统的修正,修正的系数跟
系统的频率响应函数(脉冲响应序列的DTFT)在该频率的值有关。
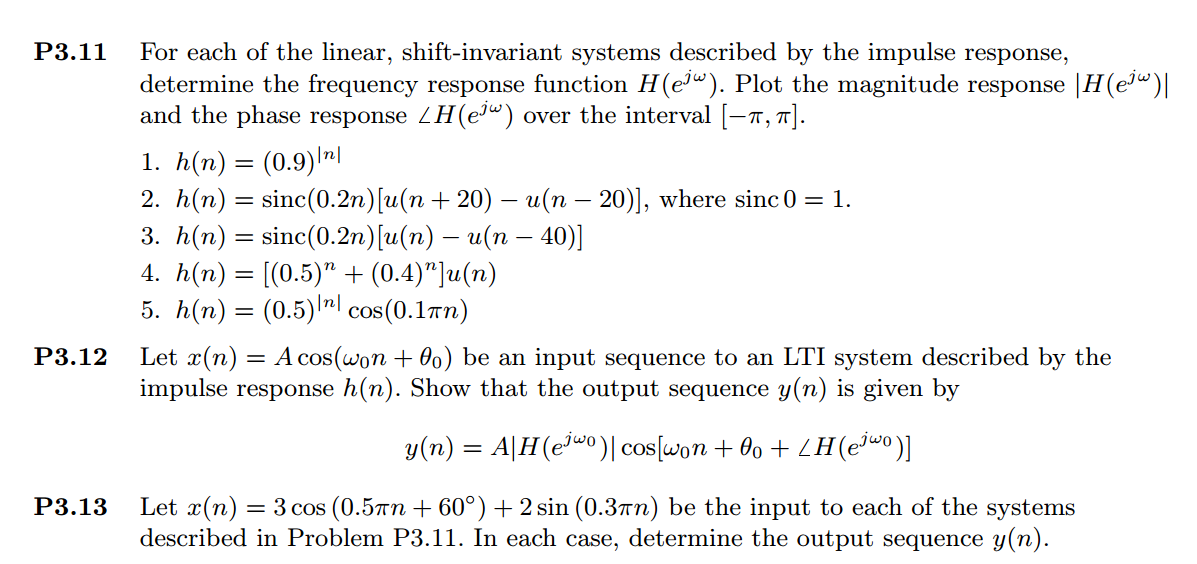
一、计算LTI系统的幅度谱和相位谱
已经给出了系统的脉冲响应序列,计算其离散时间傅里叶变换(DTFT)即可。
有两大类方法:
1、公式定义类
注意,定义中n是无限长,从-∞到+∞。
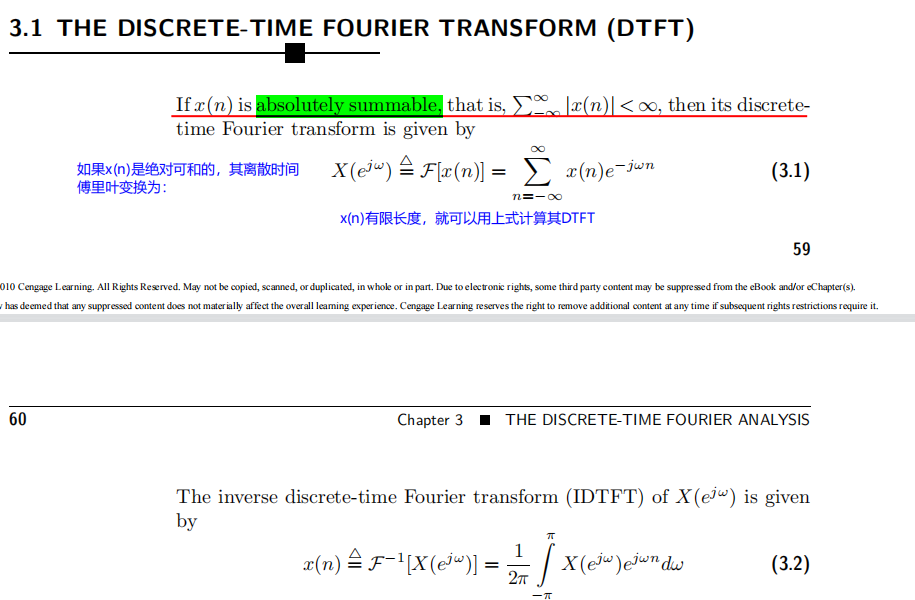

利用上图中最后的两个公式,就得到方法一、方法二。
2、实际数值计算类(MATLAB或scilab实现)
计算机计算不了无限的东西,只能取有限长序列。

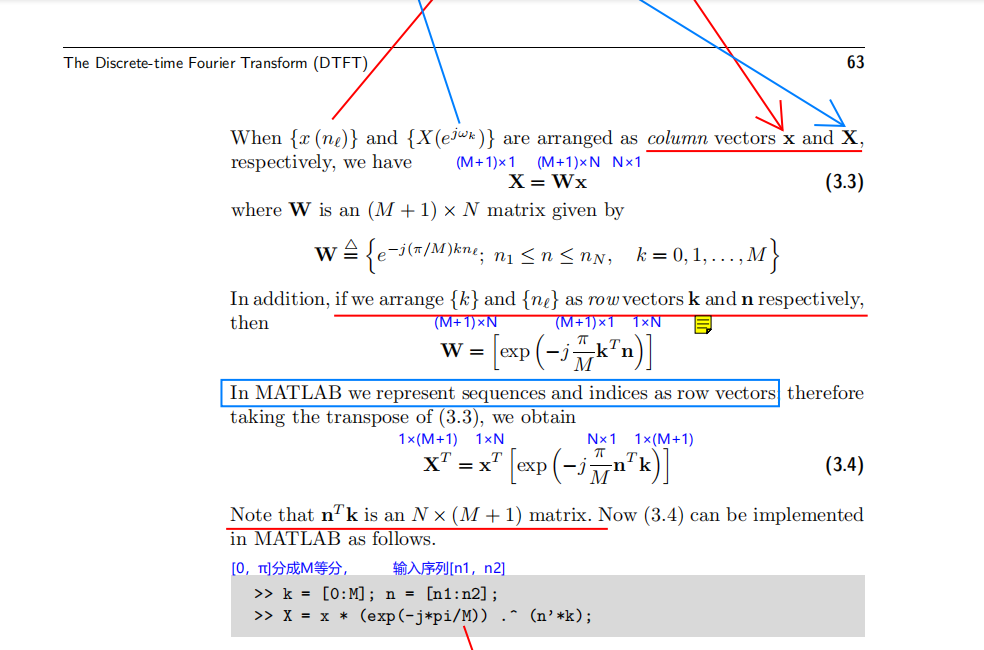
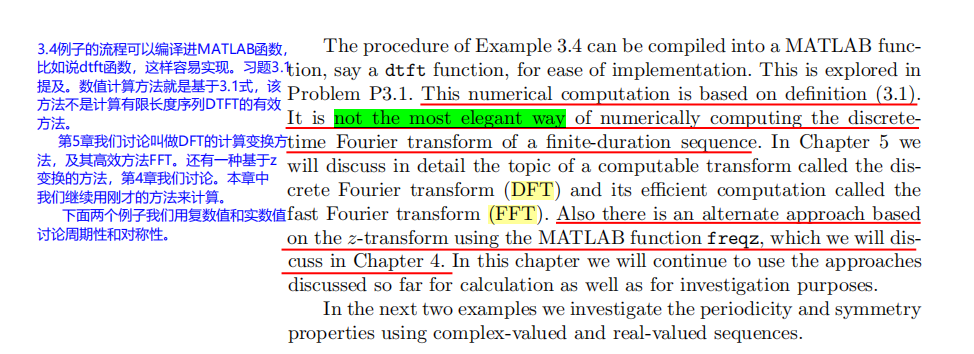
利用书中的3.4式子定义,得到方法三、方法四。
二、代码

  1 // Book Author:Vinay K Ingle, John G Proakis
  2 //
  3 // Problem 3.13
  4 // script by: KY
  5 //
  6 clear, clc, clf();
  7
  8 mode(2);
  9 funcprot(0);
 10 load('../fun/lib');
 11
 12 // -----------------------------------------------------------------------------
 13 //                START        Output Info about this sce-file
 14 mprintf('\n***********************************************************\n');
 15 [ban1,ban2] = fun_banner();
 16 mprintf("\n     <DSP using MATLAB> 3rd edition, Problem 3.13.1         \n");
 17 mprintf(" ----------------------------------------------------------\n\n");
 18
 19 // ----------------END----------------------------------------------------------
 20
 21 //% ------------------------------------------------------------------
 22 //%                         h1(n)
 23 //% ------------------------------------------------------------------
 24 //M = 10;
 25 //M = 15;
 26 //M = 25;
 27 M = 50;
 28
 29 n1_start = -M; n1_end = M;
 30 n1 = [n1_start : n1_end - 1];
 31
 32 x1 = 0.9 .^ abs(n1);
 33
 34 // -----------------------------------------------------------------------------
 35 // --------------------START  f0 figure-----------------------------------------
 36 f0=scf(0);                    //creates figure with id==0 and make it the current one
 37   f0.figure_size=[1000,700];               // adjust window size
 38   f0.background=8;                         // add background color 8-white
 39   f0.figure_name=msprintf("Fig0 Problem 3.13.1 h1(n), M = %d",M); // name window
 40
 41      plot(n1,x1,'bo');
 42      plot(n1,x1,'b.');
 43   plot2d3(n1,x1,2);                   // Create plot with blue line
 44 //title("$x1(n)\ sequence\ Rectangle, M = 100$",'fontname',7,'fontsize',4);
 45 title(msprintf('h1(n) sequence, M = %d', M));
 46 xlabel('$n$','fontname',3); ylabel('h1','fontname',3,'fontsize',3);
 47 xgrid(5,0,7);                             // color, thickness, style
 48 a0=get("current_axes");                   // get the handle of the newly created axes
 49 //a0.data_bounds=[-4,6,-6,6];
 50 // -----------------------------------------------------------------------------
 51 // --------------------END  f0 -------------------------------------------------
 52
 53
 54 MM = 500;
 55 k = [-MM:MM];        // [-pi, pi]
 56 //k = [0:M];         // [0, pi]
 57 w = (%pi/MM) * k;
 58
 59 w0_1 = 0.5 * %pi;
 60 w0_2 = 0.3 * %pi;
 61 theta0_1 = 60/180 * %pi;
 62
 63
 64 //[X1] = fun_dtft(x1, n1, w);                                                                                                                            // method #3
 65 [X1, w] = fun_dtft1(x1, n1, MM);                                                                                                                     // method #4
 66 //X1 = ( 2*ones(1, length(w)) - 0.9*exp(%i*w) - 0.9*exp(-%i*w)) ./ ( (1-0.9*exp(-%i*w)) .* (1-0.9*exp(%i*w)));     // method #1
 67 //X1 = ( 2 * ones(1, length(w)) - 1.8*cos(w)) ./ ( 1.81*ones(1, length(w)) - 1.8*cos(w));                                      // method #2
 68
 69 magX1 = abs(X1); angX1 = fun_angle(X1); realX1 = real(X1); imagX1 = imag(X1);
 70
 71 mprintf('w0 = %.2fpi, magX1_w0 = %.4f, angX1_w0 = %.4f \n', w0_1/%pi, magX1(find(k/MM==0.5)), angX1(find(k/MM==0.5)));
 72 mprintf('w0 = %.2fpi, magX1_w0 = %.4f, angX1_w0 = %.4f \n', w0_2/%pi, magX1(find(k/MM==0.3)), angX1(find(k/MM==0.3)));
 73
 74 //%% ---------------------------------------------------------------------------
 75 //%%                   START X(w)'s  mag ang real imag
 76 // --------------------START  f1 figure-----------------------------------------
 77 f1=scf(1);                    //creates figure with id==0 and make it the current one
 78   f1.figure_size=[1000,700];               // adjust window size
 79   f1.background=8;                         // add background color 8-white
 80   f1.figure_name=msprintf("Fig1 Problem 3.13.1 DTFT of h1(n), M = %d",M); // name window
 81   subplot(2, 2, 1);
 82      plot(w/%pi,magX1);
 83 title("$Magnitude\ Response$",'fontname',7,'fontsize',4);
 84 xlabel('$frequency\ in\ \pi\ units$','fontname',3); ylabel('Magnitude |X|','fontname',3,'fontsize',3);
 85 xgrid(5,0,7);                             // color, thickness, style
 86 a0=get("current_axes");                   // get the handle of the newly created axes
 87 //a0.data_bounds=[-4,6,-6,6];
 88
 89  subplot(2, 2, 3);
 90      plot(w/%pi,angX1/%pi);
 91 title("$Phase\ Response$",'fontname',7,'fontsize',4);
 92 xlabel('$frequency\ in\ \pi\ units$','fontname',3); ylabel('$Radians/\pi$','fontname',3,'fontsize',3);
 93 xgrid(5,1,7);                            // color, thickness, style
 94 a1=get("current_axes");                  // get the handle of the newly created axes
 95 //a1.data_bounds=[-4,6,-2,2];
 96
 97  subplot(2, 2, 2);
 98      plot(w/%pi,realX1);
 99 title("$Real\ Part$",'fontname',7,'fontsize',4);
100 xlabel('$frequency\ in\ \pi\ units$','fontname',3); ylabel('Real','fontname',3,'fontsize',3);
101 //xgrid();
102 xgrid(5,1,7);                           // color, thickness, style
103 a2=get("current_axes");                 // get the handle of the newly created axes
104 //a2.data_bounds=[-4,6,-2,2];
105
106  subplot(2, 2, 4);
107      plot(w/%pi,imagX1*exp(0));
108 title("$Imaginary\ Part$",'fontname',7,'fontsize',4);
109 xlabel('$frequency\ in\ \pi\ units$','fontname',3); ylabel('Imaginary','fontname',3,'fontsize',3);
110 //xgrid();
111 xgrid(5,1,7);                          // color, thickness, style
112 a3=get("current_axes");                // get the handle of the newly created axes
113 //a2.data_bounds=[-4,6,-2,2];
114 // ----------------------------END f1-------------------------------------------
115 //%%                   END X(w)'s  mag ang real imag
116 //%% ---------------------------------------------------------------------------
三、运行结果
1、脉冲响应序列,长度设为101

2、使用公式定义计算频谱(脉冲响应序列的DTFT)

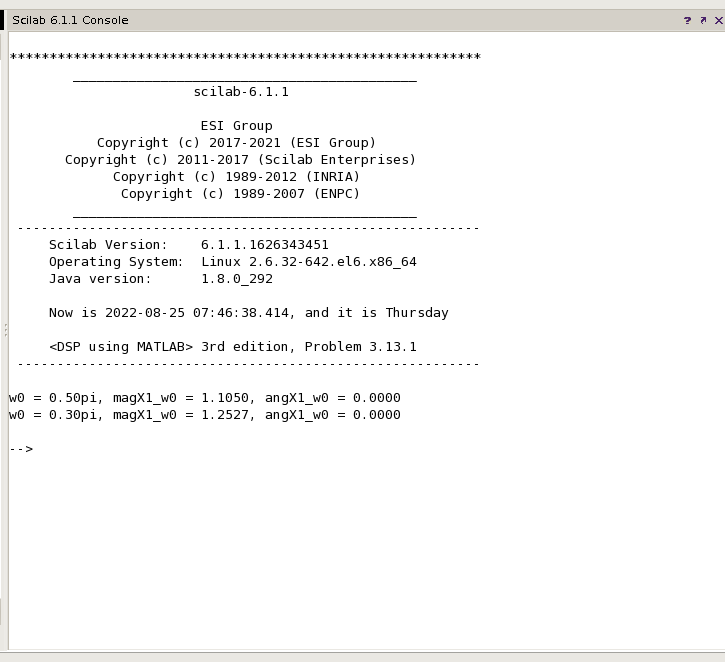
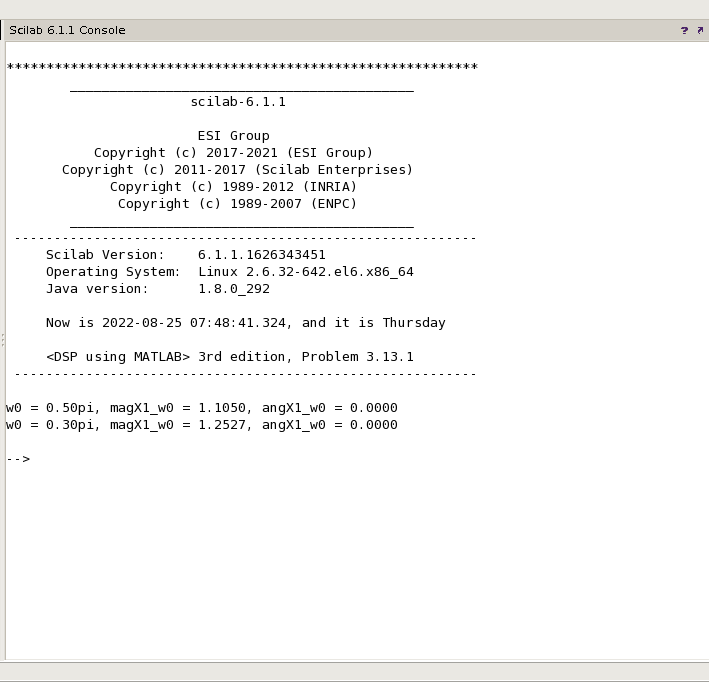
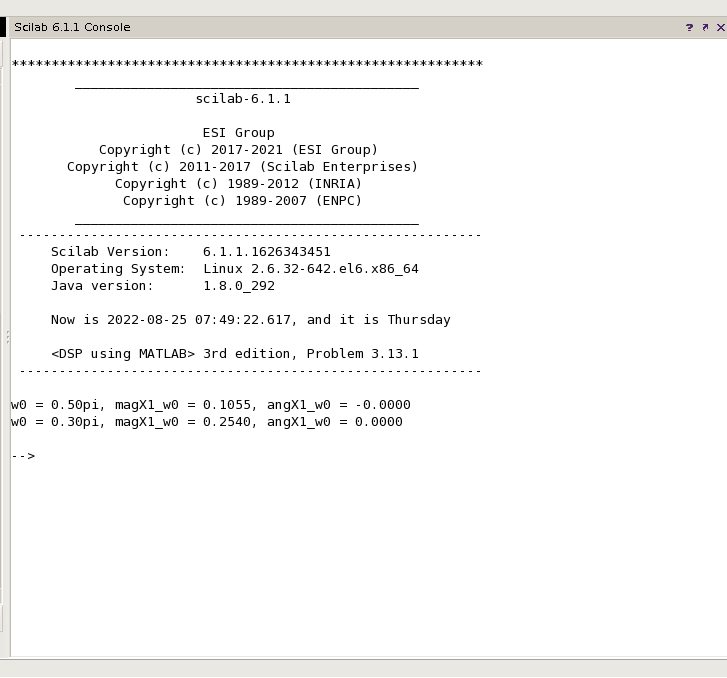
3、下面是按照第一部分介绍的4种方法,分别计算频谱,然后在与输入函数相同频率处,取得频谱(频率响应函数)对应的值。
①方法一
②方法二
③方法三
④方法四

因为特定角频率处相位谱的值为零,故只将幅度谱的值列表总结见下表,可见,利用公式定义得到的结果是最准确的,
而利用Problem 3.1的方法得到的结果稍有误差,也就是书中所说这种计算DTFT的方法并不是最有效的(not the most elegant way)。
| 0.5π | 0.3π | |
| 1 | 1.1050 | 1.2527 |
| 2 | 1.1050 | 1.2527 |
| 3 | 0.1055 | 0.2540 |
| 4 | 0.1055 | 0.0666 |
*****文中不对的地方欢迎批评指正*****
牢记:
1、如果你决定做某事,那就动手去做;不要受任何人、任何事的干扰。2、这个世界并不完美,但依然值得我们去为之奋斗。


 浙公网安备 33010602011771号