

《DSP using MATLAB》Problem 2.14 (scilab脚本)
从过年到现在,疫情看上去此起彼伏,没完没了,
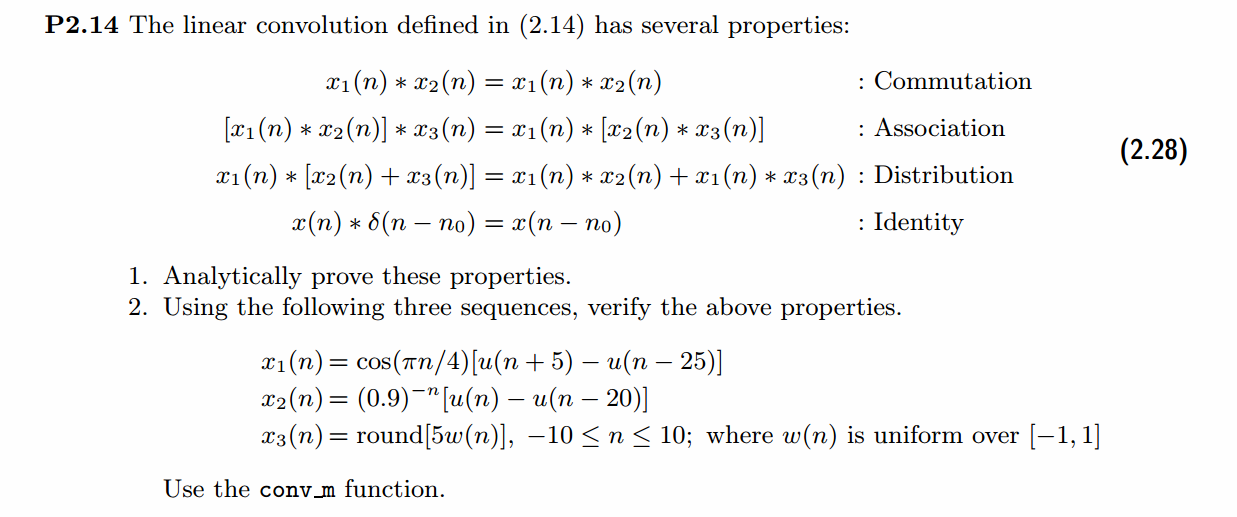
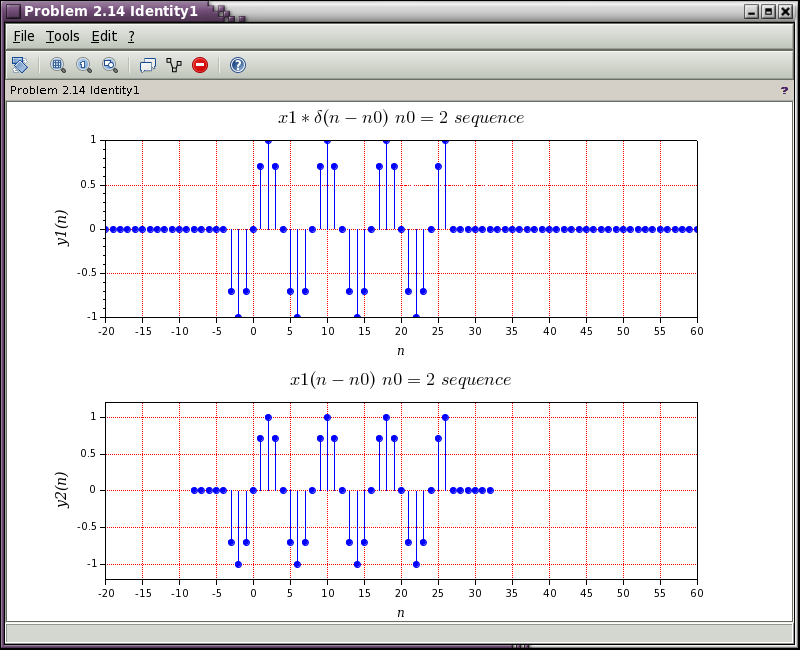
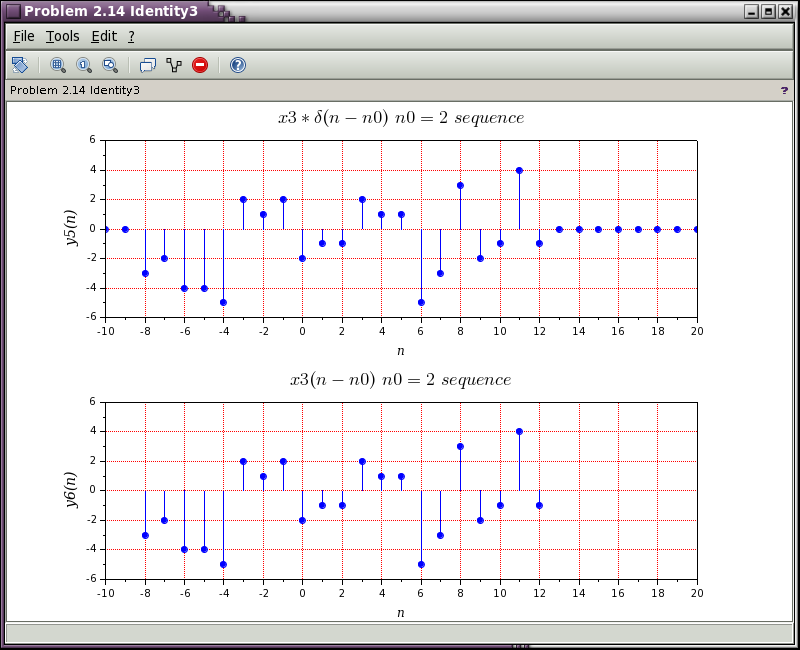
代码全放,图的话只放第4(Identity)性质的验证,某序列和有时移的脉冲序列卷积相当于某序列直接进行时移。
代码如下:
// <<DSP using MATLAB>>3rd edition
// Book Author:Vinay K Ingle, John G Proakis
//
// Problem 2.14
// script by: KY
//
clear, clc, clf();

mode(2);
funcprot(0);
exec('fun_banner.sci');          // output version and OS info
exec('fun_stepseq.sci');
exec('fun_impseq.sci');
exec('fun_sigfold.sci');
exec('fun_conv_m.sci');
exec('fun_sigadd.sci');
exec('fun_sigshift.sci');
exec('fun_dnsample.sci');
exec('fun_sigmult.sci');

// ------------------------------------------------------------------------
//            START        Output Info about this sce-file
mprintf('\n***********************************************************\n');
[ban1,ban2] = fun_banner();
mprintf("\n     <DSP using MATLAB> 3rd edition, Problem 2.14          \n");
mprintf(" ----------------------------------------------------------\n\n");

// -----------END----------------------------------------------------------


n1 = [-10:30];
x1 = cos(%pi*n1/4) .* (fun_stepseq(-5, -10, 30) - fun_stepseq(25, -10, 30));

n2 = [-10:30];
x2 = (0.9 .^ (-n2)) .* (fun_stepseq(0, -10, 30) - fun_stepseq(20, -10, 30));

n3 = [-10:10];
x3 = round( 5 * (-1+2*rand(21,1,'uniform')));

[x4, n4] = fun_impseq(2, -10, 30);


// ------------START  f0 figure-------------------------------------------------
f0=scf(0);                    //creates figure with id==0 and make it the current one
  f0.figure_size=[900,700];                // adjust window size
  f0.background=8;                         // add background color 8-white
  f0.figure_name="Problem 2.14 Fig0-Original Sequence ";          // name window
  subplot(2, 2, 1);
     plot(n1,x1,'bo');
     plot(n1,x1,'b.');
  plot2d3(n1,x1,2);                      // Create plot with blue line
title("$x1(n)\ =cos(\pi n/4)[u(n+5)-u(n-25)]\ sequence $",'fontname',7,'fontsize',4);
xlabel('n','fontname',3); ylabel('x1(n)','fontname',3,'fontsize',3);
//xgrid();
xgrid(5,0,7);             // color, thickness, style
a0=get("current_axes");                // get the handle of the newly created axes
a0.data_bounds=[-10,30,-2,2];

 subplot(2, 2, 2);
     plot(n2,x2,'bo');
     plot(n2,x2,'b.');
  plot2d3(n2,x2,2);                      // Create plot with blue line
title("$x2=(10/9)^n[u(n)-u(n-20)] \ sequence$",'fontname',7,'fontsize',4);
xlabel('n','fontname',3); ylabel('x2(n)','fontname',3,'fontsize',3);
//xgrid();
xgrid(5,1,7);           // color, thickness, style
a1=get("current_axes");                // get the handle of the newly created axes
//a1.data_bounds=[0,15,-1.10,1.10];

 subplot(2, 2, 3);
     plot(n3,x3,'bo');
     plot(n3,x3,'b.');
  plot2d3(n3,x3,2);                      // Create plot with blue line
title("$x3=round[5w(n)]\ sequence$",'fontname',7,'fontsize',4);
xlabel('n','fontname',3); ylabel('x3(n)','fontname',3,'fontsize',3);
//xgrid();
xgrid(5,1,7);           // color, thickness, style
a1=get("current_axes");                // get the handle of the newly created axes
a1.data_bounds=[-10,10,-5,5];

 subplot(2, 2, 4);
     plot(n4,x4,'bo');
     plot(n4,x4,'b.');
  plot2d3(n4,x4,2);                      // Create plot with blue line
title("$x4=\delta(n-2)\ sequence$",'fontname',7,'fontsize',4);
xlabel('n','fontname',3); ylabel('x4(n)','fontname',3,'fontsize',3);
//xgrid();
xgrid(5,1,7);           // color, thickness, style
a1=get("current_axes");                // get the handle of the newly created axes
a1.data_bounds=[-10,30,-0.10,1.10];
// -----------END f0------------------------------------------------------------


//%% ------------------------------------------
//%%             Commutation
//%% ------------------------------------------
[y1, ny1] = fun_conv_m(x1, n1, x2, n2);
[y2, ny2] = fun_conv_m(x2, n2, x1, n1);

// ------------START  f1 figure-------------------------------------------------
f1=scf(1);                    //creates figure with id==0 and make it the current one
  f1.figure_size=[800,650];                // adjust window size
  f1.background=8;                         // add background color 8-white
  f1.figure_name="Problem 2.14 Commutation ";          // name window
  subplot(2, 1, 1);
     plot(ny1,y1,'bo');
     plot(ny1,y1,'b.');
  plot2d3(ny1,y1,2);                      // Create plot with blue line
title("$x1*x2\ sequence $",'fontname',7,'fontsize',4);
xlabel('n','fontname',3); ylabel('y1(n)','fontname',3,'fontsize',3);
//xgrid();
xgrid(5,0,7);             // color, thickness, style
a0=get("current_axes");                // get the handle of the newly created axes
//a0.data_bounds=[0,120,-10,10];

 subplot(2, 1, 2);
     plot(ny2,y2,'bo');
     plot(ny2,y2,'b.');
  plot2d3(ny2,y2,2);                      // Create plot with blue line
title("$x2*x1\ sequence$",'fontname',7,'fontsize',4);
xlabel('n','fontname',3); ylabel('y2(n)','fontname',3,'fontsize',3);
//xgrid();
xgrid(5,1,7);           // color, thickness, style
a1=get("current_axes");                // get the handle of the newly created axes
//a1.data_bounds=[0,15,-1.10,1.10];

// -----------END f1------------------------------------------------------------


//%% -----------------------------------------------
//%%               Association
//%% -----------------------------------------------
[y1, ny1] = fun_conv_m(x1, n1, x2, n2);
[y2, ny2] = fun_conv_m(y1, ny1, x3, n3);

[y3, ny3] = fun_conv_m(x2, n2, x3, n3);
[y4, ny4] = fun_conv_m(y3, ny3, x1, n1);

// ------------START  f2 figure-------------------------------------------------
f2=scf(2);                    //creates figure with id==0 and make it the current one
  f2.figure_size=[800,650];                // adjust window size
  f2.background=8;                         // add background color 8-white
  f2.figure_name="Problem 2.14 Association ";          // name window
  subplot(2, 1, 1);
     plot(ny2,y2,'bo');
     plot(ny2,y2,'b.');
  plot2d3(ny2,y2,2);                      // Create plot with blue line
title("$(x1*x2)*x3\ sequence $",'fontname',7,'fontsize',4);
xlabel('n','fontname',3); ylabel('y2(n)','fontname',3,'fontsize',3);
//xgrid();
xgrid(5,0,7);             // color, thickness, style
a0=get("current_axes");                // get the handle of the newly created axes
//a0.data_bounds=[0,120,-10,10];

 subplot(2, 1, 2);
     plot(ny4,y4,'bo');
     plot(ny4,y4,'b.');
  plot2d3(ny4,y4,2);                      // Create plot with blue line
title("$x1*(x2*x3)\ sequence$",'fontname',7,'fontsize',4);
xlabel('n','fontname',3); ylabel('y4(n)','fontname',3,'fontsize',3);
//xgrid();
xgrid(5,1,7);           // color, thickness, style
a1=get("current_axes");                // get the handle of the newly created axes
//a1.data_bounds=[0,15,-1.10,1.10];

// -----------END f2------------------------------------------------------------


//%% ------------------------------------------------
//%%                 Distribution
//%% ------------------------------------------------
[y1, ny1] = fun_sigadd(x2, n2, x3, n3);        // x2+x3
[y2, ny2] = fun_conv_m(x1, n1, y1, ny1);       // x1*(x2+x3)

[y3, ny3] = fun_conv_m(x1, n1, x2, n2);        // x1*x2
[y4, ny4] = fun_conv_m(x1, n1, x3, n3);        // x1*x3
[y5, ny5] = fun_sigadd(y3, ny3, y4, ny4);      // x1*x2 + x1*x3

// ------------START  f3 figure-------------------------------------------------
f3=scf(3);                    //creates figure with id==0 and make it the current one
  f3.figure_size=[800,650];                // adjust window size
  f3.background=8;                         // add background color 8-white
  f3.figure_name="Problem 2.14 Distribution ";          // name window
  subplot(2, 1, 1);
     plot(ny2,y2,'bo');
     plot(ny2,y2,'b.');
  plot2d3(ny2,y2,2);                      // Create plot with blue line
title("$x1*[x2+x3]\ sequence $",'fontname',7,'fontsize',4);
xlabel('n','fontname',3); ylabel('y2(n)','fontname',3,'fontsize',3);
//xgrid();
xgrid(5,0,7);             // color, thickness, style
a0=get("current_axes");                // get the handle of the newly created axes
//a0.data_bounds=[0,120,-10,10];

 subplot(2, 1, 2);
     plot(ny5,y5,'bo');
     plot(ny5,y5,'b.');
  plot2d3(ny5,y5,2);                      // Create plot with blue line
title("$x1*x2+x1*x3\ sequence$",'fontname',7,'fontsize',4);
xlabel('n','fontname',3); ylabel('y5(n)','fontname',3,'fontsize',3);
//xgrid();
xgrid(5,1,7);           // color, thickness, style
a1=get("current_axes");                // get the handle of the newly created axes
//a1.data_bounds=[0,15,-1.10,1.10];

// -----------END f3------------------------------------------------------------


//%% -------------------------------------------------------------
//%%                Identity
//%% -------------------------------------------------------------

[y1, ny1] = fun_conv_m(x1, n1, x4, n4);     // x1*delta(n-2)
[y2, ny2] = fun_sigshift(x1, n1, 2);        // x1(n-2)

[y3, ny3] = fun_conv_m(x2, n2, x4, n4);     // x2*delta(n-2)
[y4, ny4] = fun_sigshift(x2, n2, 2);        // x2(n-2)

[y5, ny5] = fun_conv_m(x3, n3, x4, n4);     // x3*delta(n-2)
[y6, ny6] = fun_sigshift(x3, n3, 2);        // x3(n-2)

// ------------START  f4 figure-------------------------------------------------
f4=scf(4);                    //creates figure with id==0 and make it the current one
  f4.figure_size=[800,650];                // adjust window size
  f4.background=8;                         // add background color 8-white
  f4.figure_name="Problem 2.14 Identity1 ";          // name window
  subplot(2, 1, 1);
     plot(ny1,y1,'bo');
     plot(ny1,y1,'b.');
  plot2d3(ny1,y1,2);                      // Create plot with blue line
title("$x1*\delta(n-n0)\ n0=2 \ sequence $",'fontname',7,'fontsize',4);
xlabel('n','fontname',3); ylabel('y1(n)','fontname',3,'fontsize',3);
//xgrid();
xgrid(5,0,7);             // color, thickness, style
a0=get("current_axes");                // get the handle of the newly created axes
//a0.data_bounds=[0,120,-10,10];

 subplot(2, 1, 2);
     plot(ny2,y2,'bo');
     plot(ny2,y2,'b.');
  plot2d3(ny2,y2,2);                      // Create plot with blue line
title("$x1(n-n0)\ n0=2\ sequence$",'fontname',7,'fontsize',4);
xlabel('n','fontname',3); ylabel('y2(n)','fontname',3,'fontsize',3);
//xgrid();
xgrid(5,1,7);           // color, thickness, style
a1=get("current_axes");                // get the handle of the newly created axes
a1.data_bounds=[-20,60,-1.10,1.10];

// -----------END f4------------------------------------------------------------


// ------------START  f5 figure-------------------------------------------------
f5=scf(5);                    //creates figure with id==0 and make it the current one
  f5.figure_size=[800,650];                // adjust window size
  f5.background=8;                         // add background color 8-white
  f5.figure_name="Problem 2.14 Identity2 ";          // name window
  subplot(2, 1, 1);
     plot(ny3,y3,'bo');
     plot(ny3,y3,'b.');
  plot2d3(ny3,y3,2);                      // Create plot with blue line
title("$x2*\delta(n-n0)\ n0=2 \ sequence $",'fontname',7,'fontsize',4);
xlabel('n','fontname',3); ylabel('y3(n)','fontname',3,'fontsize',3);
//xgrid();
xgrid(5,0,7);             // color, thickness, style
a0=get("current_axes");                // get the handle of the newly created axes
a0.data_bounds=[-10,35,0,8];

 subplot(2, 1, 2);
     plot(ny4,y4,'bo');
     plot(ny4,y4,'b.');
  plot2d3(ny4,y4,2);                      // Create plot with blue line
title("$x2(n-n0)\ n0=2\ sequence$",'fontname',7,'fontsize',4);
xlabel('n','fontname',3); ylabel('y4(n)','fontname',3,'fontsize',3);
//xgrid();
xgrid(5,0,7);           // color, thickness, style
a1=get("current_axes");                // get the handle of the newly created axes
//a1.data_bounds=[0,15,-1.10,1.10];

// -----------END f5------------------------------------------------------------

// ------------START  f6 figure-------------------------------------------------
f6=scf(6);                    //creates figure with id==0 and make it the current one
  f6.figure_size=[800,650];                // adjust window size
  f6.background=8;                         // add background color 8-white
  f6.figure_name="Problem 2.14 Identity3 ";          // name window
  subplot(2, 1, 1);
     plot(ny5,y5,'bo');
     plot(ny5,y5,'b.');
  plot2d3(ny5,y5,2);                      // Create plot with blue line
title("$x3*\delta(n-n0)\ n0=2 \ sequence $",'fontname',7,'fontsize',4);
xlabel('n','fontname',3); ylabel('y5(n)','fontname',3,'fontsize',3);
//xgrid();
xgrid(5,0,7);             // color, thickness, style
a0=get("current_axes");                // get the handle of the newly created axes
a0.data_bounds=[-10,20,-6,6];

 subplot(2, 1, 2);
     plot(ny6,y6,'bo');
     plot(ny6,y6,'b.');
  plot2d3(ny6,y6,2);                      // Create plot with blue line
title("$x3(n-n0)\ n0=2\ sequence$",'fontname',7,'fontsize',4);
xlabel('n','fontname',3); ylabel('y6(n)','fontname',3,'fontsize',3);
//xgrid();
xgrid(5,1,7);           // color, thickness, style
a1=get("current_axes");                // get the handle of the newly created axes
a1.data_bounds=[-10,20,-6,6];

// -----------END f6------------------------------------------------------------
4个原始序列:
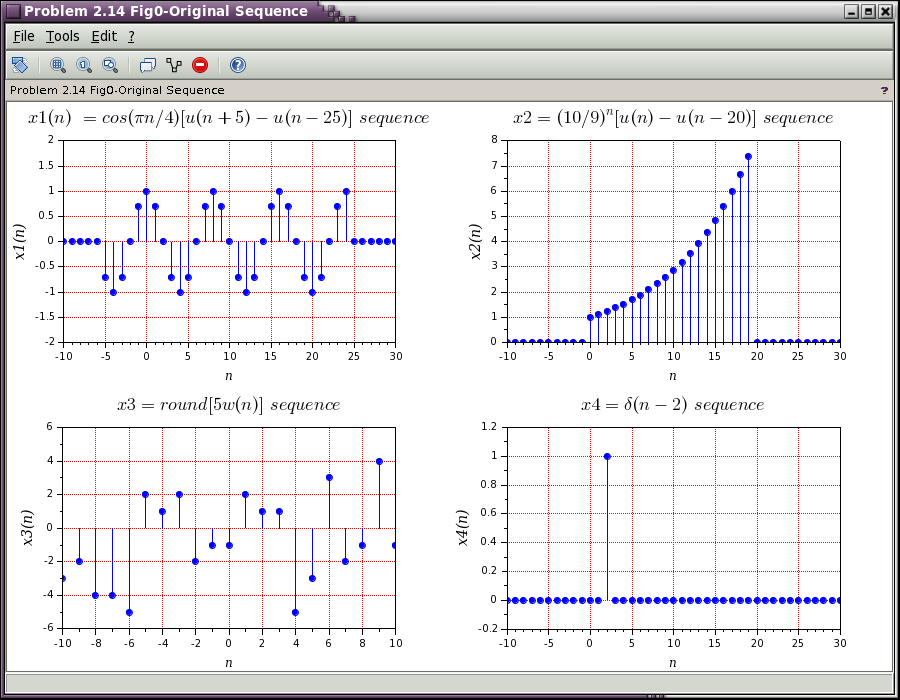
前3个序列分别和第4个序列卷积,结果如下。
以下三张图都分上下部分,上图为卷积计算所得结果,下图为序列时移所得,可看出两种方法结果一致。
牢记:
1、如果你决定做某事,那就动手去做;不要受任何人、任何事的干扰。2、这个世界并不完美,但依然值得我们去为之奋斗。

 浙公网安备 33010602011771号