

《DSP using MATLAB》Problem 7.26


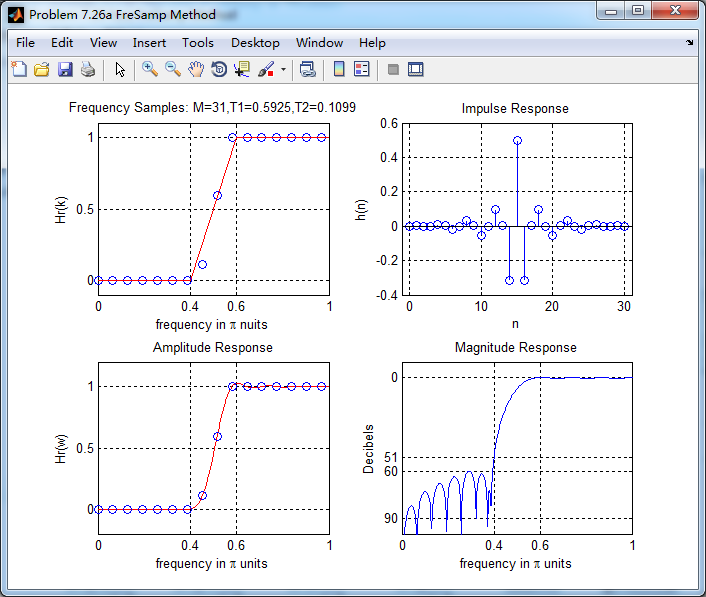
注意:高通的线性相位FIR滤波器,不能是第2类,所以其长度必须为奇数。这里取M=31,过渡带里采样值抄书上的。
代码:
%% ++++++++++++++++++++++++++++++++++++++++++++++++++++++++++++++++++++++++++++++++
%% Output Info about this m-file
fprintf('\n***********************************************************\n');
fprintf(' <DSP using MATLAB> Problem 7.26 \n\n');
banner();
%% ++++++++++++++++++++++++++++++++++++++++++++++++++++++++++++++++++++++++++++++++
% highpass, Only Type-1 filter
ws1 = 0.4*pi; wp1 = 0.6*pi; As = 50; Rp = 0.004;
tr_width = (wp1-ws1);
T2 = 0.5925; T1=0.1099;
M = 31; alpha = (M-1)/2; l = 0:M-1; wl = (2*pi/M)*l;
n = [0:1:M-1]; wc1 = (ws1+wp1)/2;
Hrs = [zeros(1,7),T1,T2,ones(1,14),T2,T1,zeros(1,6)]; % Ideal Amp Res sampled
Hdr = [0, 0, 1, 1]; wdl = [0, 0.4, 0.6, 1]; % Ideal Amp Res for plotting
k1 = 0:floor((M-1)/2); k2 = floor((M-1)/2)+1:M-1;
%% --------------------------------------------------
%% Type-1 BPF
%% --------------------------------------------------
angH = [-alpha*(2*pi)/M*k1, alpha*(2*pi)/M*(M-k2)];
H = Hrs.*exp(j*angH); h = real(ifft(H, M));
[db, mag, pha, grd, w] = freqz_m(h, [1]); delta_w = 2*pi/1000;
%[Hr,ww,P,L] = ampl_res(h);
[Hr, ww, a, L] = Hr_Type1(h);
Rp = -(min(db(floor(wp1/delta_w)+1 :1: 501))); % Actual Passband Ripple
fprintf('\nActual Passband Ripple is %.4f dB.\n', Rp);
As = -round(max(db(1:1:floor(0.4*pi/delta_w)+1))); % Min Stopband attenuation
fprintf('\nMin Stopband attenuation is %.4f dB.\n', As);
[delta1, delta2] = db2delta(Rp, As)
% Plot
figure('NumberTitle', 'off', 'Name', 'Problem 7.26a FreSamp Method')
set(gcf,'Color','white');
subplot(2,2,1); plot(wl(1:16)/pi, Hrs(1:16), 'o', wdl, Hdr, 'r'); axis([0, 1, -0.1, 1.1]);
set(gca,'YTickMode','manual','YTick',[0,0.5,1]);
set(gca,'XTickMode','manual','XTick',[0,0.4,0.6,1]);
xlabel('frequency in \pi nuits'); ylabel('Hr(k)'); title('Frequency Samples: M=31,T1=0.5925,T2=0.1099');
grid on;
subplot(2,2,2); stem(l, h); axis([-1, M, -0.4, 0.6]); grid on;
xlabel('n'); ylabel('h(n)'); title('Impulse Response');
subplot(2,2,3); plot(ww/pi, Hr, 'r', wl(1:16)/pi, Hrs(1:16), 'o'); axis([0, 1, -0.2, 1.2]); grid on;
xlabel('frequency in \pi units'); ylabel('Hr(w)'); title('Amplitude Response');
set(gca,'YTickMode','manual','YTick',[0,0.5,1]);
set(gca,'XTickMode','manual','XTick',[0,0.4,0.6,1]);
subplot(2,2,4); plot(w/pi, db); axis([0, 1, -100, 10]); grid on;
xlabel('frequency in \pi units'); ylabel('Decibels'); title('Magnitude Response');
set(gca,'YTickMode','manual','YTick',[-90,-60,-51,0]);
set(gca,'YTickLabelMode','manual','YTickLabel',['90';'60';'51';' 0']);
set(gca,'XTickMode','manual','XTick',[0,0.4,0.6,1]);
figure('NumberTitle', 'off', 'Name', 'Problem 7.26 h(n) FreSamp Method')
set(gcf,'Color','white');
subplot(2,2,1); plot(w/pi, db); grid on; axis([0 2 -120 10]);
set(gca,'YTickMode','manual','YTick',[-90,-60,-51,0])
set(gca,'YTickLabelMode','manual','YTickLabel',['90';'60';'51';' 0']);
set(gca,'XTickMode','manual','XTick',[0,0.4,0.6,1,1.4,1.6,2]);
xlabel('frequency in \pi units'); ylabel('Decibels'); title('Magnitude Response in dB');
subplot(2,2,3); plot(w/pi, mag); grid on; %axis([0 1 -100 10]);
xlabel('frequency in \pi units'); ylabel('Absolute'); title('Magnitude Response in absolute');
set(gca,'XTickMode','manual','XTick',[0,0.4,0.6,1,1.4,1.6,2]);
set(gca,'YTickMode','manual','YTick',[0,1.0]);
subplot(2,2,2); plot(w/pi, pha); grid on; %axis([0 1 -100 10]);
xlabel('frequency in \pi units'); ylabel('Rad'); title('Phase Response in Radians');
subplot(2,2,4); plot(w/pi, grd*pi/180); grid on; %axis([0 1 -100 10]);
xlabel('frequency in \pi units'); ylabel('Rad'); title('Group Delay');
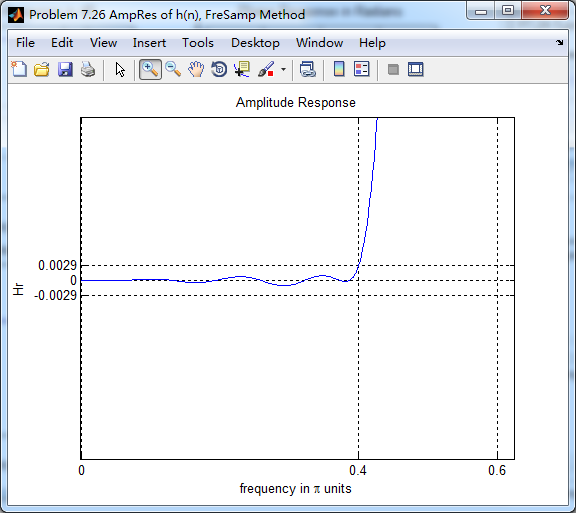
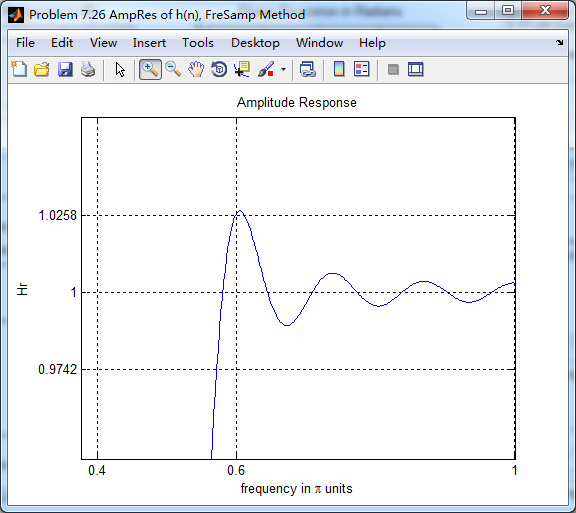
figure('NumberTitle', 'off', 'Name', 'Problem 7.26 AmpRes of h(n), FreSamp Method')
set(gcf,'Color','white');
plot(ww/pi, Hr); grid on; %axis([0 1 -100 10]);
xlabel('frequency in \pi units'); ylabel('Hr'); title('Amplitude Response');
set(gca,'YTickMode','manual','YTick',[-delta2, 0,delta2, 1-0.0258, 1,1+0.0258]);
%set(gca,'YTickLabelMode','manual','YTickLabel',['90';'45';' 0']);
set(gca,'XTickMode','manual','XTick',[0,0.4,0.6,1]);
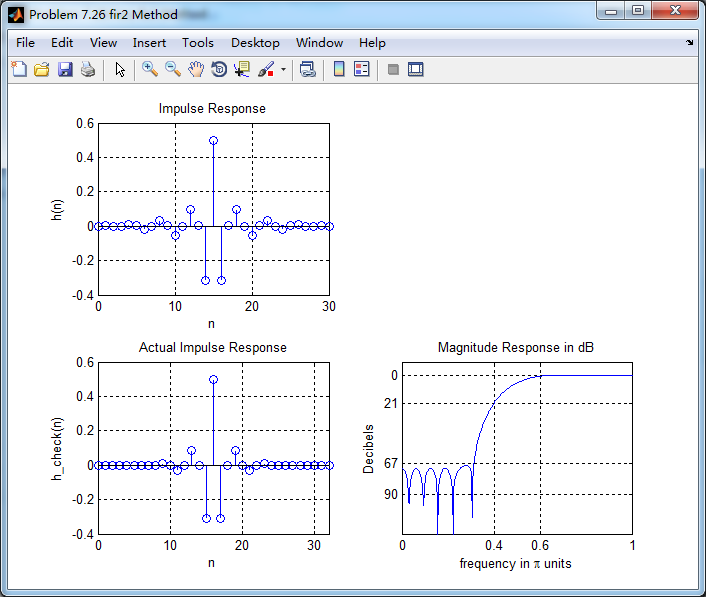
%% ------------------------------------
%% fir2 Method
%% ------------------------------------
f = [0 ws1 wp1 pi]/pi;
m = [0 0 1 1 ];
h_check = fir2(M+1, f, m); % if M is odd, then M+1; order
[db, mag, pha, grd, w] = freqz_m(h_check, [1]);
%[Hr,ww,P,L] = ampl_res(h_check);
[Hr, ww, a, L] = Hr_Type1(h_check);
fprintf('\n----------------------------------\n');
fprintf('\n fir2 function Method \n');
fprintf('\n----------------------------------\n');
Rp = -(min(db(floor(wp1/delta_w)+1 :1: 501))); % Actual Passband Ripple
fprintf('\nActual Passband Ripple is %.4f dB.\n', Rp);
As = -round(max(db(1:1:floor(0.4*pi/delta_w)+1 ))); % Min Stopband attenuation
fprintf('\nMin Stopband attenuation is %.4f dB.\n', As);
[delta1, delta2] = db2delta(Rp, As)
figure('NumberTitle', 'off', 'Name', 'Problem 7.26 fir2 Method')
set(gcf,'Color','white');
subplot(2,2,1); stem(n, h); axis([0 M-1 -0.4 0.6]); grid on;
xlabel('n'); ylabel('h(n)'); title('Impulse Response');
%subplot(2,2,2); stem(n, w_ham); axis([0 M-1 0 1.1]); grid on;
%xlabel('n'); ylabel('w(n)'); title('Hamming Window');
subplot(2,2,3); stem([0:M+1], h_check); axis([0 M+1 -0.4 0.6]); grid on;
xlabel('n'); ylabel('h\_check(n)'); title('Actual Impulse Response');
subplot(2,2,4); plot(w/pi, db); axis([0 1 -120 10]); grid on;
set(gca,'YTickMode','manual','YTick',[-90,-67,-21,0])
set(gca,'YTickLabelMode','manual','YTickLabel',['90';'67';'21';' 0']);
set(gca,'XTickMode','manual','XTick',[0,0.4,0.6,1]);
xlabel('frequency in \pi units'); ylabel('Decibels'); title('Magnitude Response in dB');
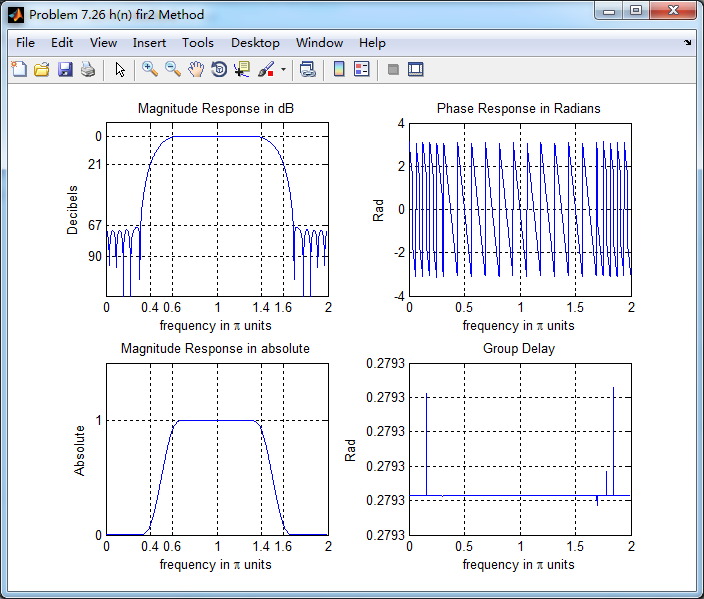
figure('NumberTitle', 'off', 'Name', 'Problem 7.26 h(n) fir2 Method')
set(gcf,'Color','white');
subplot(2,2,1); plot(w/pi, db); grid on; axis([0 2 -120 10]);
xlabel('frequency in \pi units'); ylabel('Decibels'); title('Magnitude Response in dB');
set(gca,'YTickMode','manual','YTick',[-90,-67,-21,0]);
set(gca,'YTickLabelMode','manual','YTickLabel',['90';'67';'21';' 0']);
set(gca,'XTickMode','manual','XTick',[0,0.4,0.6,1,1.4,1.6,2]);
subplot(2,2,3); plot(w/pi, mag); grid on; %axis([0 1 -100 10]);
xlabel('frequency in \pi units'); ylabel('Absolute'); title('Magnitude Response in absolute');
set(gca,'XTickMode','manual','XTick',[0,0.4,0.6,1,1.4,1.6,2]);
set(gca,'YTickMode','manual','YTick',[0,1.0]);
subplot(2,2,2); plot(w/pi, pha); grid on; %axis([0 1 -100 10]);
xlabel('frequency in \pi units'); ylabel('Rad'); title('Phase Response in Radians');
subplot(2,2,4); plot(w/pi, grd*pi/180); grid on; %axis([0 1 -100 10]);
xlabel('frequency in \pi units'); ylabel('Rad'); title('Group Delay');
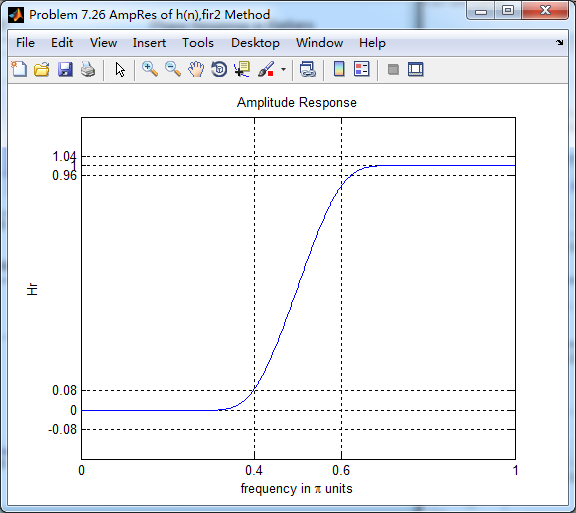
figure('NumberTitle', 'off', 'Name', 'Problem 7.26 AmpRes of h(n),fir2 Method')
set(gcf,'Color','white');
plot(ww/pi, Hr); grid on; %axis([0 1 -100 10]);
xlabel('frequency in \pi units'); ylabel('Hr'); title('Amplitude Response');
set(gca,'YTickMode','manual','YTick',[-0.08, 0,0.08, 1-0.04, 1,1+0.04]);
%set(gca,'YTickLabelMode','manual','YTickLabel',['90';'45';' 0']);
set(gca,'XTickMode','manual','XTick',[0,0.4,0.6,1]);
运行结果:


振幅响应


牢记:
1、如果你决定做某事,那就动手去做;不要受任何人、任何事的干扰。2、这个世界并不完美,但依然值得我们去为之奋斗。

 浙公网安备 33010602011771号