
Docker-compose 部署 Prometheus + Grafana + Alertmanager + DingDing 告警 (三)
配置 Grafana 数据源,导入 Dashboards
浏览器打开 http://172.16.16.119:3000/
-
配置 Grafana 的数据源为 Prometheus
http://prometheus:9090

-
新增一个 Dashboards,导入 id 为 8919 的模板

配置 Grafana Alerting
- 配置钉钉消息模板
点击 "Alerting" -> "Manage contact points" -> "Notification Templates" -> "Add notification template"


添加一个模板
Template name 为 dingding-title
Template 内容为
{{ define "my.title" }}[监控报警]: [{{ .Status | toUpper }}{{ if eq .Status "firing" }}:{{ .Alerts.Firing | len }}{{ if gt (.Alerts.Resolved | len) 0 }}, RESOLVED:{{ .Alerts.Resolved | len }}{{ end }}{{ end }}]{{ end }}

再添加一个模板
Template name 为 dingding-context
Template 内容为
{{/* 定义消息体片段 */}}
{{ define "my_text_alert_list" }}{{ range . }}

告警名称:
{{ index .Labels.alertname }}

告警机器:
{{ index .Labels.env }} {{ index .Labels.device }} {{ .Labels.instance }}

告警级别:
{{ index .Annotations.level }}

告警详情:
{{ index .Annotations.summary }}

触发阀值:
{{ index .Annotations.description }}

发生时间: {{ .StartsAt }} \n
{{ if eq .Status "resolved" }}
恢复时间: {{ .EndsAt }}
{{ end }}
{{ end }}{{ end }}

{{/* 定义消息体 */}}
{{ define "my.message" }}
{{ if gt (len .Alerts.Firing) 0 }}**--------发生告警---------**
{{ template "my_text_alert_list" .Alerts.Firing }}
{{ end }}
{{ if gt (len .Alerts.Resolved) 0 }}**-------恢复告警------**
{{ template "my_text_alert_list" .Alerts.Resolved }}
{{ end }}
{{ end }}
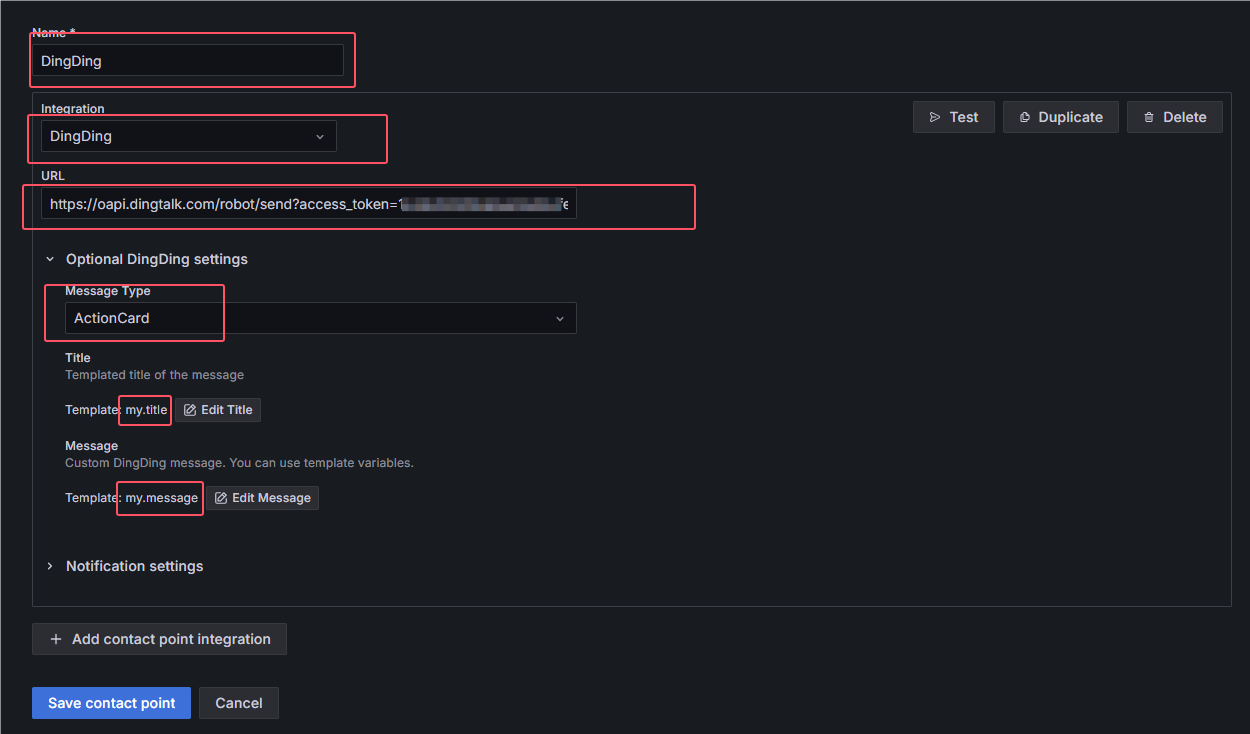
- 新增钉钉告警通道
点击 "Alerting" -> "Manage contact points" -> "Notification Templates" -> "Add contact point"

根据自身情况填写,Integration 选择 DingDing, Title 选择 my.title, Message 选择 my.message
测试告警
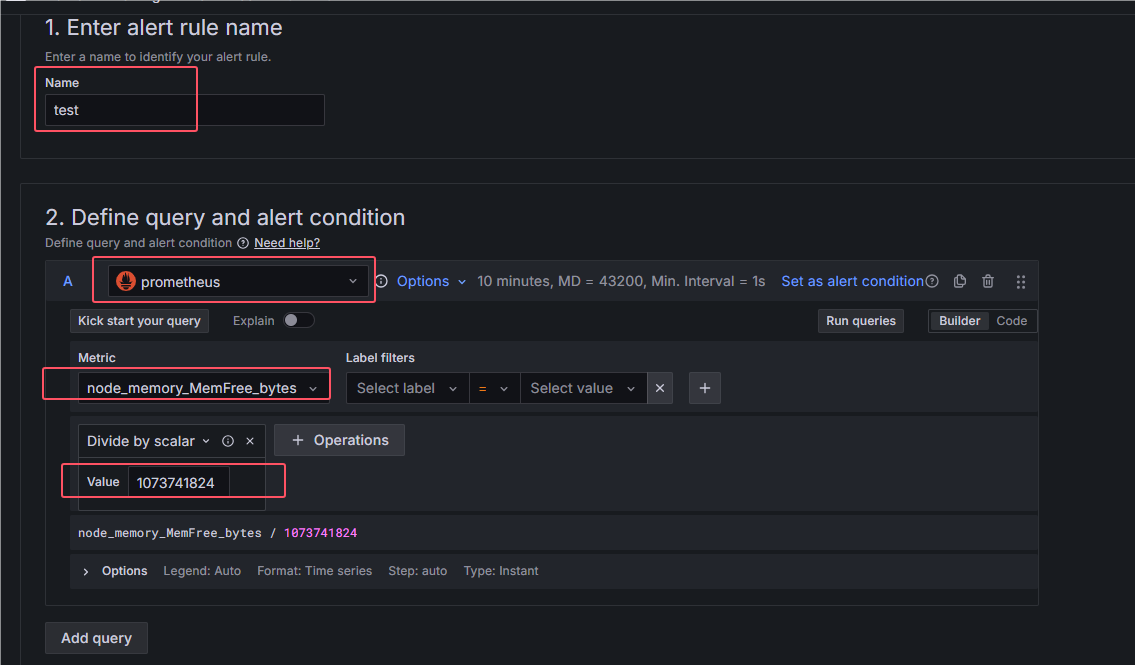
点击 "Alerting" -> "Manage alert rules" -> "New alert rule"


配置一个可用内存少于4G的告警


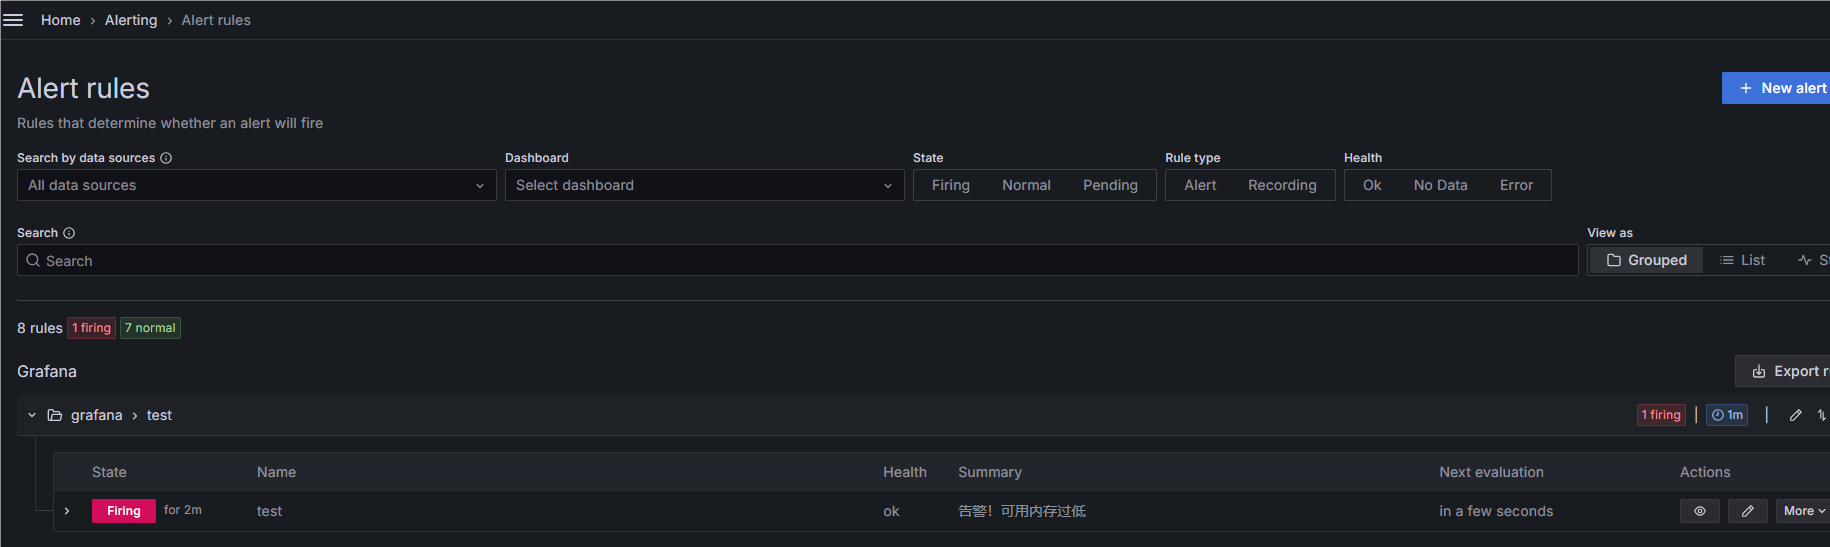
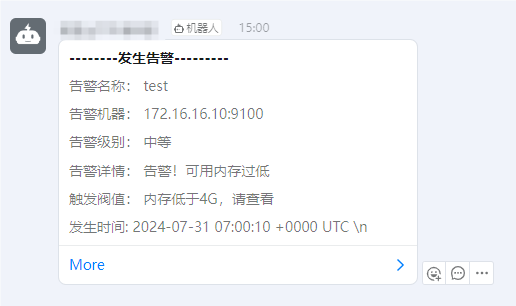
Grafana 面板看到了告警发生并且钉钉收到了告警信息

 浙公网安备 33010602011771号