
centos7部署jmeter+grafana+telegraf+prometheus/influxdb,构建性能测试可视化实时监控(三)
性能监控之Telegraf+InfluxDB+Grafana服务器实时监控
写在前面
前面两篇是docker-compose部署的,这篇是直接在centos7环境下部署的,凑合看吧...你说为什么没有继续用docker-compose,因为原来的机器被回收了,偷懒就直接centos7下部署了。
正文开始
JMeter的 PerfMonMetricsCollector插件支持收集服务器的性能指标,但是我们很少使用它,因为它收集起来的性能损耗太大了,另外,我们也需要收集JMeter的测试结果数据,在上文中,我们已经可以使用inflluxDB来存储性能测试结果,因此,我们也可以将服务器的性能数据存储到influxDB,那么通过Grafana我们可以实时得到一个炫酷的可视化看板。
目标
收集Linux APP服务器的性能指标:
- cpu
- disk
- disk.io
- processes
- swap memory usage
- memory usage
- system load and uptime
- network interface usage
- inodes usage
解决方案
Telegraf
除非我自己修改JMeter源码,否则JMeter不会把收集的性能数据持久化到数据库的,但这样的成本太高,因此,我们选择更简单成本低的Telegraf作为采集服务。
Telegraf 是一个用 Go 编写的代理程序,可收集系统和服务的统计数据,并写入到InfluxDB 数据库。Telegraf 具有内存占用小的特点,通过插件系统可轻松添加支持其他服务的扩展。
TICK家族
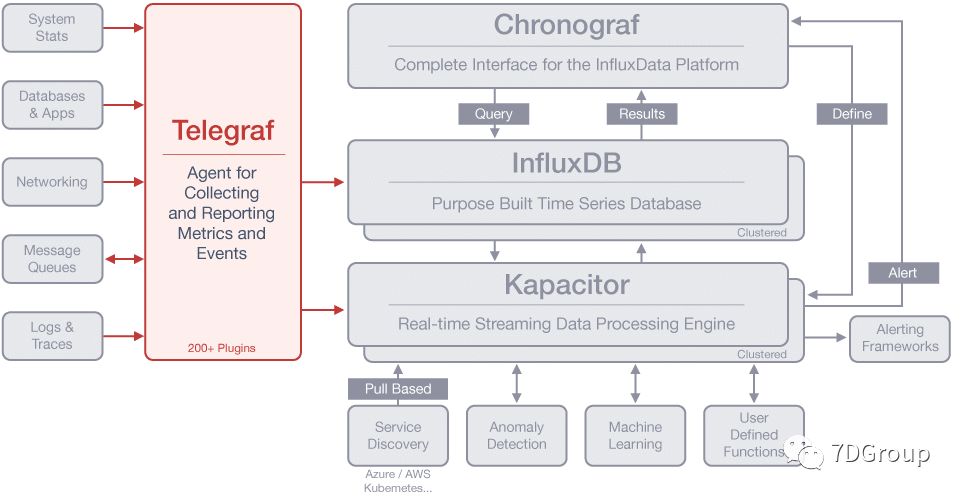
整体设计
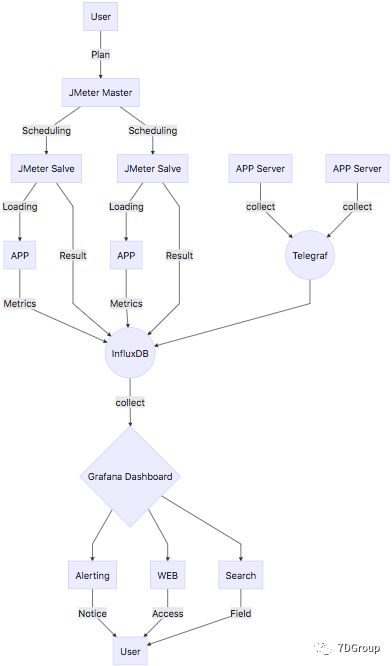
Telegraf&InfluxDB集成
InfluxDB下载安装
安装要求
网络端口
InfluxDB默认使用以下网络端口:
- TCP端口8086用于通过InfluxDB的HTTP API进行客户端-服务器通信
- TCP端口8088用于RPC服务以进行备份和还原
- 除了上面的端口,InfluxDB还提供了多个可能需要自定义端口的插件。可以通过配置文件修改所有端口映射,配置文件位于
/etc/influxdb/influxdb.conf默认位置。
网络时间协议(NTP)
InfluxDB使用主机的UTC本地时间为数据分配时间戳并用于协调目的。使用网络时间协议(NTP)同步主机之间的时间; 如果主机的时钟与NTP不同步,写入InfluxDB的数据的时间戳可能不准确。
下载安装
wget et https://dl.influxdata.com/influxdb/releases/influxdb-1.6.2.x86_64.rpm
sudo yum localinstall influxdb-1.6.2.x86_86_64.rpm
InfluxDB配置
找到InfluxDB配置文件(/etc/influxdb/influxdb.conf)
vi /etc/influxdb/influxdb.conf
influxdb.conf中的大多数设置都被注释掉了;所有注释掉的设置将确定为内部默认值。如果配置文件中的任何未注释的设置都会覆盖内部默认值。
请注意,本地配置文件不需要包含每个配置设置。
如果你无法找到配置文件,可以使用InfluxDB显示配置命令
Influxd config
Jmeter使用graphite协议去写入数据到InfluxDB,因此,需要在InfluxDB配置文件启用它,如下图所示:
[[graphite]]
  enabled = true
  bind-address = ":2003"
  database = "jmeter"
  retention-policy = ""
  protocol = "tcp"
  batch-size = 5000
  batch-pending = 10
  batch-timeout = "1s"
  consistency-level = "one"
  separator = "."
  udp-read-buffer = 0
修改后,使用以下命令加载InfluxDB启动
有两种方法可以使用配置文件启动InfluxDB:
1.使用以下-config选项将进程指向正确的配置文件
influxd -config /etc/influxdb/influxdb.conf
2.将环境变量设置为INFLUXDBCONFIGPATH配置文件的路径并启动
echo $INFLUXDB_CONFIG_PATH/etc/influxdb/influxdb.confinfluxd
启动influxdb
[root@kangpc ~]# influxdb
InfluxDB操作
[root@kangpc ~]# influx  #登录数据库
Connected to http://localhost:8086 version 1.6.2InfluxDB shell version: 1.6.2
> show databases  #查看所有数据库
name: databases
name
----
_internal> CREATE DATABASE "telegraf" #创建数据库
> use telegraf               #切换数据库
Using database telegraf
> CREATE USER "admin" WITH PASSWORD 'admin' WITH ALL PRIVILEGES # 创建管理员权限的用户
Telegraf下载安装
wget https://dl.influxdata.com/telegraf/releases/telegraf-1.7.4-1.x86_64.rpm
sudo yum localinstall telegraf-1.7.4-1.x86_64.rpm
配置Telegraf
[root@kangpc ~]# vi /etc/telegraf/telegraf.conf
# Configuration for sending metrics to InfluxDB
[[outputs.influxdb]]
  ## The full HTTP or UDP URL for your InfluxDB instance.
  ##
  ## Multiple URLs can be specified for a single cluster, only ONE of the
  urls = ["http://127.0.0.1:8086"]

  ## The target database for metrics; will be created as needed.
  database = "telegraf"

  ## Name of existing retention policy to write to.  Empty string writes to
  ## the default retention policy.  Only takes effect when using HTTP.
  retention_policy = ""

  ## Timeout for HTTP messages.
  timeout = "5s"

  ## HTTP Basic Auth
  username = "telegraf"
  password = "telegraf"
启动Telegraf
[root@kangpc ~]#systemctl start telegraf
查看数据
[root@kangpc ~]# influx
Connected to http://localhost:8086 version 1.6.2
InfluxDB shell version: 1.6.2
> show databases
name: databases
name
----
_internal
jmeter
telegraf
> use telegraf
Using database telegraf
> show measurements
name: measurements
name
----
cpu
disk
diskio
kernel
mem
processes
swap
system
InfluxDB&Grafana集成
下载安装grafana
wget https://s3-us-west-2.amazonaws.com/grafana-releases/release/grafana-4.6.3-1.x86_64.rpm
yum localinstall grafana-4.6.3-1.x86_64.rpm
启动grafana服务
[root@kangpc ~]# service grafana-server start
Starting grafana-server (via systemctl):                   [  确定  ]
[root@kangpc ~]# systemctl start grafana-server
linux下启动服务可以用
service server-name start或者systemctl start server-name
在window下访问http://192.168.0.107:3000/login ,端口号默认是3000,不知道端口号,可以看下grafana的配置文件,默认位置在
[root@kangpc ~]# vi /etc/grafana/grafana.ini
# The http port  to use
;http_port = 3000
3000端口默认是未开启的,需要手动开启
[root@kangpc ~]# firewall-cmd --list-ports  # 查看开启的端口

[root@kangpc ~]# firewall-cmd --zone=public --add-port=3000/tcp --permanent  # 开启指定端口
success
[root@kangpc ~]# firewall-cmd --reload # 重启firewall
success
[root@kangpc ~]# firewall-cmd --list-ports
3000/tcp
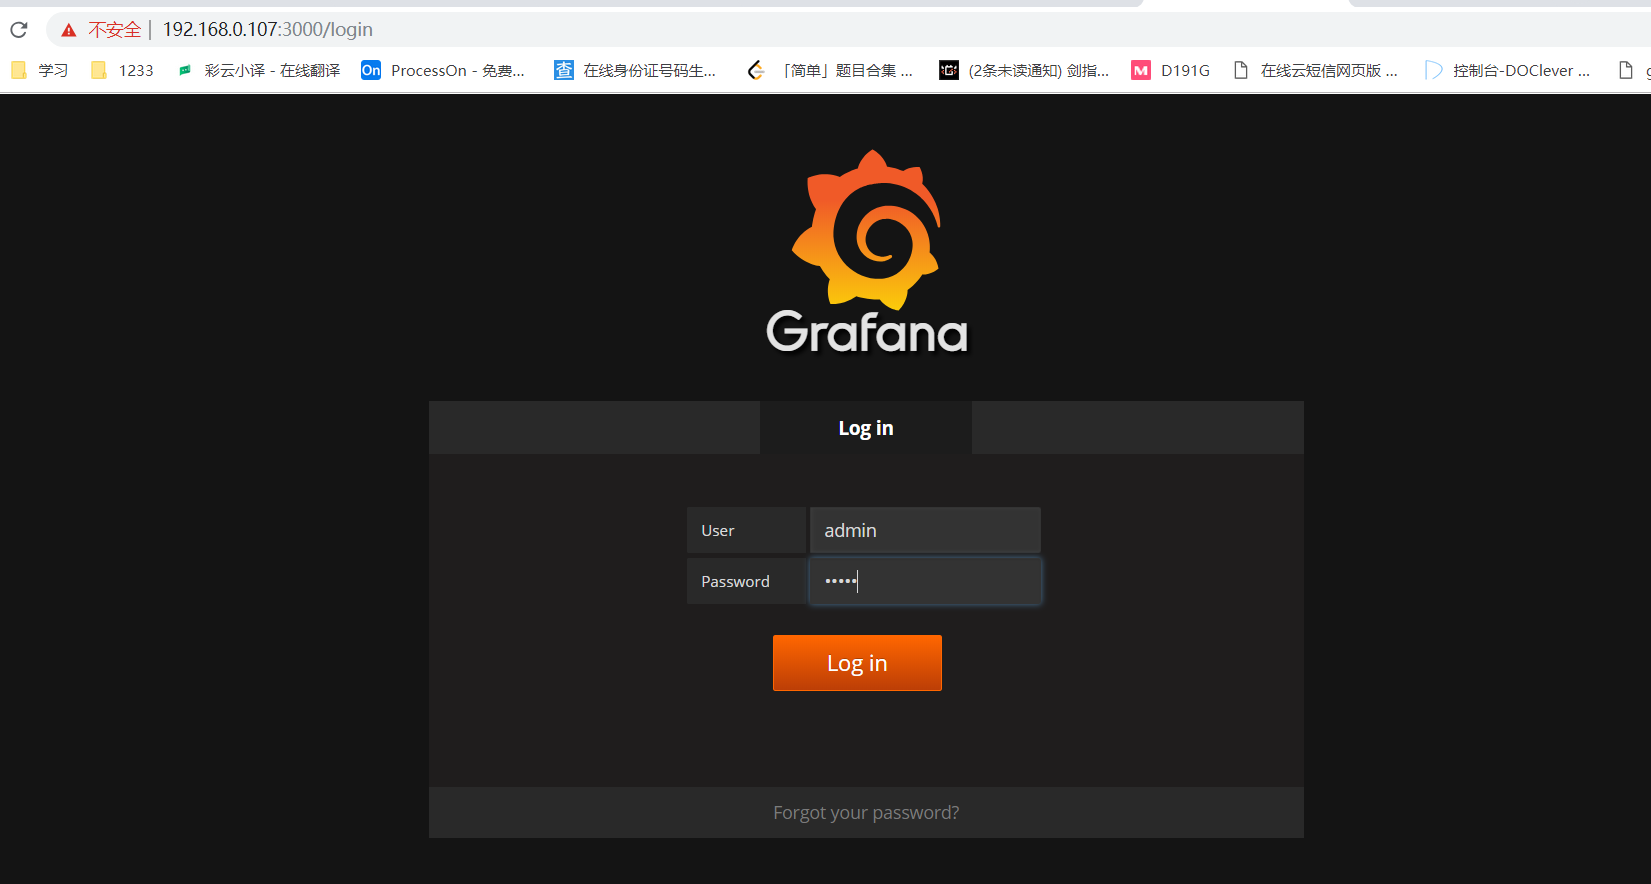
端口开启后,可以重启一下grafana服务,然后访问http://192.168.0.107:3000/login ,默认用户名/密码:admin/admin,可见如图
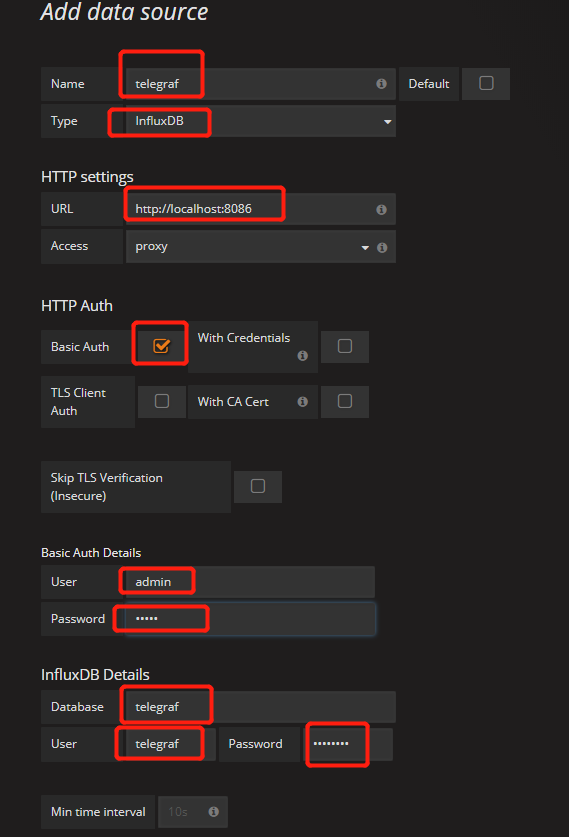
Grafana新建数据源
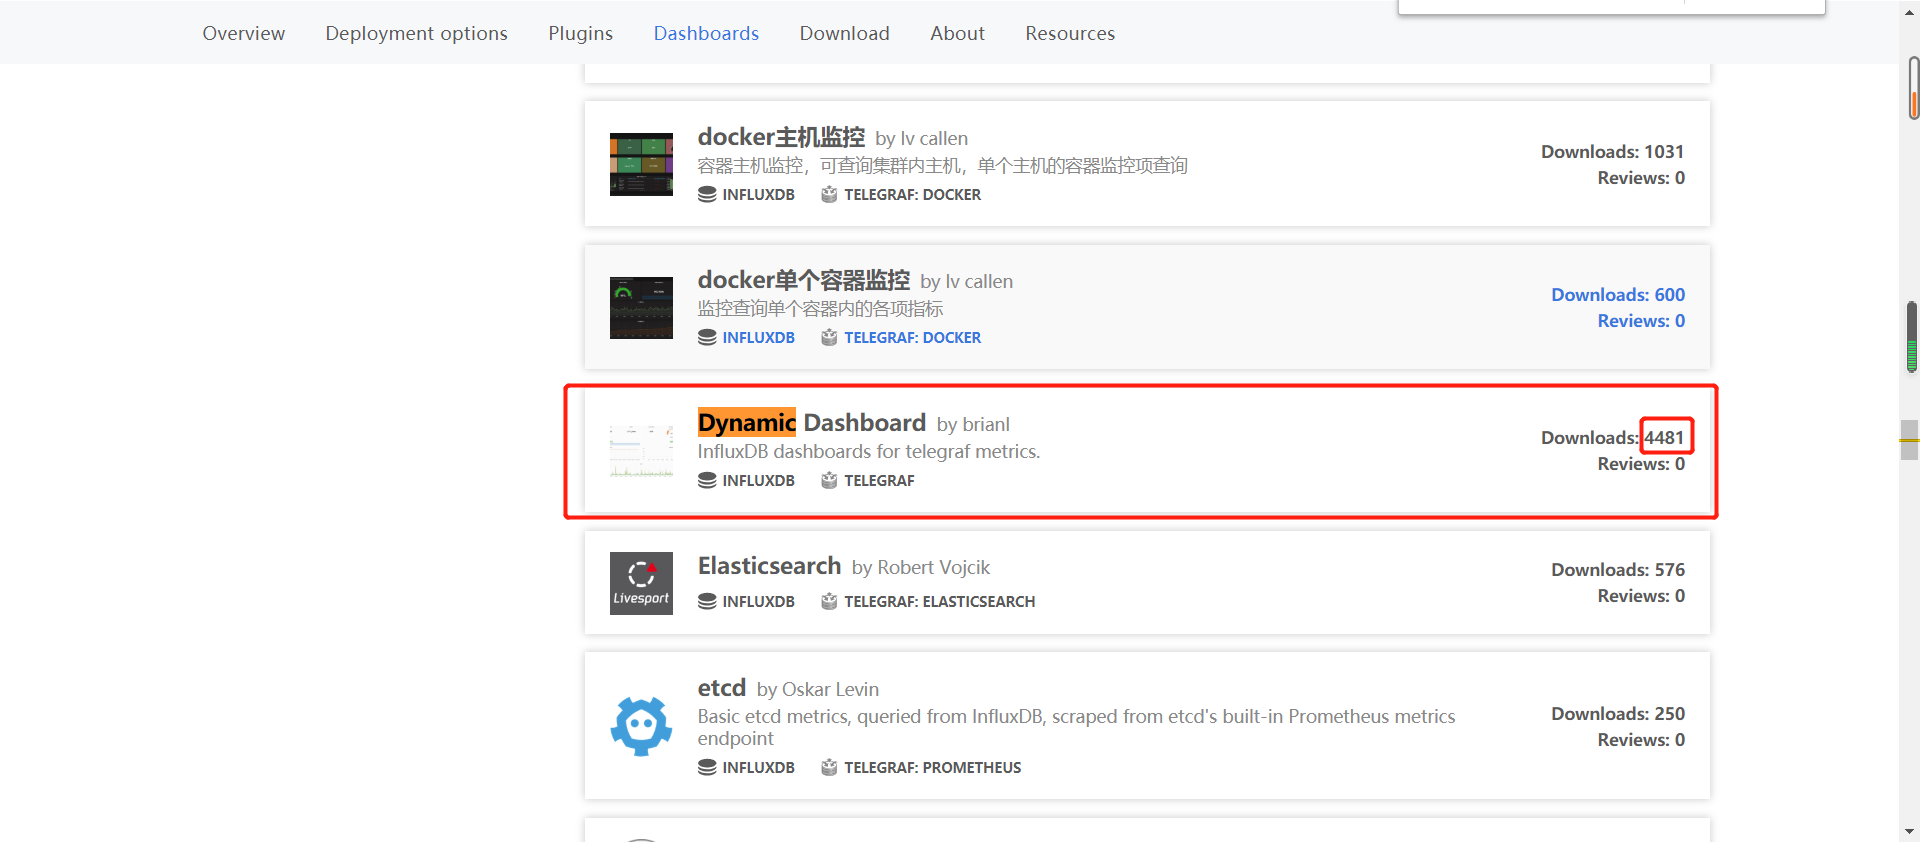
下载看板模板
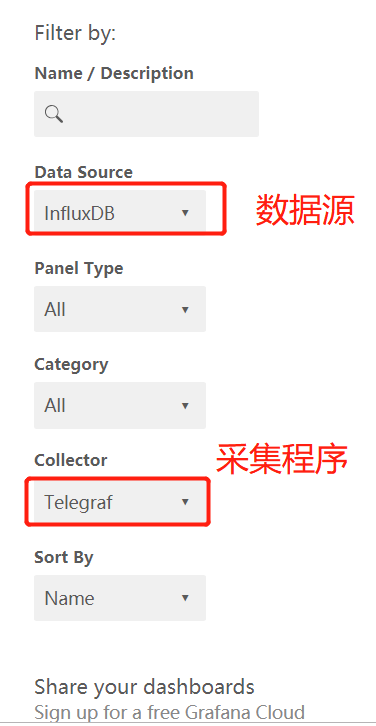
这里选择dynamic dashboard,图中框起来的ID 4481是会变的,网上有很多教程,当你看到id,建议到官网去确认下,这一点在我同系列前面的文章有讲过
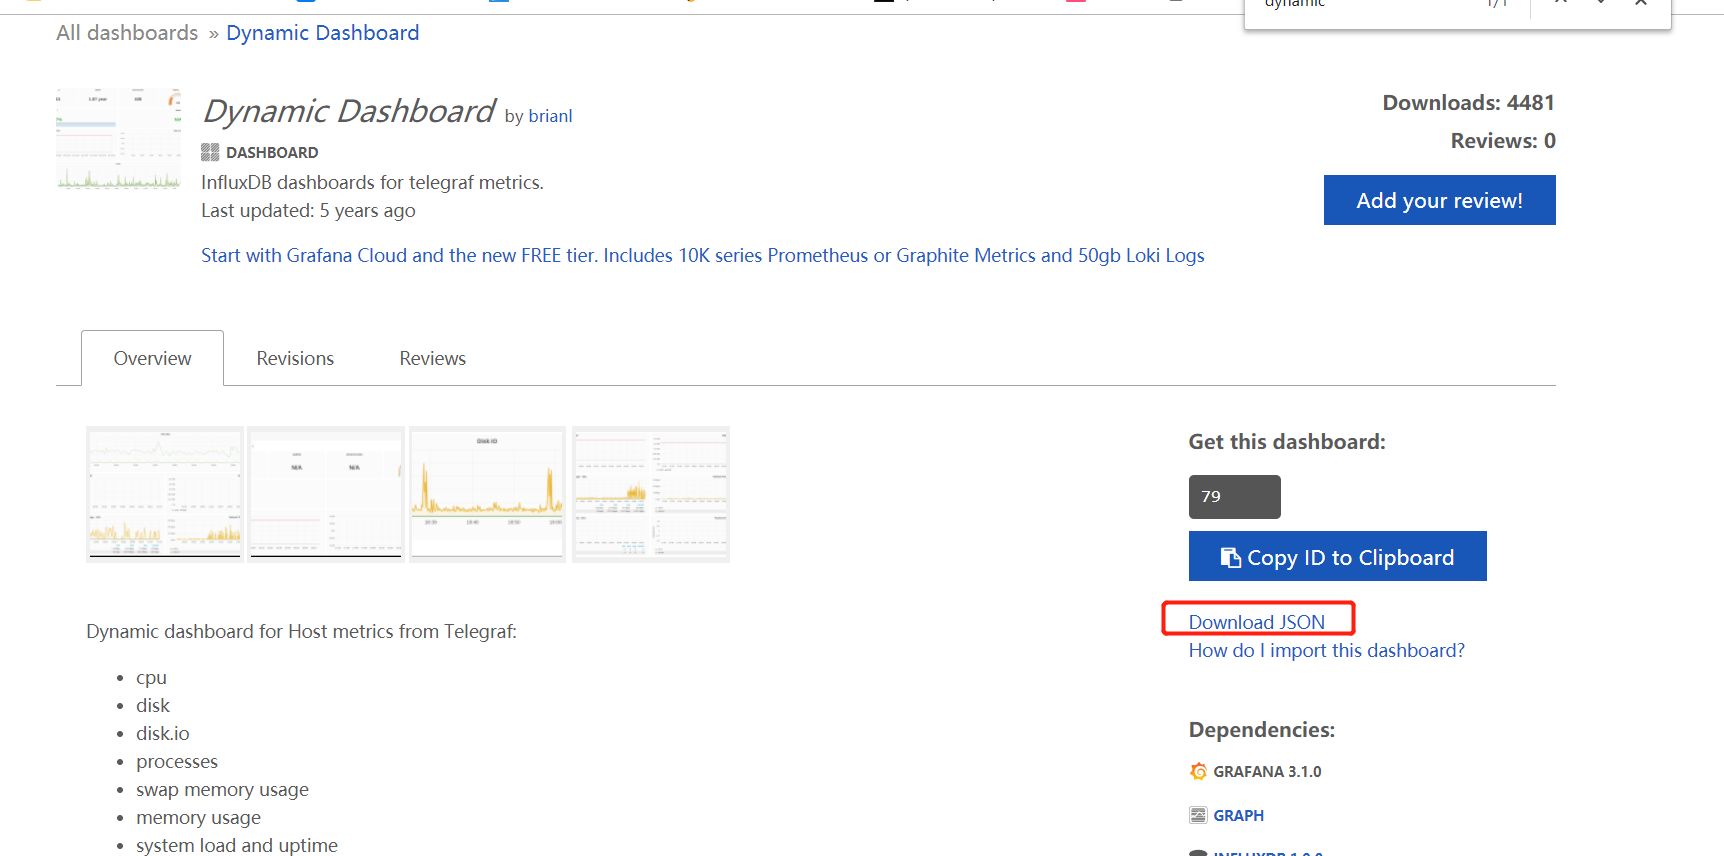
下载看板
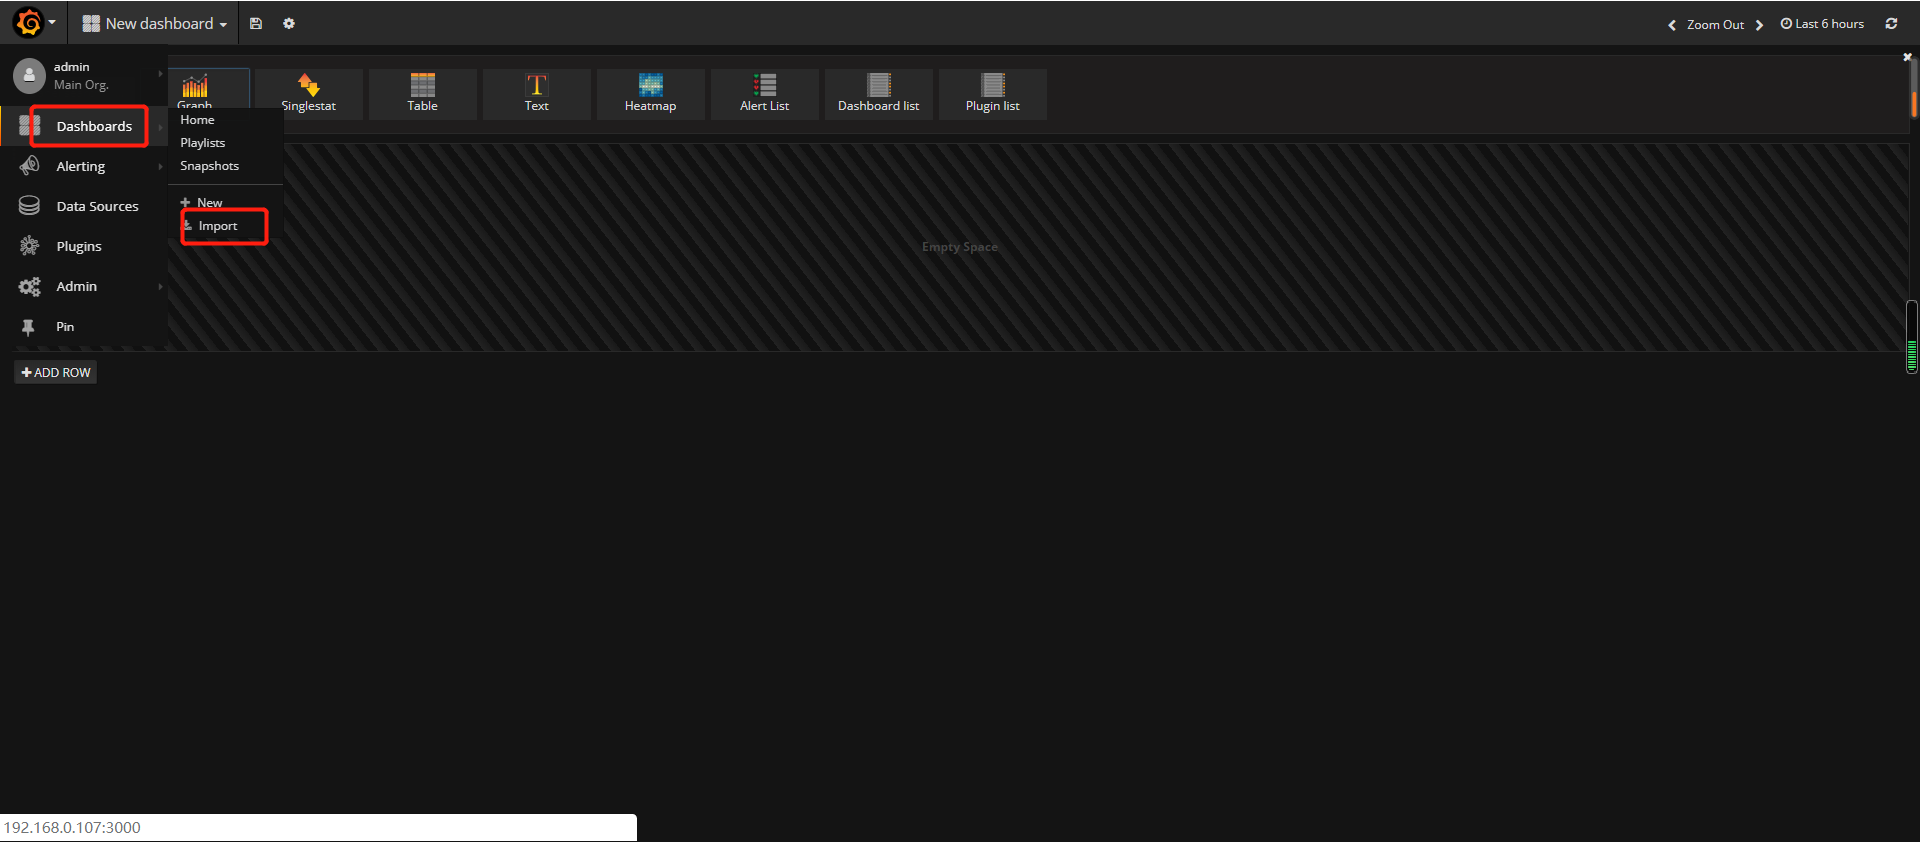
grafana导入模板
选择数据源
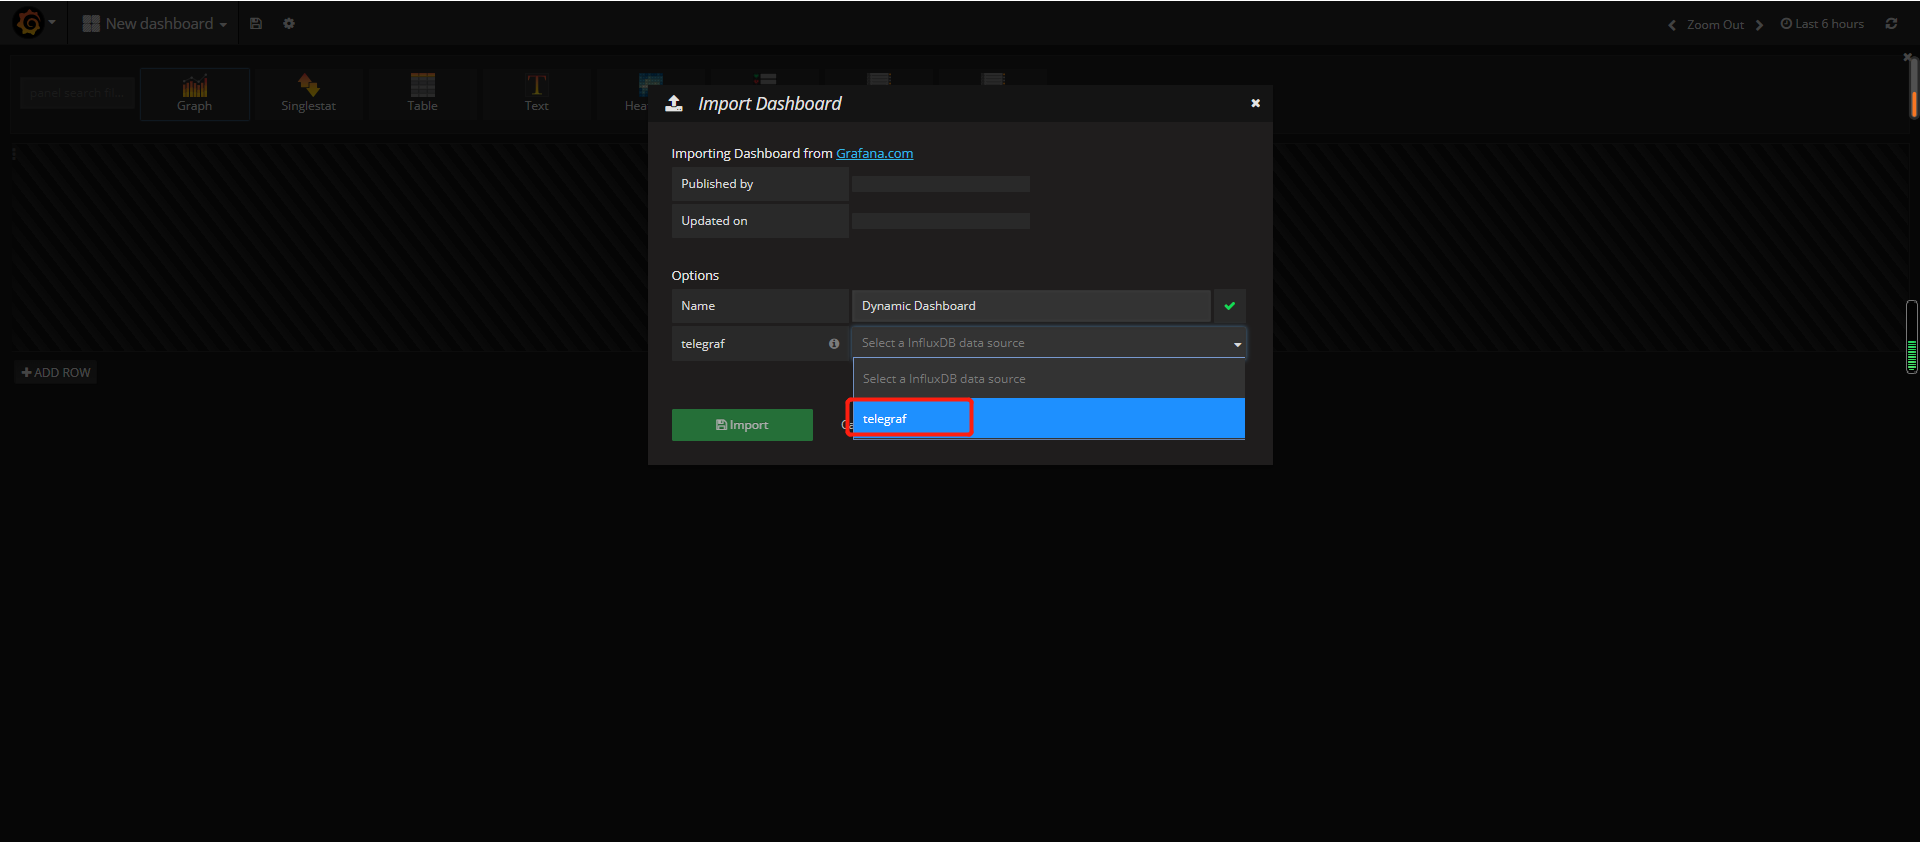
最后是展示效果图
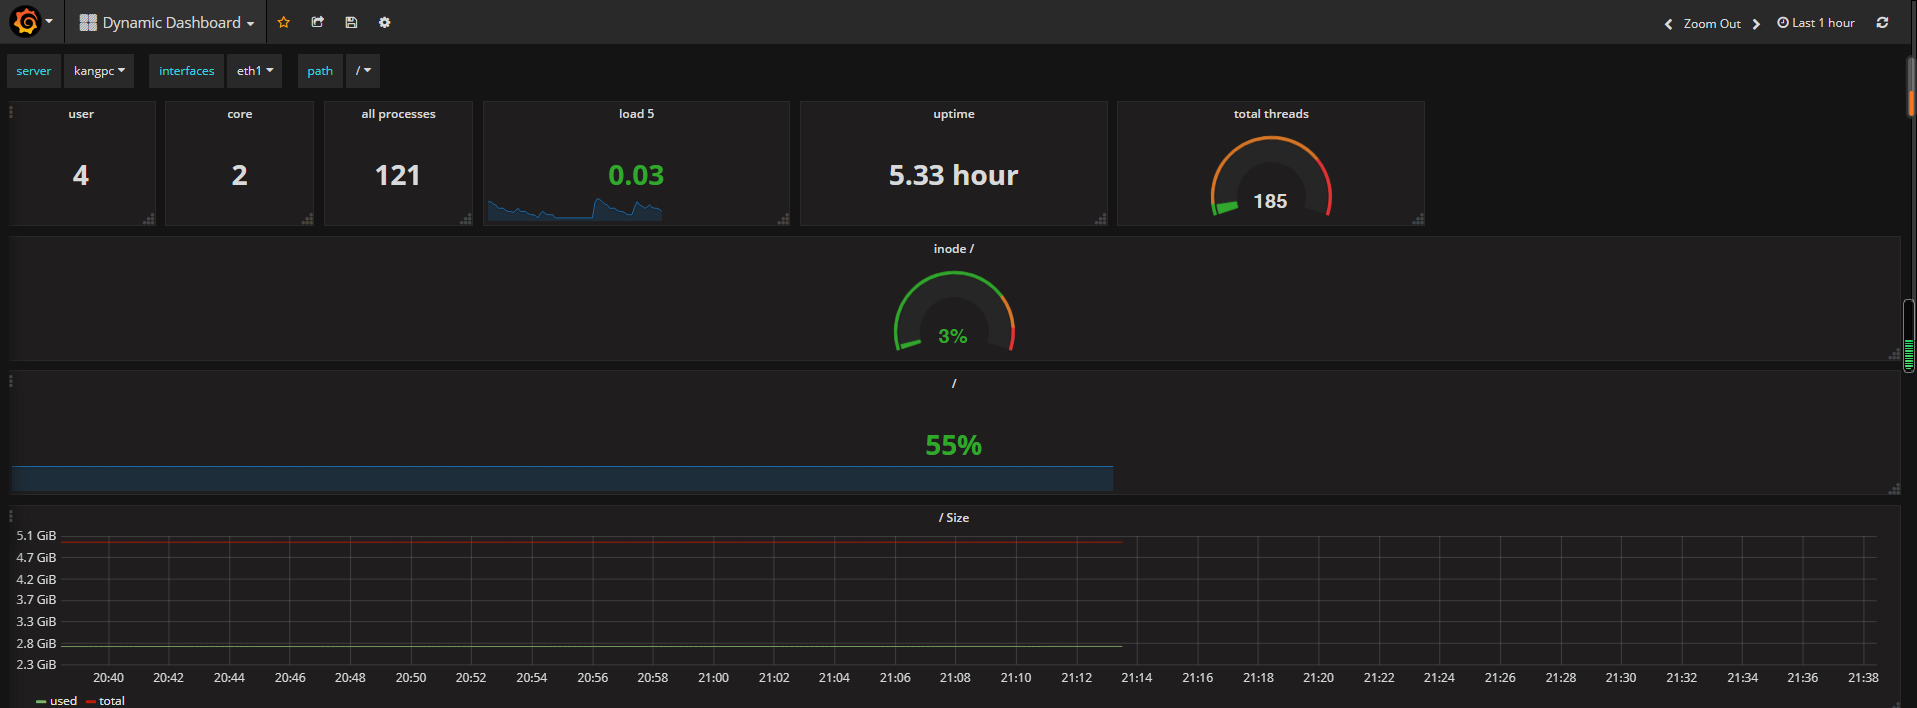
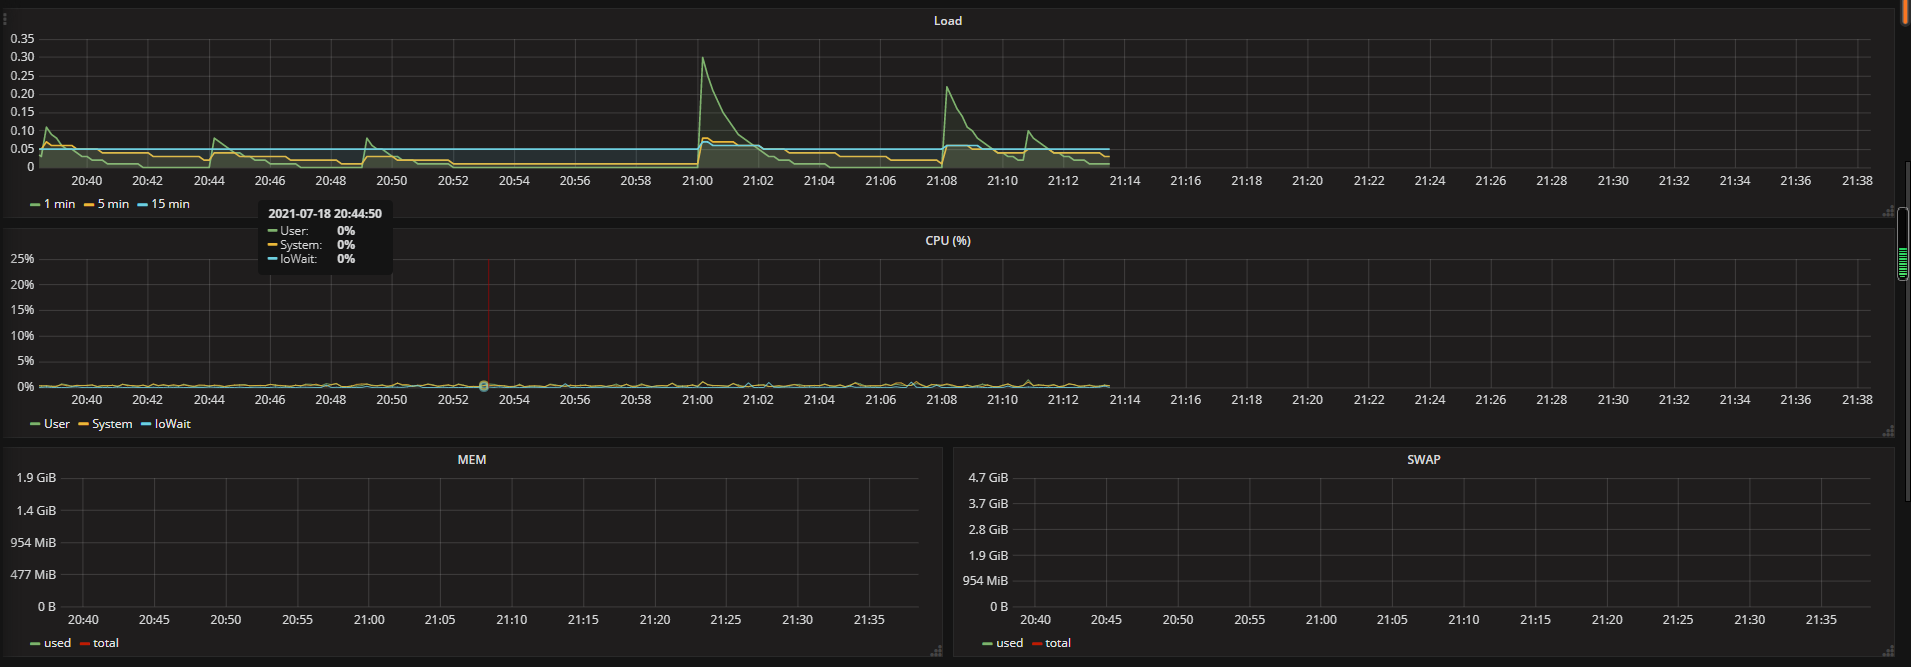
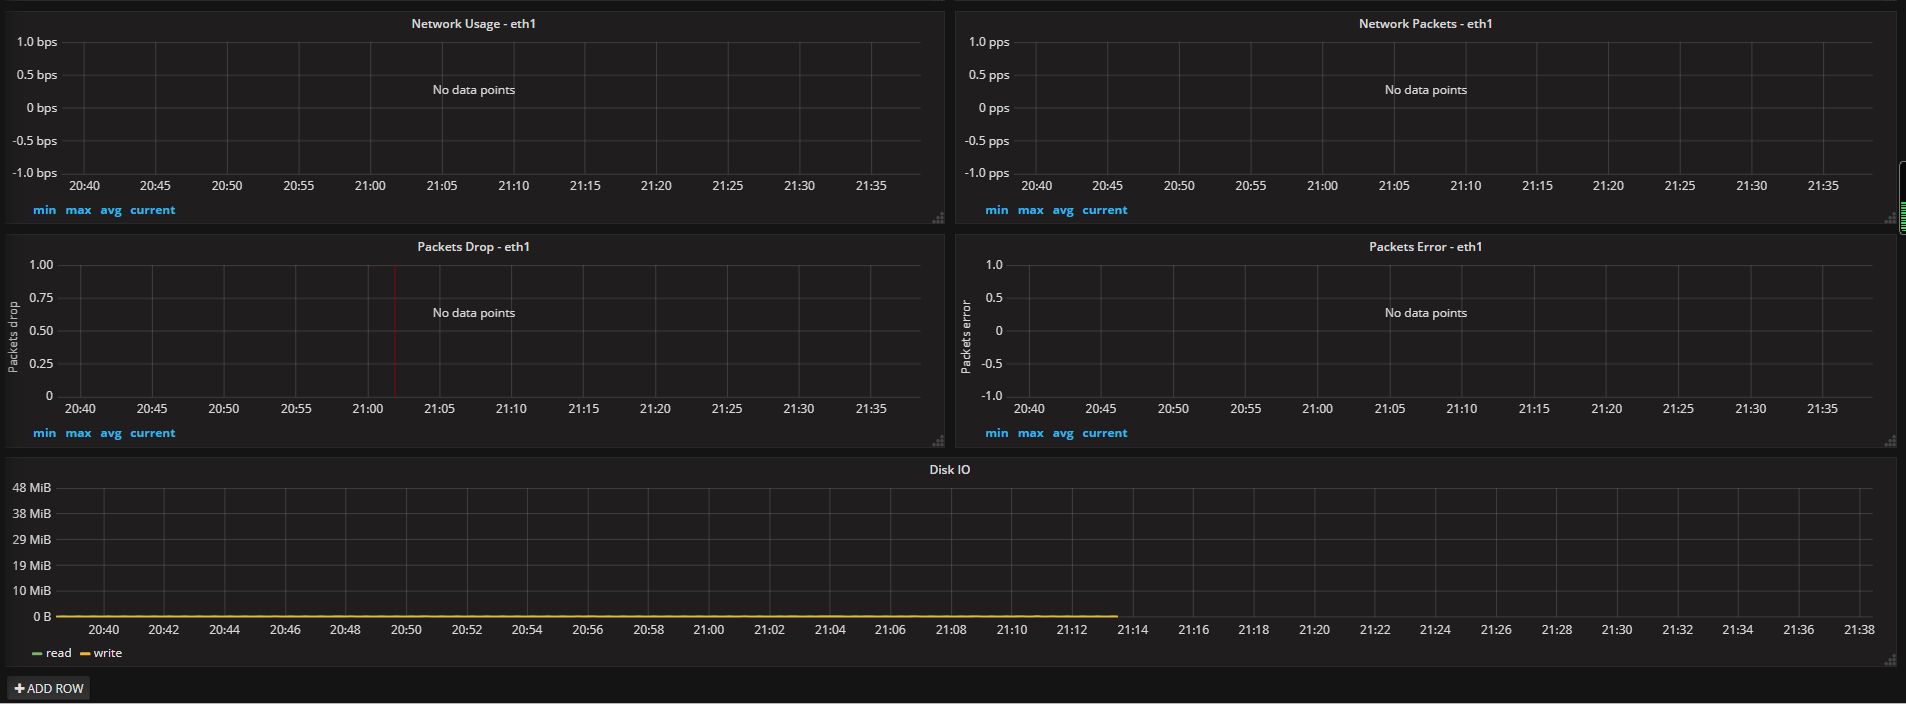
到这里,jmeter的和应用服务器的监控数据,就都展示在了grafana看板了。

 浙公网安备 33010602011771号